We just lost a great market analyst, market timer and champion of investors. We found out today that Sy Harding, editor of the
Street Smart Report passed away this week. We wish the Harding family our deepest sympathies. Sy was frequently ranked as “Top Ten Market Timer” and helped investors make money for more than 26 years.
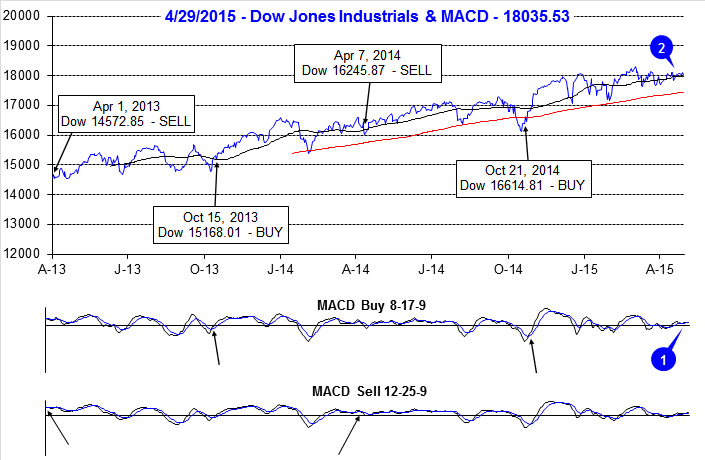
Perhaps his most famous contribution to market analysis and investment strategies was when he enhanced our “Best Six Months Switching Strategy” with Gerald Appel’s MACD indicators, dubbing it the “best mechanical system ever.” His “Seasonal Timing System” was made famous in his critically acclaimed book Riding the Bear (Adams Media, 1999).
As we enter the Worst Six Months May-October, it is important not to get hung up on the infamous phrase: “Sell in May and go away.” We do not suggest purely going away in May. We do however, suggest changing your investment posture from aggressive to defensive and taking some action, especially with the market looking like it’s on shaky ground and ready to breakdown.
We generally, limit new long positions (unless it is in a
good Worst Six Months sector), sell losers or underperformers we have lost confidence in, tighten stops and begin to put on defensive positions in bonds and shorts. With the market now in the red for 2015 and quite weak in usually strong April, negative implications are building. GDP disappointed, while jobs and housing languish. Greece is likely to remain in the Euro, but it’s going to be expensive and a drag on the European economy, while the Eurozone and the big Asian economies are already struggling.
May has been weaker lately and especially so in pre-election years. Also our favorite
sentiment survey,
Investors Intelligence % Advisors Bullish and Bearish has gotten more complacent. The new market highs coincided with a hefty rise in Bulls to 57.4%, up from 52.5% and 50.5% the previous two weeks. Bears dropped to 13.9% from 15.2% and those expecting a correction fell to 28.7& from 15.2%. It’s not quite extreme yet, but it’s close.
Vegas Baby!
- Tuesday, May 12, 2015 3:15 PM - 3:45 PM Stage Presentations in the Exhibit Hall - What's Next for the Stock Market?
- Thursday, May 14, 2015 8:00 AM - 8:45 AM Educational Presentation - Learning the Discipline and Strategies to Become a Successful Trader
- Thursday, May 14, 2015 11:10 AM - 11:55 AM Investment Masters Symposium Presentation - Tactical Sector Rotation Strategies
On Thursday, May 14, 2015 join Jeff & Joe Childrey, Probabilities Fund Management Founder & CIO for a special
ADVISORS ONLY Happy Hour! - RSVP
Jeff.Hirsch@hirschorg.com
Official Seasonal MACD Sell Signal Triggers
It is rather ironic that on the day we hear of Sy’s passing we issue our Best Six Months Seasonal MACD Sell Signal. As of today’s close, both the slower and faster moving MACD indicators applied to DJIA and S&P 500 are negative. At this time, we are issuing our official MACD Seasonal Sell signal for DJIA and S&P 500. NASDAQ’s “Best Eight Months” last until June.
Current technical, fundamental, seasonal, sentiment and monetary policy outlooks are aligning to signal increasing odds of a volatile ‘Worst Six Months” this year. Year-to-date gains, in a pre-election year, are well below average which is also worrisome. Although the odds of an outright 20% bear market remain low, the odds of a 10-19.9% correction in late Q2 or Q3 are rising.
Sell SPDR DJIA (DIA), SPDR S&P 500 (SPY), SPDR Retail (XRT), iShares DJ Transports (IYT), SPDR Financial (XLF), SPDR Industrial (XLI) and SPDR Materials (XLB).
Continue to Hold technology and small cap related ETFs as NASDAQ’s “Best Eight Months” ends in June.
We will also continue to Hold healthcare and consumer staples related ETFs as both sectors have track records of outperforming during the “Worst Six Months.”
Buy AdvisorShares Ranger Equity Bear (HDGE) on dips with a Buy Limit of 10.78, iShares 20+ Year Treasury (TLT) on dips with a Buy Limit of 125.73 and iShares Core US Aggregate Bond (AGG) on dips with a Buy Limit of 110.86.
Traders/investors following the Best 6 + 4-Year Cycle switching strategy detailed on page 62 of the Stock Trader’s Almanac 2015 can ignore this signal, but should strongly considering tightening stop losses and adding some downside protection.
Pulse of the Market
As we write this sentence, the faster and slower moving MACD indicators applied to DJIA (1) and S&P 500 are flirting with turning negative. When MACD Sell indicators applied to both DJIA and S&P 500 turn negative, the Worst Six Months will officially begin. A DJIA close below 17970.13 and S&P 500 below 2095.80 today is what is would take. Beyond DJIA’s MACD indicator, its loss of positive momentum is rather clear as it continues to struggle with its 50-day moving average (2). Should DJIA fail to hold its 50-day average, it next key support level, the 200-day moving average is currently at 17377.
Absent catalyst, the market has traded essentially sideways since mid-December. Over the past 20 weeks DJIA (3) has been up 10 and down 10 with a net gain of just 121.35 points. The seesaw battle between bulls and bears has really heated up on Fridays and Mondays with rather large DJIA point moves in both directions (4). Thus far the battle has been a draw. Should the bears get the upper hand on Fridays and Mondays, the market will likely take a turn toward the downside. S&P 500 (5) and NASDAQ (6) have the same weekly record over the past 20 weeks, although they have broken out to modestly higher new all-time highs.
One bright spot for the market is that the ratio of Weekly NYSE Advancers to Decliners remains reasonably healthy. The number of NYSE Weekly New Highs (7) has been constrained in recent weeks, which is a reason for concern, but Weekly New Lows remain subdued. Should New Lows begin to swell, then the market will be in trouble. For now, it is meandering with an upward bias.
After hitting its lowest reading since June 2014, six weeks ago, the weekly CBOE Put/Call ratio (8) has returned to a neutral level of 0.61. At this level, it provides little insight into the market’s next move. A reading above 0.70 accompanied by market weakness would suggest the worst could be over while a reading under 0.50 would suggest traders and investors are “all in” and further gains are likely to be limited and short-lived.
Click for larger graphic…
Disclosure Note: At press time, officers of the Hirsch Organization, or accounts they control held positions in UNG, USO, XLU and XLV.