Santa Claus failed to call on Wall Street in 2015. The January Barometer looks likely to be a downer unless the S&P 500 can rally 37 points tomorrow to close positive for the month. This is only about 1.8% and is not inconceivable. However, market action so far this year has been weak and mostly negative. This has been fueled by plummeting oil prices, weakness overseas, confusion about the Fed’s next move and it’s bellowing about low inflation. Our 24/7 business news cycle has certainly fanned the flames.
Yes, Santa’s absence and a down January are bad omens, but they do not guarantee unmitigated market catastrophe. The First Five Days were positive and the Dow’s December closing low has not been breached as of yet. Our antennae are purring and additional caution and prudence is being applied to our portfolios, trades and open positions. While this all sounds horrible and feels painful, if you take a step back things are not really that bad.
Lower oil and energy prices, while a drain on energy companies and the people they employ, puts a lot of money back in the pockets of individuals to put into the economy and the stock market. European quantitative easing funds are likely to find their way into the U.S. stock market where prospective returns are greater. While a host of big names had earnings misses that rocked the major indices, the bulk of companies reporting so far have beaten or met forecasts. The big name misses and index declines are masking underlying strength. Take a look at the expanding new highs in the Pulse of the Market Below. Jobless claims came in today at the lowest since April 2000 and other economic data continue to show healthy expansion.
The market is only down about 5% from the highs and whether or not January ekes out a positive number we expect further moves both higher and lower. Volatility is back and here to stay. Expect more of it moving forward this year and beyond. There is another full-blown bear market lurking in the not too distant future and it may even commence in 2015, but we do not believe it has begun just yet and expect higher prices before the any bear market or major correction.
After this correction that may continue into February, look for another push higher. As we detailed in our Annual Forecast we expect a high most likely in the first half of 2015 around Dow 19000, S&P 2250 and NASDAQ 5000, slightly higher or lower than NASDAQ’s all-time high. The rest of 2015 should see a move sideways to slightly higher with volatility and corrections and an ultimate high near yearend 2015.
Pulse of the Market
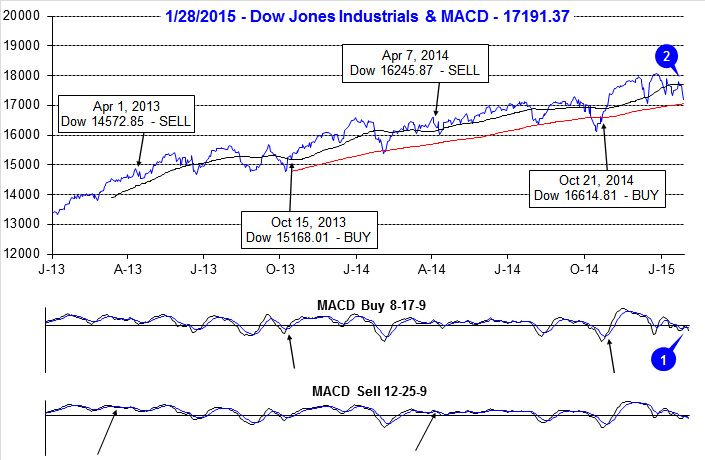
After wrapping up the fourth quarter of 2014, DJIA has struggled in the New Year. Both the faster and slower MACD indicators were positive on the first trading day of the year, but treading lower and on the second trading day, both turned negative (1) and remain so as of yesterday’s close. With the exception of four trading days, DJIA has spent nearly the entire month of January below its 50-day moving average (2). However, it important 200-day moving average has not been breached. This key level is currently at 16,978. A close below this level would also be a close below DJIA’s December closing low which has historically been a cause for heightened caution.
Should DJIA finish the week near current its current level, it will be the fourth losing week (3) out of the last five. At the end of the current streaks second weekly decline, DJIA recorded its first Down Friday/Down Monday (DF/DM) of 2015 (4). The long-term record of DF/DMs was distorted by Fed QE, but now that QE has ended, DJIA appears to be returning to the trend of further weakness following a DF/DM. In previous bull markets since 2003, DJIA recorded an average 3.8% decline over the next 24 calendar days following a DF/DM. A decline of this magnitude would put DJIA just below its current 200-day moving average.
This week’s declines will also extend S&P 500 (5) and NASDAQ (6) losing streaks to four of the last five weeks. The last similar streak began in early-September of last year and ended in mid-October with five declining weeks out of six. The end of that streak coincided closely with our Seasonal MACD Buy signal and proved to be a good opportunity to establish new long positions or add to existing ones.
Last week’s gains were accompanied by a favorable ratio of Weekly NYSE Advancers to Decliners (7). This is not likely to be the case this week. Interestingly, NYSE New Highs continued to expand (8) even as the major indices have struggled. This could indicate that there is more underlying strength in the overall market than the currently struggling indices imply.
Moody’s AAA Corporate Rate (9) is also continuing to decline indicating solid demand for high-rated corporate debt. AAA-rated companies will be able to borrow cheaply keeping stock buybacks and dividend increases on the rise, both of which have generally been bullish for the market.
Click for larger graphic…