In average years, Treasury bonds have been a relatively safe place to park cash during the “Worst Four/Six Months” of the year for DJIA, S&P 500 and NASDAQ and other times of economic uncertainty. However, in recent years, the heavy hand of the Fed has distorted this seasonality. Round after round of QE sent demand for Treasury bonds soaring and interest rates lower, much lower. Now the concern is the Fed may actually start to raise interest rates sometime this year and Treasury bond prices have been falling sending yields higher.
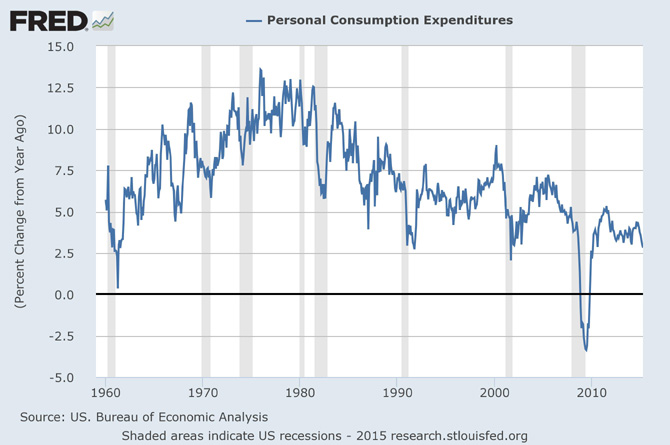
Is the Fed really going to raise interest rates sooner rather than later or are they just squawking to keep rates from going negative and creating a whole new batch of problems? The Fed’s mandate, from Congress, is maximum employment and stable prices. No hard numbers were provided, but the Fed has said it considered the unemployment rate at 6% (ish) to be good and a 2% annual change in personal consumption expenditures (PCE) would be an indication of stable prices. In the following two charts, this criterion has been met.
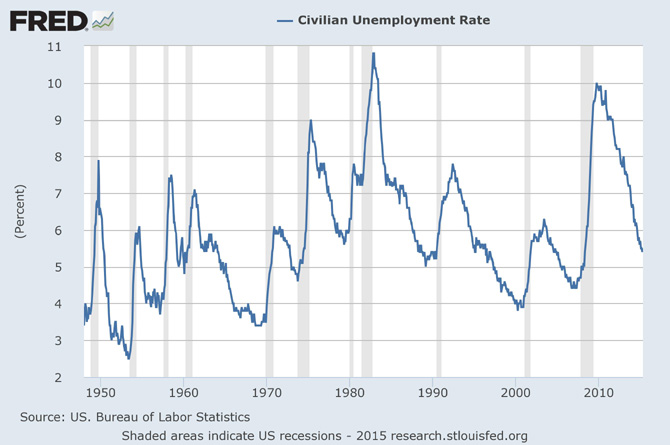
But wait, data junkies like us know these are some rather highly massaged figures. Yes unemployment has fallen to 5.5% as of May, but one of the largest reasons for the decline is a rather hefty decline in the labor force participation rate. This rate peaked in 2000, declined modestly and stabilized around 66% before plunging to less than 63% when the Great Recession struck in 2008. It is at its lowest level in nearly 40 years. Demographics could explain some of the trend, but this does not look like maximum employment.
Then there is the little issue of consumer price inflation (CPI). Unlike PCE, CPI has been less than or equal to zero for the last four months and this trend is still pointing lower, not higher. Two indicators heading in two different directions, one reportedly measures prices and the second spending. Not exactly the best argument for stable prices.
What about actual growth? Here again another chart that does not really support much higher interest rates. 2015 Q1 GDP decreased at an annual rate of 0.7%. While year-over-year GDP has barely managed to maintain 2.5% since 2010. This is well below average when compared to previous recovery periods.
Sluggish growth, falling prices and a labor market that is at best of questionably health do not make the strongest case for any meaningful rate increases by the Fed. Zero is obviously a problem they would like to fix, but the solution is likely to only be 0.5% to 0.75% increase in tiny, deliberate and painfully slow steps. This seems far less than what the Treasury bond market is currently pricing in.
Stock Portfolio Updates
Over the past three weeks since last update, through the market’s close on June 8, S&P 500 declined 2.3%. Russell 2000 was down 0.3% over the same time period. Collectively the three Almanac Investor Stock Portfolios slipped 0.7%. Individual stocks within our Portfolio essentially followed broad market trends, but our decline was buffered by its cash position that has grown to 65.6% of the total portfolio. Similar to the decline suffered by the large-cap S&P 500, our Large-Cap portfolio suffered the greatest decline, shedding 3.6%. Mid-Caps were best, off just 0.1%. The Small-Cap portfolio matched the Russell 2000 decline exactly, 0.3%.
Per last month’s update, Insteel Industries (IIIN) and Rocky Mountain Chocolate Factory (RMCF) were closed out of the Small-Cap portfolio. IIIN was closed out using its closing price on May 19 while RMCF traded as high as $13.70 on May 20 (and several days thereafter) offering ample opportunity to sell at $13.40 or better. All said, IIIN was closed out for a loss of 3.4% and RMCF was sold at a 1.6% loss. Patient and/or more nimble traders likely fared better.
Our Mid-Cap portfolio’s four holdings continue to look solid. JetBlue (JBLU) has taken a hit recently along with the rest of the airline stocks and the broader transportation sector. JBLU is, in our opinion, one of the best managed airlines. This is confirmed by actual seat time on its planes and by its peer besting revenue growth over the past year. Due to solid industry-wide auto sales, the previous Mid-Cap portfolio underachiever, Group 1 Automotive (GPI) and Lithia Motors (LAD) have both enjoyed swift moves higher since the start of June. The strong positive trend in auto sales data suggests there is more room for these two stocks to run. All positions in the Mid-Cap portfolio are on Hold.
In the Large-Cap portfolio, Polaris Industries (PII) and Avis Budget Group (CAR) were closed out of the portfolio using their closing prices on May 19. CAR has drifted lower since then and was a timely executed trade. However, closing out PII would have been much better on May 20 as shares popped over $7 that day. Nonetheless, PII is right back to its old ways and is headed lower again. Previously mentioned airline stock weakness also hit United Continental Holdings (UAL) and it closed below its stop loss on May 20. Profits taken on the one-third of the UAL position sold in December combined with the sale of the remaining position add up to a 38.7% gain overall.
The “Best Six Months” for DJIA and S&P ended on April 30. NASDAQ and Russell 2000 “Best Eight Months” ended on June 4. All other positions, not specifically mentioned above, are on Hold. See table below for updated Stop Losses.