Last month we put out the caution flag for June. Market valuations were running high and the major averages were struggling to breakout above resistance. The Fed was continuing to confuse the market with when they will raise rates and Greece and the EU were continuing to aggravate the market with their exasperating battle on the Greek sovereign debt bailout plan.
Considering all this technical and fundamental market pressure and the fact the June is the last month of NASDAQ’s Best 8 Months, we felt caution was in order. Not much has really changed in four weeks; much of the situation is the same. NASDAQ and the Russell 2000 have poked above their May highs, but the DJIA and the S&P 500 have lagged and are negative for the month and DJIA is flirting with going negative for the year again.
We issued our
NASDAQ MACD Seasonal Sell Signal on June 4 to subscribers and although the NAS moved slightly higher after, we logged a 12.5% gain in
PowerShares QQQ (QQQ) on paper in the ETF Portfolio since last September/October when we took the position at an average price of about 97.39. Of course your mileage may vary, but at least one subscriber is putting these signals to good work.
Rick from Arizona, called in to renew and when asked how he like the service he said, “I gladly subscribe to the Stock Trader’s Almanac because it has made me a very successful trader. In October of 2014 the email newsletter gave me a signal to buy the QQQ index at about 98. Then I patiently waited for the signal to sell which came in early June of 2015. The sell price of about 108 gave me an 11 per cent return or $170,000 profit in just eight months!”
This leads right into the July, the best month of the third quarter, but most of July’s strength is front-loaded in the first half of the month. Caution is still in order, though a tradeable rally may be in the making from the end of June into the first half of July. After that we will be looking for softer market action from late-July into September and early October. Economic readings continue to be less than sanguine with GDP negative for Q1. Next week we will be looking for some individual stocks to short from weak sectors with poor numbers and ugly charts.
Pulse of the Market
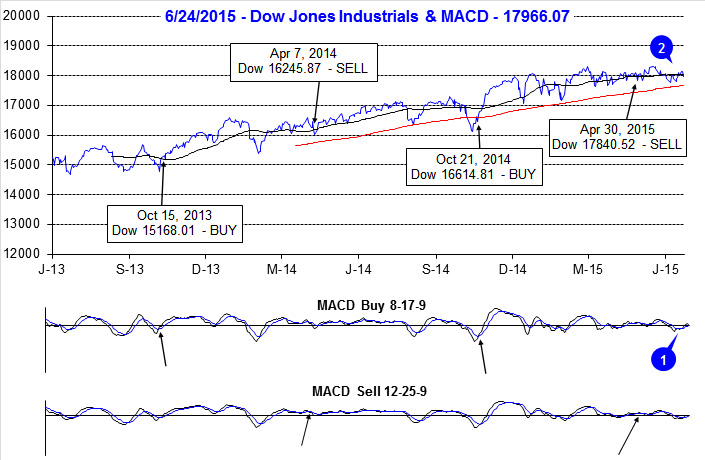
Over the past four weeks, DJIA has literally gone nowhere (2). DJIA did slip below its 50-day moving average early in June, but by just a few hundred points. DJIA has bounced back, but again it failed to exceed its 50-day moving average by not much more than 100 points. Both the faster and slower moving MACD indicators applied to DJIA (1) turned positive mid-week, last week, but waning momentum have them drifting toward sell once again. It would appear the summer doldrums are here with the market merely meandering along in an ever narrowing range.

On the heels of this year’s third Down Friday/Down Monday (DF/DM) warning, DJIA suffered two more DF/DM’s, back-to-back, to kick off the start of June (3). The last such occurrence of three DF/DM’s in four weeks was in January 2014. Back then DJIA spent the next twelve weeks getting back to where it was just prior to the cluster of DF/DM’s. Should DJIA follow a similar path this time, it would only be trading around 18,300 in mid-September. Considering the past few weeks, this is not that far-fetched of a possibility.
S&P 500 and NASDAQ have fallen into a similar pattern as DJIA. Despite being up in five of the last seven weeks, S&P 500 (4) is essentially unchanged since the start of May. NASDAQ’s recent weekly record (5) is weaker, but it’s up week gains have exceeded down week losses resulting in a few percentage points of gains since the start of May. However, as of trading today, NASDAQ is on course for its fourth minor weekly loss in the last five weeks.
Signs of a divergent and confused overall market continue to be present in the number of NYSE Weekly Advancers and Decliners (6). Flat to negative weeks are accompanied by more decliners than advancers, but in positive weeks, like last week, advancers just barely outnumber decliners. This is possible a sign that fewer and fewer stocks are actually participating in rallies by the major indices. Further compounding the confusion, New 52-Week Lows have outnumbered New Highs for three straight weeks even as New Highs climbed higher. A healthy market advance would have major indices moving higher, together, more Weekly Advancers than Decliners and a more robust number of New Highs.