Our cautious stance over the past several months remains the prudent course of action, or inaction as it were. The broad market has gone virtually nowhere for the past four months and now as the worst two months of the year (August and September) are upon us, market and economic readings are worrisome. Our Best Months Seasonal MACD Sell Signals on April 30 for DJIA and S&P 500, and June 4 for NASDAQ continue to look rather timely.
The major averages are still lagging the historical pre-election patterns and the
DJIA is negative for the year. We have been concerned that this year’s performance is more emblematic of the lower returns associated with the later years of a second-term “lame duck” president rather than the banner third year, or first pre-election year, performance.
Market sentiment has deteriorated with bullish advisors shifting mostly to the correction camp, while bears remain low. Put buying has also picked up over the past month, driving the CBOE Equity Put/Call Ratio to the 0.70 vicinity. Look for more bears than bulls or a near even number of each and more put buying at the end of the next correction. The 5 Down Friday/Down Mondays since the May 19 DJIA high, further highlight the market’s jitters.
While Q1 GDP was revised higher to a fractionally positive number today, Q2 preliminary data was below expectations and Q2 corporate earnings declined verses Q2 last year. Internally, the market is also cracking. Market breadth is rather weak. Declining shares have outnumbered advancing shares and there many more new 52-week lows than new highs. It is becoming increasingly apparent that this bull market is being driven by fewer and fewer participants.
Additional technical concerns can be seen in our latest interpretation of the
Three Peaks and a Domed House Top Pattern we have been tracking. If it plays out, my “count” suggests further downside potential exists. While we are about halfway to the long averted 10% correction we are not expecting a bear market to ensue at this juncture. However, there is no rush to jump back into the equity long side at this time.
The first nine days of August are notoriously weak as are the last few days of the month as summer breaks wind to a close. Mid-month is stronger. After some choppy trading over the next few months and a strong potential for the first 10% correction in the S&P 500 in 4 years, we expect the market to rally to slightly higher highs by yearend and perhaps into Q1 2016 after which we become more concerned for greater downside market action.
Pulse of the Market
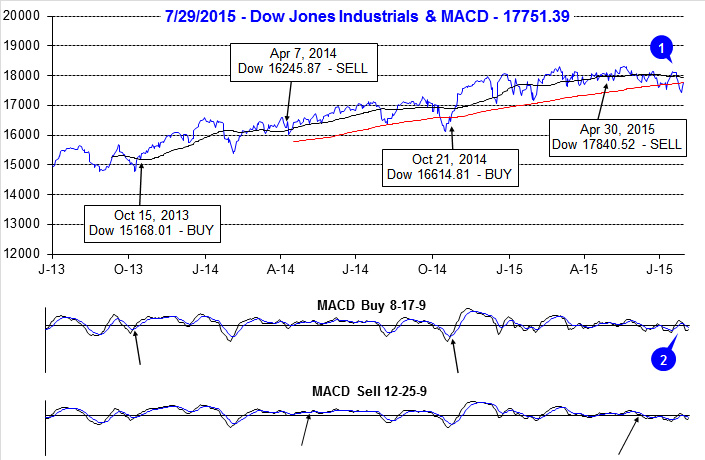
DJIA’s most recent all-time closing high was made on May 19, at 18312.39. Since then it has made a series of lower lows and lower highs (1) and has spent an increasing amount of time below its 50-day moving average. During DJIA’s most recent rout, it closed repeatedly below its 200-day moving average and the ensuing rally (Tuesday and Wednesday this week) stalled at the 200-day moving average. DJIA’s 50-day moving average is now declining and after briefly turning positive, DJIA’s MACD indicator (2) is once again negative. With the worst two months of the year, August and September, just around the corner, DJIA’s short-term technical and seasonal outlook is negative.
Since DJIA’s May high-close 10 weeks ago, it has registered five Down Friday/Down Monday (DF/DM) warnings (3). Traders and investors reluctant to hold positions over the weekend then failing to buy on Monday is a sign confidence has waned. When confidence begins to disappear, market declines frequently follow. Of 163 DF/DM’s since 1999, DJIA was lower 96.9% of the time sometime during the next 90 calendar days after the DF/DM.
S&P 500 has been down six of the past nine weeks (4) however, down week losses have been mild while up weeks have been stronger. This has helped S&P 500 remain essentially unchanged since the end of May. NASDAQ (5) has been down seven of the last nine weeks, but enjoyed a healthy 4.3% leap higher during mid-July that pushed it to a new all-time high. That was NASDAQ’s best weekly gain in 2015 and its best week since October 24, 2014.
Signs of a divergent and confused overall market continue to be present in the number of NYSE Weekly Advancers and Decliners (6). Flat to negative weeks are accompanied by more decliners than advancers, but in positive weeks, like July 17, advancers just barely outnumber decliners. This is a sign that fewer and fewer stocks are actually contributing to rallies by the major indices. Further compounding the confusion, New 52-Week Lows (7) have outnumbered New Highs in seven of the last eight weeks. New Highs also remain meager. A healthy market advance would have major indices moving higher, together, with notably more Weekly Advancers than Decliners, a more robust number of New Highs and the number of New Lows would be falling.
Weekly CBOE Put/Call Ratio reached its highest level (8) since May/June of 2012 at the start of July. This modest spike higher preceded S&P 500 and NASDAQ early July bottom. Last week’s declines lifted this ratio back to 0.69 which is above neutral, but not high enough to signal or confirm a bottom.
Further confirmation of broad market jitters can be seen in Treasury bond yields and Moody’s AAA rate (9). Both have moved slightly lower in recent weeks even as chatter of a September Fed rate hike has picked up.
Click for larger graphic…