In some respects this December has felt more like an October than a typical December. Market volatility, measured by the CBOE Volatility index (VIX), spiked as high as 26.81 on December 14 and has been above 20 for three straight days after the second (S&P 500) or third (DJIA and NASDAQ) worst weekly loss of the year. The Russell 2000 small-cap index had its worst week of 2015 last week, off 5.1%.
We suspect much of this year’s first-half-December weakness was the result of heavier than usual tax-loss-selling pressure and Fed rate jitters. Energy stocks and crude oil had another tough year and were amongst last week’s biggest losers. High-yield bonds, many of which are linked to energy, also had a challenging year and found themselves being aggressively sold last week as well. The pace and magnitude of early-December’s declines would seem out of the ordinary at first glance. However, based upon the next four charts, this December is still well within the range of what the last 21 Decembers experienced.
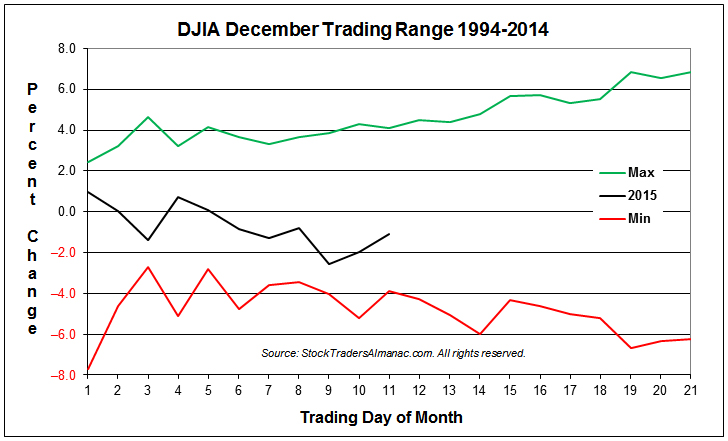
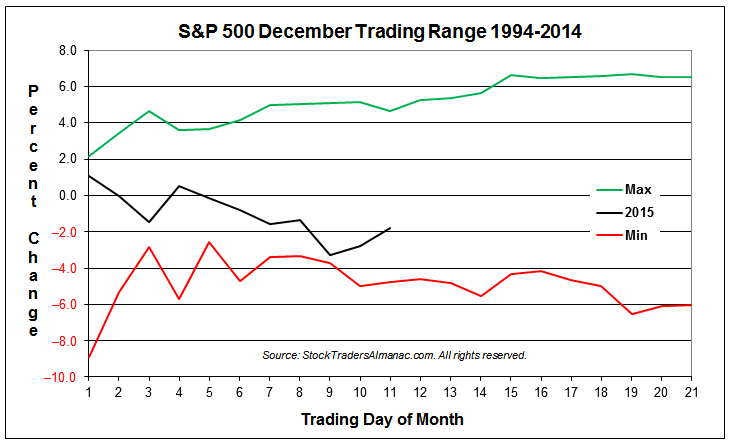
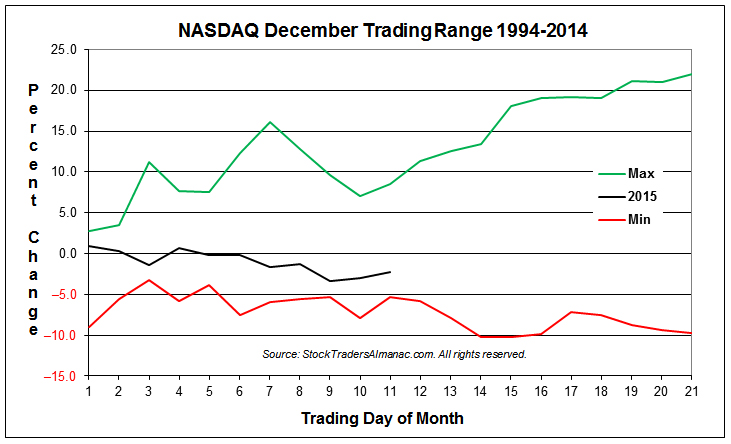
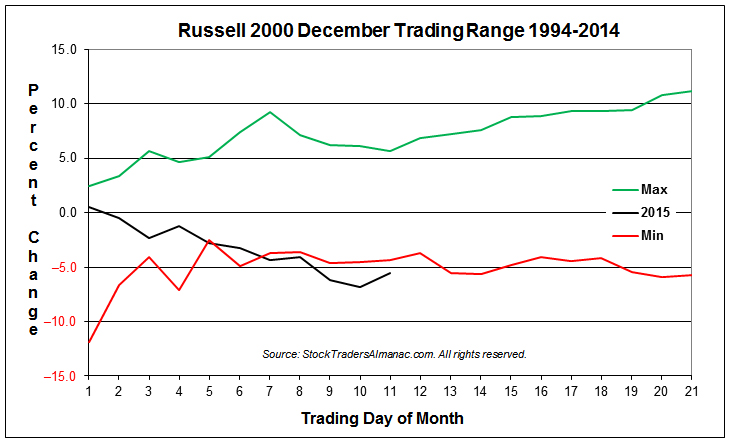
These charts represent a somewhat different take on seasonality, but still apply the basic approach as many of our other seasonality charts. Instead of plotting the average percent change, one trading day at a time for the time period, we are plotting the minimum and the maximum for each trading day during the time period. The Day 21 Min value represents the worst December since 1994 and the Max value represents the best December finish. NASDAQ’s 21.98% gain in December 1999 pushes its min-max range to the largest spread amongst the four indices.
Of the four major indices plotted above, only Russell 2000 has exceeded the low-end of its 21-year December trading range. DJIA, S&P 500 and NASDAQ are trending in the lower half of the range, but remain comfortably above it thus far. The arrival of mid-month, today, accompanied by gains yesterday and today suggests the worst of tax-loss selling is likely over and the typical second-half December rally is likely underway.
Santa Delivers Cheap Small Caps
Typical first-half-of-December weakness was a bit magnified this year. The lackluster performance of the stock market this year, Fed-rate-hike handicapping, new lows in crude, and a mini-run on junk bonds all conspired to exacerbate yearend tax-loss selling. But this appears to be setting the market up for a quintessential yearend “Santa Claus Rally” and some outperformance from the lagging small cap sector.
Perhaps one our favorite market tacticians put it best today on CNBC. Raymond James chief investment strategist Jeffrey Saut said that “
the market has the potential for a rip your face off-type rally…. It’s human nature to read into negativity, what happened last Friday, but it really doesn’t deconstruct the bullish case right here. You’ve got massively oversold conditions in the equity markets. You’ve got a December option expiration in the trillion plus dollars that everybody is worried about – it typically has a bullish tilt to it…. The setup is pretty good for a rally to the upside that's going to surprise a lot of people. I think you could make new highs by the end of the year – new all-time highs.”
As you can see in the chart below of the Russell 2000 Small Cap Index One-Year Seasonal Pattern, this year the R2K has stayed rather close in trend and shape with the historical pattern, but well below in level. The pink arrow point to last Friday’s low, which lines up directly with the usual mid-December low. It is at this point when the market tends to rally into yearend and small caps outperform large caps. This has been referred to as the January Effect for years, but in recent history we have discovered that this so-called January Effect starts in mid-December (STA 2016 pages 106 & 110).
![[Russell 2000 Small Cap 1-Year Patter V 2015]](/UploadedImage/AIN_0116_20151215_R2K2015vHistory.jpg)
Then comes the Santa Claus Rally. This cute little seasonal phenomenon has been erroneously ballyhooed for months and we have discussed enough ourselves that we almost can’t bear to mention it again, but it is important. Number one, if it does not transpire it is not a great sign for 2016. Yale Hirsch defined the SCR in 1972 as a seven-trading-day period that spans the last 5 trading days of the year and the first two of the New Year.
The S&P has averaged 1.4% over the period. But, the real significance is when it does not appear. As we remind in the headline on page 114 of the 2016 Almanac, “If Santa Claus should fail to call, bears may come to Broad and Wall.” In the table below you can see that the last four times SCR was negative the year was either flat or suffered a bear market. The S&P was down -3.0% this year and 2015 is on pace for a flat year.
The other reason the Santa Claus Rally is so important is that it helps drive up beaten down bargain stocks. Along with the Small Cap Effect the starts in mid-December, the Santa Claus Rally contributes to our Only “Free Lunch” On Wall Street Strategy.
Lunch is Almost Ready
Investors tend to get rid of their losers near year-end for tax purposes, often hammering these stocks down to bargain levels. And this year is a pretty good example. Over the years the Stock Trader’s Almanac has shown that NYSE stocks selling at their lows on December 15 will usually outperform the market by February 15 in the following year. When there are a huge number of new lows, stocks down the most are selected, even though there are usually good reasons why some stocks have been battered.
Our “Free Lunch” strategy is only a short-term strategy reserved for nimble traders. It has performed better after market corrections as we have had recently in 2015 and when there are more new lows to choose from. The object is to buy bargain stocks near their 52-week lows and sell any quick, generous gains, as these issues can often be real dogs.
This strategy has been profitable in 15 of the last 16 years with an average basket gain of 14.8%. Like nearly every asset class at the time, the “Free Lunch” trade was down 3.2% in 2007-2008, but still it still outperformed the NYSE over the same period. As you can see in the table below, though last year’s basket was underwhelming it still outpaced the NYSE Composite.
This year’s “Free Lunch” stock basket will be emailed to Almanac Investor Subscribers before the market opens on December 21, but you will likely receive it over the weekend. We will glean through the lists of stocks making new 52-week lows, sifting out all non-common shares, splits, new issues and other illiquid and questionable securities and email it out as soon as we are satisfied. Subscribers will receive specific buy limits and stop losses for each stock included and the trades will be tracked in the Almanac Investor Stock Portfolios.