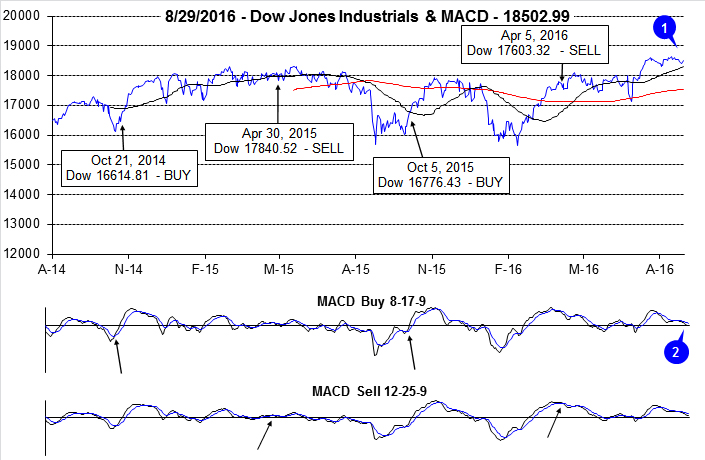
Since the post-Brexit rally and the break to new all-time highs the market has been on summer vacation. The blue chips have been off the grid, virtually flat since mid-July. Techs and small caps have been a bit stronger, but less so since mid-August. Only the small caps have been able to gain any ground the past two weeks.
This lack of momentum has been accompanied by even greater bullish sentiment with
Investors Intelligence Bullish Advisors % moving up to 56.7%, its highest level since mid-2015 – and it’s been over 50% for seven weeks now. CBOE Weekly Equity Only Put/Call ratio has been equally as complacent over the past two months in the 0.56-0.67 range.
The recent lack of momentum, added to all this frothy sentiment increases the risk of a pullback or correction in the near term. Mixed fundamental readings are not much help, but there seems to be enough good economic and corporate data to support the market and avoid a major pullback at this time, save some political, geopolitical or systemic market event that derails the bull.
While Hillary Clinton appears to have a solid lead, Trump has recently been trimming the large gap Clinton enjoyed a few weeks ago. It remains to be seen what impact the emergence of the Johnson-Weld Independent ticket will have and who they will steal votes from. The market has bullishly been tracking the
Incumbent Party Win trend since midyear. Trumps new surge and the rise of Johnson-Weld may be chipping away at the bullish trend.
Elevated bullish sentiment, lack of momentum, weak technicals and mixed fundamentals are setting up for some sort of September/October correction. This is typically a trouble spot for the market, especially the week after September Triple Witching, the end of Q3 and the beginning of October. How deep that correction is may depend on how strong or weak the Clinton campaign is. In the chart below you can see how much deeper and longer the average pullback is in September/October during election years when the incumbent party loses.
So be ready for a pullback after the usual bullish first half of September and for deeper declines should Clinton slip further in the polls. Either way, that pullback should make a nice entry point for the yearend rally.
Pulse of the Market
After breaking out to new all-time highs in July, DJIA has stalled and slipped into a narrow trading range (1) between about 18,200 and 18,700. Both the faster and slower MACD indicators applied to DJIA have been negative since the end of July (2), confirming the loss of upward momentum. Bullishly, DJIA has remained above its 50- and 200-day averages since recovering from Brexit aftermath in late June. But the rapidly rising 50-day average is currently only about 150 points below DJIA today.

Further confirmation of the market fizzling out can be seen in weekly performance over the past nine weeks. After four straight weeks of gains in July DJIA has seesawed back and forth between weekly gains and losses and has been modestly lower in three of the last five weeks (3). Two of the three weekly declines were accompanied by losses on Friday and the following Monday (4). Down Friday/Down Mondays have a track record of signaling and/or confirming a lack of confidence that frequently leads to further declines. S&P 500 (5) has the same weekly track record as DJIA over the last nine weeks.
After lagging for most of the year, NASDAQ put together an eight-week-winning streak (6) that has nearly brought its year-to-date performance in line with DJIA and S&P 500. During this weekly streak NASDAQ climbed 11.3% however; the vast majority of the gain occurred in the first few weeks and tapered off to only 0.1% in the final week of the streak.
NYSE Weekly Advancers and Decliners (7) over the last nine weeks have been trending in a direction that confirms the market’s waning momentum. Weekly Advancers have been slowly declining in number while Decliners are rising. NYSE Weekly New Highs peaked and Lows bottomed out (8) during the week ending July 15. This is further confirmation that the rally has fizzled.
Back-to-back Weekly CBOE Put/Call ratio readings under 0.60 (9) could also be a sign that the market has topped out in the near-term. Although 0.60 was once considered a neutral level, the recent trend has been any reading below this level, such as the 0.56 during the week ending July 15, has signaled an end to the majority of the market’s move higher.
Click for larger graphic…