Ahead of the first presidential debate Monday night we made a fun little intra-office bet that the loser buys the winner a nice lunch. The bet was whether or not Trump would break down or blow up or lose it completely at some point during the debate. Jeff won the lunch as Chris conceded that Mr. Trump did not completely break down. Some political pundits even admitted that there were surprised Trump held up as well and as long as he did.
Mrs. Clinton is veteran debater and policy wonk, who clearly prepared well for the debate. On pure debating points, tone and manner, she was much more polished. However, for a rookie, Trump arguable held his own and did not blow up, though he missed plenty of opportunities to drive home Mrs. Clinton’s legacy of negative issues and present more solid policy points. Clinton also came up a bit short on really hammering her less experienced opponent and solidifying her position. Polls remain extremely narrow.
While Trump did not blow up, Chris’ expectation that whatever the outcome of the debate, the media would spend a massive amount of time on how bad Trump was and the market would rally after the debate did prove accurate. In any event for a first effort Trump managed to stay in the race and hold his ground. Perhaps he’ll step it up in the next two and give Clinton more of a run for her money.
More importantly, from our vantage point is that the market today is threatening to return to the downside after two days of bliss following the debate. The
Down Friday/Down Monday warning this week is looming large again. Spooked by a host of market events, the often treacherous end of Q3 portfolio adjusting by fund managers and some Octoberphobia, stocks are in retreat mode today.
News from Apple, Deutsche Bank, Wells Fargo and OPEC has the market in sell mode at this writing. U.S. equity indices have rallied off the mid-afternoon lows (which is historically the weakest part of the day), but it’s still rather red across the board. How we close out today should be instructive, as will tomorrow’s action on the
last trading day of Q3.
The 50-day moving average has been resistance for DJIA and S&P and serving as support for NASDAQ and Russell 2000. If S&P 500 cannot reclaim its 50 DMA and instead breaks down through its monthly pivot point around 2150, the early September lows near 2120 come into play. Then there is some support near 2100 around June’s highs. If that level does not hold then further support can be found just below the 200-day moving average near 2050.
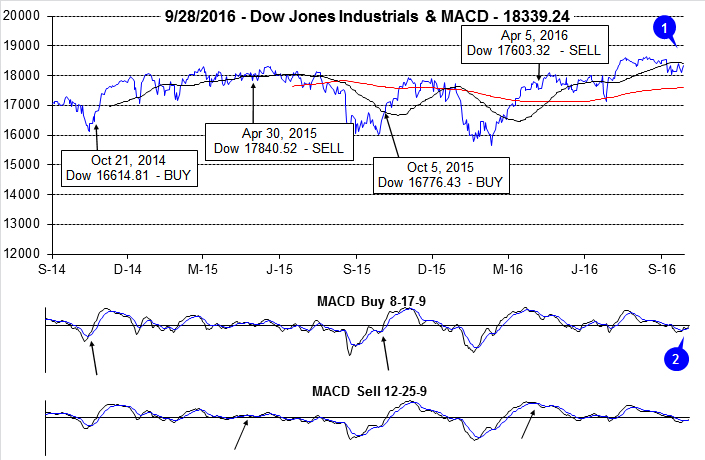
However, this will be a solid set up for a quintessential October Buy. October is the best month to buys stocks, especially small caps and tech stocks. It’s even better after a pullback/correction. This current downside action is close to putting or MACD indicators into sell mode and setting up a solid “Best Six Months” Seasonal MACD Buy signal sometime on or after October 3. We will keep you posted. In the meantime, stay cautious and be patient.
Pulse of the Market
In early September DJIA abruptly plunged below its 50-day moving average after spending the previous two months solidly above (1). In the time since, DJIA has remained above its 200-day moving average, but has repeatedly failed to reclaim its 50-day average. DJIA’s 50-day average, currently right around 18400, is proving to be firm overhead resistance. As of yesterday’s close, both the slower and faster MACD indicators applied to DJIA were positive (2), but just slightly. A few days of weakness or a single day decline of about 270 points would result in a sell signal from the slower moving MACD indicator.
DJIA’s last closing new all-time high was 18636.05 on August 15, 2016. Including the Friday before this high was reached; DJIA has declined on six of the last seven Fridays (3). Weakness on Friday suggests traders and investors are reluctant to hold positions over the weekend which is a sign of concern and waning confidence. Further troublesome, three of these down Fridays were followed by down Mondays with back-to-back occurrences happening this past Monday (4). Historically, DJIA Down Friday/Down Monday incidences have preceded weakness sometime within the next 90 calendar days.
Despite all this Friday weakness DJIA, S&P 500 (5) and NASDAQ (6) have managed to eke out gains during three of the last four weeks. However, two-percent-plus across the board losses during the week ending September 9, DJIA and S&P 500 were lower last Friday than four weeks prior.
NYSE Weekly Advancers and Decliners (7) have been behaving as would be expected with one notable exception, the week ending September 16. In that week, DJIA and S&P 500 managed modest gains while NASDAQ leapt 2.3%, but NYSE Weekly Decliners outnumbered Weekly Advancers by a margin or nearly two to one. This ratio is more commonly associated with weekly losses. It also suggests the major indices moved higher on the backs of a fewer number of stocks. Meaningful advances typically require broader participation.
NYSE Weekly New Highs also plunged during the week ending September 16, from 456 to just 99. New Lows (8) climbed to 69. These unusual numbers may have been due to quarterly options expiration, but are still a concern.
Weekly CBOE Put/Call ratio at 0.60 (9) last week is suggestive of a near-term top. Recent past readings in the range of 0.56 to 0.60 were followed by mild weekly market weakness.