Well, patience with our Best Six Months Seasonal MACD Sell Signal has sure proved to be a virtue thus far. Both MACD indicators for both the S&P 500 and DJIA went negative in early March and did not all turn positive until the past Monday’s big gains. Now we are getting some bullish confirmation from market breadth. The cumulative Advance/Declines in several major market indices are trending higher and on the brink of more new highs.
In the chart below you can see that the NYSE Composite A/D Line – the broadest of the bunch and most widely tracked – is already at a new high. In the top pane we show the four major averages: Russell 2000, NASDAQ Composite, S&P 500 and DJIA. In the lower panes are the A/D Lines for S&P, R2K, NASDAQ and NYSE. DJIA only has 30 stocks so the A/D is rather choppy and less instructive.
When A/D Lines move inversely to their related index or average that is usually an indication that the benchmark is about to change course as the bulk of its constituents are moving in a different direction. However, despite all the worrisome talk out there and the Sell in May sabre rattle, underlying strength is improving though there still is some work to be done.
Since the current rally began just before the election back in early November, market breadth has been supportive. Even during the March to mid-April pullback and consolidation the A/D Line followed along. Now the other A/D Lines are trending higher and about to confirm the new highs on NASDAQ and R2K with new highs of their own. We will be looking for market breadth to move higher and confirm our expectation for another move higher before we Sell In May… or later.
May’s across the board major improvement in post-election years is another bullish factor. We also do not expect anything too sinister at this point during the Summer/Fall correction this year. Pundits, politicians and pedestrians on both sides of the aisle and pond continue to banter about how the Trump rally is doomed. But we are not convinced just yet.
President Trump continues to compromise, negotiate, wheel and deal. Yes he's said some inflammatory things and made some diplomatic and military maneuvers and used any manner of political tactics, but Congress is still gridlocked and Trump has the world on their heels, hands up in the air and confused as to what his next move will be. He is looking more and more presidential and his team is evolving. Perhaps all this bluster is keeping the wolves at bay. The market sure is acting happy.
Trump still has loads of work to do. His tax plan received a big yawn as it lacked detail. The move to repeal Obamacare is weakly back on table. A government shutdown is not likely to happen; Trump will make a deal and compromise. His tough talk has the world a bit baffled and while Dems and Reps are still yapping away in DC and not doing much the market rally rolls on.
Fear not though. We are prepared. When the MACD Sell Signal triggers we will move quickly to tighten up and lighten up and put the prevent Defense on the field. As our friend and market sage Art Cashin says every day in his daily missive, “Stick with the drill – stay wary, alert and very, very nimble.” Our system, tactics and 5-discipline-approach continues to produce. We will sell losers and underperformers in May on MACD trigger, but hold winners, protect profits and prep some downside protection and bearish seasonal trades.
Pulse of the Market
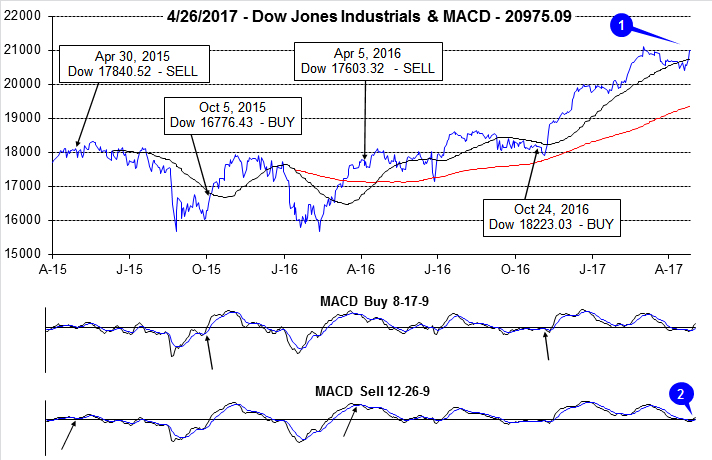
Up until this week, April had been failing to live up to its reputation as DJIA’s historically top-performing month. DJIA briefly lost its battle with its 50-day moving average (1) around mid-month. But, DJIA did find support right around its projected monthly pivot support level at 20327. This Tuesday, DJIA decisively reclaimed its 50-day moving average and the surge higher was sufficient to turn both the faster moving and slower moving MACD indicators positive (2) for the first time since early March.
During the second half of March and the first trading day of April, DJIA recorded three consecutive Down Friday/Down Monday occurrences (4). The last time DJIA did this was in February 2009 just before the worst bear market since the Great Depression ended on March 9. A cluster like this demonstrates a major lack of confidence in the market and bearish overall sentiment as traders and investors are reluctant to carry positions over the weekend and fail to buy again on Monday. DJIA has fallen on Friday (or the last trading day of the week) for six straight weeks. For the last three weeks, buying near the close on Friday would have been the better long trade.
Prior to this week, DJIA (3), S&P 500 (5) and NASDAQ (6) logged losses in four of the last seven weeks. Relatively mild weekly losses combined with a few modest weekly gains have kept all three indices within a few percentage points of recent all-time highs. In typical seasonal fashion, technology shares have been leading the way higher with NASDAQ closing at a new all-time high first on April 20. Since then, NASDAQ has continued to build on strength and now trades above 6000 and new all-time highs.
March’s see-saw battle between NYSE Weekly Advancers and Decliners (7) has persisted through the bulk of April. A lone exception transpired during the week ending April 7 when DJIA, S&P 500 and NASDAQ all declined, but NYSE Weekly Advancers still outnumbered NYSE Weekly Decliners. A consistently larger number of Weekly Advancers would aid in supporting another move higher.
Despite all the recent weakness, NYSE Weekly New Highs (8) have held up and have not slipped below 200 since early March. This is bullish as it indicates underlying strength and resiliency that is not easily measured. Ideally, we would like to see New Weekly Highs continually expanding. This could serve as one confirming data point that the rally still has room left yet to run.
After two Fed Funds rate increases (December and March), the yield on the 30-year Treasury bond (9) is back under 3% and at its lowest since right after Election Day 2016. The spread between 90-day rate and 30-year rate has narrowed all the way back to what it was last October. Part of the decline in yields could be attributed to a “flight to safety” during recent weakness in advance of the “Worst Six Months” and another reason for the decline is still tepid growth and inflation expectations. A flattening yield curve also explains some of the weakness in some bank stocks recently.