Our 5-Disciplines market timing analysis approach, detailed in the
Market at a Glance every month, is now indicating that the seasonal topping process is underway. Whether or not this next pullback or correction manifests into something more ominous like a bear market is too early to tell. But we are already in defensive mode with our
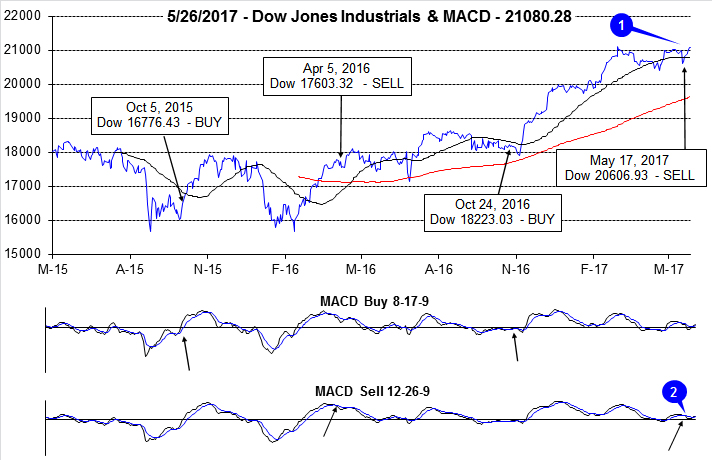
Best Six Months Seasonal MACD Sell Signal triggering on May 17.
As we enter the month of June we are prepared to take additional risk off and deploy additional defensive action as NASDAQ’s Best Eight comes to end. When NASDAQ’s Best Eight Months Seasonal MACD Sell Signal triggers it will be our cue to protect our portfolios further, selling more underperformers, implementing more downside protection and scouting for shorting opportunities in the Worst Four Months of the Year July-October.
The bulk of the seasonal summer/fall selloffs often come in August and September, the worst two months of the year, but we like being ready and positioned well beforehand. Plus June is no prize in post-election years (see below). Rhetoric on the geopolitical front is getting rather contentious and the prospects for any fast-track stimulative legislation coming out of Washington DC in the near term grow thin. The portfolio protection and house cleaning we have already been implementing and the rest we are poised for seems prudent at this juncture.
Now we also have the potential for the
Three Peaks and a Domed House Top Pattern (3PDH) we noted was in play again on April 18, to collide with the perennial summer doldrums and associated correction. We have updated the 3PDH here in the chart below. We have added a few question marks to the current points 15, 20, 21 and 23 and the pattern is still evolving. If this 3PDH pattern does continue to develop and complete, points 1 through 14 look pretty set.
As you can see the beginning of the current 3PDH patter at point 1 (not labeled) corresponds to the points 10-14 of the previous 3PDH’s separating decline. The May 21, 2015 S&P 500 top is point 23 of the last one and point 5 (the middle peak) of the current pattern. And the ultimate bear market low in February 2016 is both point 28 of the last pattern and point 14 of the current 3PDH.
So, needless to say with all the diplomatic and political machinations brewing, the 5 Disciplines at DEFCON 4, tepid internals as described in the Pulse below and the ominous portent from the Three Peaks, we believe the time has come to be ready to move into risk off/defensive mode.
Pulse of the Market
After the close on May 17, we issued our Seasonal MACD Sell signal for DJIA and S&P 500 (1). Prior to that day, DJIA and S&P 500 had been slowly creeping higher keeping the sell signal at bay (2). The negative political news of that day was quickly shrugged off and DJIA has rebounded and reclaimed its 50-day moving average. S&P 500 and NASDAQ have since crept to new all-time highs, but DJIA is lagging and has thus far failed to best its March 1 closing high of 21,115.55.
As of last Friday’s close, DJIA was 0.67% higher for May following its best weekly performance of the month (3). After declining in four of six weeks from early March to mid-April, DJIA has been up four of the last six weeks. With the exception of the Down Friday/Down Monday (4) that occurred at the start of May, DJIA’s performance on Fridays has improved somewhat. Following seven straight Friday (or last trading day of the week) declines, DJIA has logged two positive Fridays in the last four. Mondays have been the most consistent source of gains for DJIA, up six of the last seven excluding today.
S&P 500 has advanced in four of the last six weeks (5) and NASDAQ has been up in five of the last six (6). S&P 500 and NASDAQ both finished last week at new all-time closing highs, but absent support from other major indices, their strength is likely to fade as typical summer slowdown in trading volume begins to take hold.
NYSE Weekly Advancers and Decliners (7) paint a tepid overall picture. Weekly Advancers have outnumbered Weekly Decliners during four of the past six weeks, but not by the healthy margin that would confirm or signal the market has successfully broken out and is in the midst of a new wave higher. More Weekly Advancers are needed. Even last week’s move had fewer than 2000. Broader participation appears to be lacking.
NYSE Weekly New Highs (8) have also been choppy at best having peaked at the end of April at 544. Last week’s reading interrupted a four-week down trend in New Highs and could prove to be fleeting. New Weekly Lows remain subdued, but are greater now. This is another sign that participation is fading and the rebound rally could be fizzling.
Because of the long holiday weekend, last week’s interest rate data is not yet available. The 90-Day Treasury rate reaching 0.90 two weeks ago is the highest reading since October 24, 2008 and is nearly double its level from early January (9). The 30-year Treasury bond yield remains right around 3%. This flattening of the yield curve is not going to help banks nor does it indicate any real inflation concerns over the longer-term.