We are currently experiencing a typically strong post-election July. With VIX low, sentiment high and stocks up, the time is nigh for the August-September slide. In addition we now have a Dow Theory Signal as the Dow Transports have just fallen rather sharply, down 5.7% in the past two weeks including a 3.1% drop today. All this weakness in the Transports has occurred while the Dow Industrials continues to log multiple new highs this month.
This lack of confirmation or synergy between the two oldest U.S. market benchmarks just triggered a Dow Theory Sell Signal. When the backbone of our economy that transports goods across the nation does not perform well it is an indication that there is underlying economic woe. It is not always right and like everything else it is subject to interpretation, but it does have a solid track record and is worth heeding here as our other indicators are pointing to a summer selloff around the corner.
They say “one man’s loss is another man’s gain,” and this DJT downturn is a boon for our seasonal short trade in iShares DJ Transports (IYT), trimming our 10% loss in the position by two thirds to 3.5%. In the face of all this overvaluation, frothy sentiment and the upcoming seasonal weakness we usually get in August and September, we are pleased to already be in a rather defensive risk off position.
Sentiment as measured by the trusty
Investors Intelligence Bullish and Bearish Advisors % continues to move evermore bullish to over 60% bulls and down to under 17% bears with an expanding spread between bulls and bears to near-peak levels of 43.7%. These are the levels associated with market corrections. At the same time volatility remains super low, but ticking up from historic lows under 9 intraday. If volatility begins to pick up and sentiment retreats look for the market to turn lower.
Concurrently, 2017 continues to track the 1-year seasonal pattern of Positive January Indicator Trifecta (Years when our 3 January indicators, January Barometer, First Five Days and Santa Claus Rally are all up) and Post-Election Years. As you can see in the updated chart below this suggests further upside this year, but not before a pause or more serious pullback during the August through October timeframe.
The beginning of August is notoriously weak as investors, traders and money managers take off en masse on vacations. This is followed by a
mid-month surge then a weak close, September trouble and the feared syndrome called Octoberphobia. So keep your powder dry, sit tight and take some risk off before the summer market swoon.
Pulse of the Market
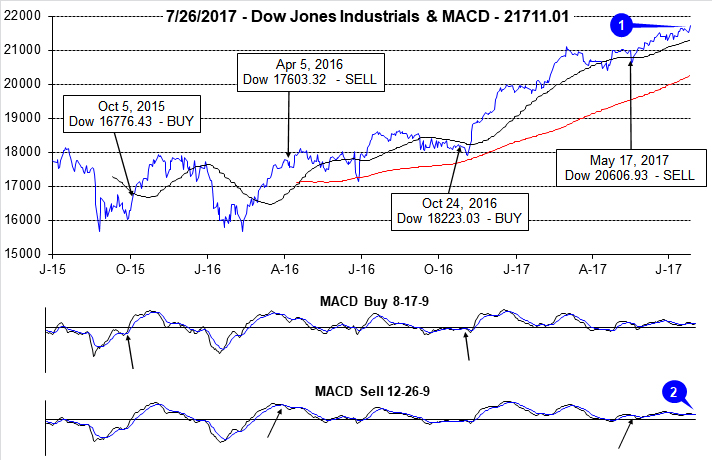
This July has lived up to its reputation as a solid performer in post-election years. DJIA, S&P 500, NASDAQ and Russell 2000 have all logged new all-time highs this month. DJIA (1) is closing in on 22,000, S&P 500 was climbing towards 2500 and NASDAQ was over 6400 until today. DJIA was lagging earlier in the month and is catching up now. The shift in DJIA’s momentum is being confirmed by both its faster and slower MACD indicators turning positive (2) yesterday, but this is a tepid confirmation occurring above the zero line.
DJIA (3) and S&P 500 (5) have both recorded weekly gains in seven of the last nine weeks and are on course for an eighth gain this week. During this streak of weekly strength, traders and investors have not shied away from buying on Fridays. DJIA has been up six of the last nine Fridays (4). But, there is been little follow through on subsequent Mondays with DJIA down modestly six of the last nine. This week’s DJIA Down Friday/Down Monday is the first in seven weeks and has been ignored thus far. Historically, sometime during the 90 calendar days after a Down Friday/Down Monday occurrence, DJIA has registered a meaningful decline.
After a tough finish to the second quarter, NASDAQ has come roaring back (6) with three straight weekly gains. Prior to today’s intraday reversal, NASDAQ was on track for a fourth consecutive weekly gain this week. NASDAQ’s Midyear Rally got off to a late start, but finished well with a 2.6% weekly gain.
NYSE Weekly Advancers and Decliners (7) continue to be a mixed bag. For the week ending June 30, DJIA, S&P 500 and NASDAQ were all down, but Weekly Advancers still outnumbered Weekly Decliners and then one week later the exact opposite occurred. However, Weekly Advancers and Decliners have been responding in a more typical manner the past two weeks. A return to mixed readings or an outright reversal in the positive trend could be a sign that weakness is just around the corner.
NYSE Weekly New Highs (8) appear to have turned a corner as well and have been increasing for the past two weeks. Weekly New Lows have also been declining which is also positive. If these trends persist, then the recent breakout rally has a good chance of continuing. But if they begin to revert back to mixed levels then the breakout will likely fail.
The spread between the 90-day Treasury Rate and the 30-Year Treasury Rate (9) continues to shrink as the Fed increases short-term rates and inflation and growth expectations over the long-term remain tepid. At some point, this flattening could become an issue for the Fed and the market.