May officially marks the beginning of the “Worst Six Months” for the DJIA and S&P. To wit: “Sell in May and go away.” Our “Best Six Months Switching Strategy,” created in 1986, proves that there is merit to this old trader’s tale. A hypothetical $10,000 investment in the DJIA compounded to $975,223 for November-April in 67 years compared to $116 loss for May-October. The same hypothetical $10,000 investment in the S&P 500 compounded to $705,504 for November-April in 67 years compared to a gain of just $8,615 for May-October.
May has been a tricky month over the years, a well-deserved reputation following the May 6, 2010 “flash crash”. It used to be part of what we called the “May/June disaster area.” From 1965 to 1984 the S&P 500 was down during May fifteen out of twenty times. Then from 1985 through 1997 May was the best month, gaining ground every single year (13 straight gains) on the S&P, up 3.3% on average with the DJIA falling once and two NASDAQ losses.
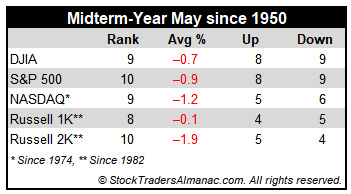
In the years since 1997, May’s performance has been erratic; DJIA up ten times in the past twenty years (three of the years had gains in excess of 4%). NASDAQ suffered five May losses in a row from 1998-2001, down – 11.9% in 2000, followed by eleven sizable gains in excess of 2.5% and four losses, the worst of which was 8.3% in 2010. Since 1950, midterm-year Mays rank poorly, #9 DJIA and NASDAQ, #10 S&P 500 and Russell 2000, #8 for Russell 1000. Losses range from 0.1% by Russell 1000 to 1.9% for Russell 2000.
Based upon the S&P 500, Monday before May option expiration is much stronger than expiration day itself albeit weaker for small caps. Big caps have registered seven losses in the last twenty-eight years on Monday. Expiration day is a loser nearly across the board; Russell 2000 posts a marginal average gain. The full week had a bullish bias that has faded in recent years. The week after options expiration week now favors tech and small caps. DJIA has fallen in eleven of the last nineteen weeks after.
On Friday before Mother’s Day the DJIA has gained ground fifteen of the last twenty-three years and on the Monday after (the first day of options expiration this year), the blue-chip average has risen in fifteen of those years.
The first two days of May trade higher frequently and the S&P 500 has been up 20 of the last 28 first trading days. A bout of weakness often appears on the third, fourth, eleventh, fourteenth, and twenty-second and sixteenth trading days for large cap stocks but the middle of the month tends to be better.
The Friday before Memorial Day tends to exhibit light, lackluster trading as folks escape early for the summer kickoff weekend with the Dow down 10 of the last 18 years, averaging a minor loss of 0.2%. On the Tuesday after Memorial Day the Dow has been up 21 of the last 32 with an average gain of 0.4%. During the shortened Memorial Day Week the Dow has been down 13 of the last 22, but was up 12 straight from 1984-1995.
| May (1950-2017) |
| |
DJI |
SP500 |
NASDAQ |
Russell
1K |
Russell 2K |
| Rank |
|
9 |
|
8 |
|
5 |
|
6 |
|
6 |
| #
Up |
|
36 |
|
40 |
|
29 |
|
27 |
|
25 |
| #
Down |
|
32 |
|
28 |
|
18 |
|
12 |
|
14 |
| Average
% |
|
-0.02 |
|
0.2 |
|
1.0 |
|
1.0 |
|
1.3 |
| 4-Year Presidential Election Cycle Performance
by % |
| Post-Election |
|
1.3 |
|
1.7 |
|
3.4 |
|
3.0 |
|
3.9 |
| Mid-Term |
|
-0.7 |
|
-0.9 |
|
-1.2 |
|
-0.1 |
|
-1.9 |
| Pre-Election |
|
0.1 |
|
0.2 |
|
1.9 |
|
1.2 |
|
2.7 |
| Election |
|
-0.7 |
|
-0.1 |
|
-0.3 |
|
-0.3 |
|
0.1 |
| Best & Worst May by % |
| Best |
1990 |
8.3 |
1990 |
9.2 |
1997 |
11.1 |
1990 |
8.9 |
1997 |
11.0 |
| Worst |
2010 |
-7.9 |
1962 |
-8.6 |
2000 |
-11.9 |
2010 |
-8.1 |
2010 |
-7.7 |
| May Weeks by % |
| Best |
5/29/70 |
5.8 |
5/2/97 |
6.2 |
5/17/02 |
8.8 |
5/2/97 |
6.4 |
5/14/10 |
6.3 |
| Worst |
5/25/62 |
-6.0 |
5/25/62 |
-6.8 |
5/7/2010 |
-8.0 |
5/7/10 |
-6.6 |
5/7/10 |
-8.9 |
| May Days by % |
| Best |
5/27/70 |
5.1 |
5/27/70 |
5.0 |
5/30/00 |
7.9 |
5/10/10 |
4.4 |
5/10/10 |
5.6 |
| Worst |
5/28/62 |
-5.7 |
5/28/62 |
-6.7 |
5/23/00 |
-5.9 |
50/20/10 |
-3.9 |
5/20/10 |
-5.1 |
| First Trading Day of Expiration Week: 1990-2017 |
| #Up-#Down |
|
21-7 |
|
21-7 |
|
18-10 |
|
20-8 |
|
16-12 |
| Streak |
|
U2 |
|
U2 |
|
U2 |
|
U2 |
|
U4 |
| Avg
% |
|
0.4 |
|
0.4 |
|
0.4 |
|
0.3 |
|
0.2 |
| Options Expiration Day: 1990-2017 |
| #Up-#Down |
|
14-14 |
|
15-13 |
|
14-14 |
|
15-13 |
|
13-15 |
| Streak |
|
U5 |
|
U5 |
|
U2 |
|
U5 |
|
U2 |
| Avg
% |
|
-0.1 |
|
-0.2 |
|
-0.1 |
|
-0.1 |
|
0.02 |
| Options Expiration Week: 1990-2017 |
| #Up-#Down |
|
15-13 |
|
15-13 |
|
16-12 |
|
14-14 |
|
16-12 |
| Streak |
|
D2 |
|
D1 |
|
D1 |
|
D1 |
|
D1 |
| Avg
% |
|
0.3 |
|
0.2 |
|
0.4 |
|
0.2 |
|
-0.1 |
| Week After Options Expiration: 1990-2017 |
| #Up-#Down |
|
16-12 |
|
18-10 |
|
19-9 |
|
18-10 |
|
22-6 |
| Streak |
|
U2 |
|
U4 |
|
U4 |
|
U4 |
|
U4 |
| Avg
% |
|
-0.05 |
|
0.2 |
|
0.4 |
|
0.3 |
|
0.5 |
| May 2018 Bullish Days: Data 1997-2017 |
| |
1,
2, 8, 10 |
1,
15, 25 |
1,
2, 8, 21 |
1,
15, 25 |
1, 2, 29, 30 |
| |
|
|
29,
30 |
|
|
| May 2018 Bearish Days: Data 1997-2017 |
| |
3,
4, 11, 18, 22 |
3,
4, 11, 14 |
3,
18 |
3,
4, 11, 14, 18 |
3, 11, 14 |
| |
|
18,
22 |
|
|
|