Contrary to popular opinion of the moment, seasonality is not dead. Yes, the bad months were not bad; in fact they have been quite good, so far. The S&P 500 is up 8.6% year-to-date (YTD) as of today’s close and the “Worst Six Months” (WSM) have gained 9.6% to date versus 2.8% for the “Best Six Months” (BSM) that ended on April 30, 2018.
But if you remember our
2018 Annual Forecast made last December we were anything but bearish. And then after our January Barometer reading came in firmly in the plus column, creating a
positive January Indicator Trifecta with the “Santa Claus Rally” and the “First Five Days” also up, we reaffirmed our bullish stance.
Then in March as the market recovered and the impact of the tax cuts and deregulation began to materialize we posted on our blog that the
worst of the midterm year may be behind us and that best is yet to come. We still employed our seasonal defensive stance as we moved into the WSM, and our positions in Healthcare, Utilities and Consumer Staples have been doing quite well.
Before we get into the constructive prospects for the Sweet Spot of the 4-Year Cycle, let’s remember that the WSM are not over yet and the turn of the third quarter has been known to be treacherous. There are still six weeks left in the WSM and we suffered a 10% drop in less than two weeks back in January/February.
Now for the good news. In the table below you can see the Sweet Spot of the 4-Year Cycle highlighted from Q4 in the midterm year to Q2 in the pre-election year. That’s what’s coming around the corner from October 2018 through June 2019. This three-quarter span has posted gains of 20.4%, 21.1% and 32.0% respectively for DJIA, S&P 500 and NASDAQ since 1949.
In addition, as you can see in the graph below when we have had a positive January Indicator Trifecta in the midterm year, as we have had this year, gains for the year are well-above average – and the sweet has begun in September. This is represented in the red line. Despite the early year pullback this year you can see in the thick purple line that 2018 is on track with this Midterm Year January Trifecta pattern.
But, you may ask, “What happens when the midterm year is positive or above average at this juncture in contrast to the typical midterm year pattern?” Well, in short, the Sweet Spot has still performed quite well. As you would imagine, though, the Sweet Spot has been stronger on average and overall after a deeper midterm year correction, but it is still strong in positive midterm years.
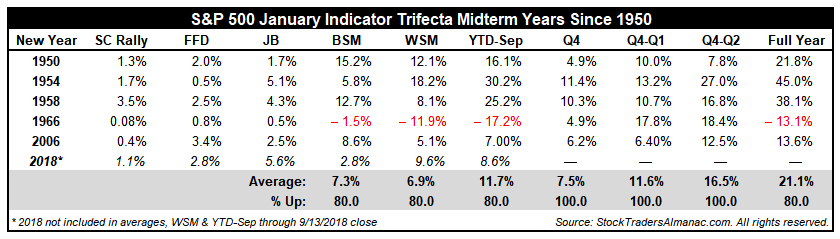
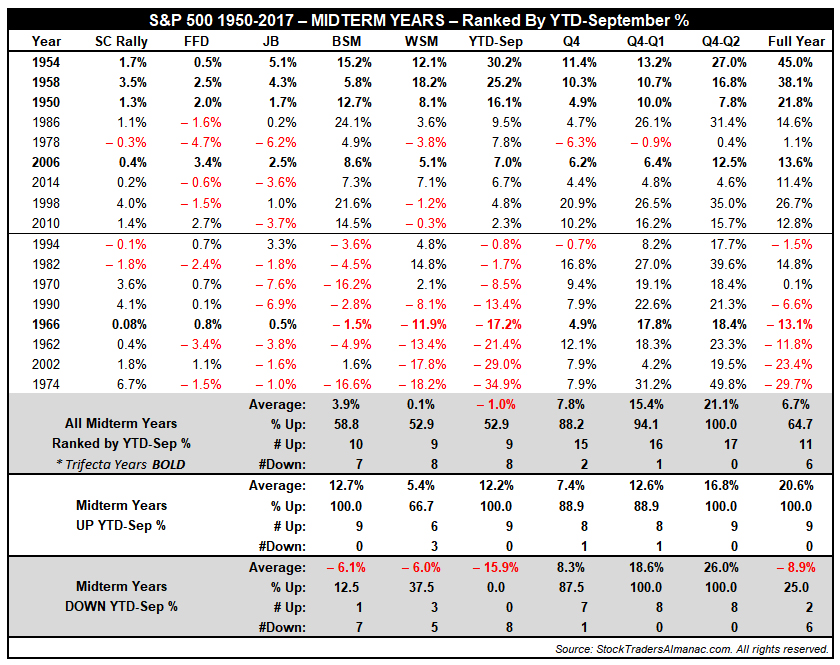
In the two tables below we have presented all the midterm years since 1950 with their Trifecta readings for the Santa Claus Rally, the First Five Days and the January Barometer; as well as the results for the BSM, WSM, YTD-September, Q4,Q4-Q1 (pre-election), Q4-Q2 (pre-election) and the full midterm year. Amazingly, the market performance for the Sweet Spot is still quite good after solid gains earlier in the year with only 1978 showing weakness.
So it is time to begin preparations for our next Best Six Months Seasonal MACD Buy Signal, which will confirm the 4-Year Cycle Sweet Spot rally has commenced. The earliest date that we can issue our Seasonal MACD Buy signal is October 1, 2018. The criteria to issue our Seasonal MACD Buy Signal is a new buy signal using our 8-17-9 MACD indicator on or after the first trading day of October and DJIA, S&P 500 and NASDAQ must be in agreement. When the criteria are satisfied, we will send an email Alert to all active subscribers detailing what trades to make in the ETF and Stock portfolios. Stay tuned.