On the heels of one of the strongest starts to year for the first four months May was destined for weakness. But this bodes well for June. May is notoriously weaker in pre-election years, like 2019, and after big starts to the year. The first four months of 2019 were up 17.5% for the S&P 500, the third best since 1950. Following the previous top 20 starts May was down 9 times for an average gain of 0.2%. June is more bullish in general during pre-election years and even more so after weak Mays. After big starts, 7 of the 9 subsequent
May declines were followed by big gains in June.
Bonds yields have been falling and an inverted yield curve is not a great sign, but our research finds that it really isn’t until the
Effective Fed Funds Rate is higher than the entire yield curve, including the long end, that you get an indication that a recession is imminent. Even still the two complete inversions back in December 1985 and December 1986 were years before Gulf War 1 fueled the July 1990 to March 1991 recession. Point being these short-middle end yield curve inversions are not especially indicative of an impending recession anytime soon. The Fed projected slowing growth and they can fix the inverted yield curve in a single action.
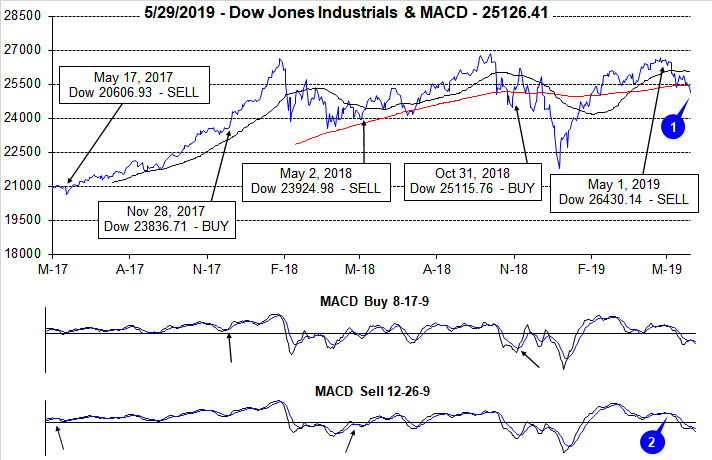
Plus this is right in line with bond seasonality. Falling yields are typical this time of year during the worst six months. Our Sector Rotation and Tactical Seasonal Switching Strategies have been adding some bond positions since mid-April and more on our Best Six Months MACD Seasonal Sell signal for DJIA and S&P 500 on May 1st.
We did sell a few things on our Sell Signal, but we did not and have not gone away. We “repositioned” in May and our timing was fortuitous. Over the next two months, June and July, we will be evaluating and preparing another basket of Defensive Stocks for the summer market doldrums. Last year’s Defensive Stock Basket did quite well and helped us weather the correction last fall. This is all part of our methodology that utilizes a combination of historical-proven seasonal patterns in conjunction with fundamental and technical analysis as well as market sentiment and macro geopolitical trends.
As illustrated in the accompanying chart overall the market is tracking the seasonal patterns quite closely, especially for a pre-election year – albeit with a bit more magnitude than average.
Technically the market is under pressure and looking for support here at S&P 2775, which sits right at the 200 DMA, but also runs through several gaps, consolidations and resistance levels over the past year and a half. It tested 2775 yesterday and bounced off it again today. 2725 is the next level of support near the March lows – a 7.5% correction. The next level of support is 2650, at the top of the December V-drop and end of January breakout – a 10% Correction. Then 2580 at the February/April 2018 lows – 12.4% correction.
President Trump and the Fed are highly sensitive to market action. Last fall was a case in point. The Fed did a 180 and ceased the rate tightening cycle and Trump delayed the tariffs. If the stuff hits the fan and the market nears bear territory both will likely act quickly. Mr. Trump is a business and market cycle watcher and knows he needs a bull market for reelection. He has hung his hat on it. Expect a deal with China after the summer or sooner if the market drops further so that Trump can point to new highs as we head into the election year.
The recent decline in market sentiment is not a bad sign. Market sentiment is generally a contrary indicator. Markets climb walls of worry because folks on the sideline slowly feel left out and creep back in. Market Sentiment was elevated recently but not extreme. Besides it’s the worst six months and markets struggle at this time of year. Add in the China trade battle and domestic political squabbles and folks are prone to shift their attention away from Wall Street head for the beach.
We are not expecting a bear market to emerge in the near-term, but a correction or pullback like the market experienced in Q4 of last year is now in the cards. After the market’s stellar four-month run, at a bare minimum a period of backing and filling in the near-term is likely. While we do not anticipate much upside over the next 5 months or so, June is set up for a boon.
Pulse of the Market
On the close of trading on May 1, we issued our Seasonal MACD Sell Alert for DJIA and S&P 500. Immediately following the Alert, the market was kind and offered a few trading sessions to unwind associated positions and add some defensive positions before succumbing to the weight of geopolitics and trade concerns. Through yesterday’s close (May 29), DJIA has shed over 1300 points and slipped below its 50- and 200-day moving averages (1). S&P 500 and NASDAQ have also weakened and retreated from their respective highs traded nearly one month ago.
Improvement in DJIA’s faster and slower MACD indicators just prior to our Seasonal Sell has been completed erased and both indicators are currently negative, below the zero line and trending lower still (2). Our research covering strong starts and down Mays suggests the market could bounce and produce respectable gains in June despite June’s long-standing reputation for being a tepid month at best. Should a rebound ensue in June, a corresponding improvement in MACD indicators is anticipated.
Early year strength that produced week after week of gains for DJIA, S&P 500 and NASDAQ has vanished. DJIA has declined five weeks straight (3) and nine of the last thirteen. During DJIA’s recent losing streak, it recorded its third Down Friday/Down Monday (DF/DM) warning of 2019 (4). Historically, past occurrences were frequently followed by further declines sometime during the next 90 days. The current occurrence was followed immediately by losses. The recent DF/DM also ended DJIA’s streak of winning Fridays. Traders and investors hesitant to hold positions over the weekend is a signal that confidence and sentiment have shifted and not in a good way.
After resisting DJIA’s weakness for two weeks, S&P 500 (5) and NASDAQ (6) gave up and joined DJIA with their own losing streaks. S&P 500 and NASDAQ have been down three straight and all three indexes are on course to extend their losing streaks another week.
Market breadth measured by NYSE Weekly Advancers and NYSE Weekly Decliners (7) remained positive through the first week ending in May. Since then Weekly NYSE Decliners have easily outnumbered Weekly NYSE Advancers. Thus far, clear indications that the decline is at or near its end have been absent as Weekly Decliners have not spiked like they did back in December.
Weekly New Highs appear to have peaked during the first week of trading ending in May (8) as they have been slipping lower since. There has also been a corresponding increase in Weekly New Lows. This is exactly what is expected during a market decline. Here again, absent a spike in Weekly New Lows, the trend of declines appears it could persist in the near-term.
Weeks of market declines have driven up demand for safe havens and this demand is reflected in the 30-year Treasury bond yield (9) falling back below 3%. Last week, it stood at 2.8% which is still above Fed funds, so the yield curve is not fully inverted. Should the curve fully invert, then the risk of recession would rise significantly.
Click for larger graphic…