Major U.S. stock market indices continue to track historic seasonal patterns and the historical seasonal pattern for Pre-Election Years quite closely this year and that suggests it is likely to continue to do so. The Dow, S&P 500 and NASDAQ have just logged new all-time highs and while that is bullish for the year as a hole and the second half in general it does indicate that we are ripe for a seasonal pullback.
As you can see in the accompanying chart mid-July in Pre-Election Years is frequently a point where the market begins its seasonal retreat after hitting new highs. Then after choppy, sideways, backing and filling action over the “Worst Four Months” July-October, additional new highs are usually reached in December and often at yearend, even on the last trading day of the year.
Frankly, the market is really getting everything it wants. At least a quarter point Fed rate cut is likely at the end of July. It looks like President Trump and the Democrats have worked out a new budget and debt ceiling deal this week that will be signed into law shortly. The trade battles and negotiations continue crawling along and every time things look a little shaky the Trump administration sends top officials for high level talks with China. Up until recently, economic readings and corporate results have been solid. This has all been a boon for stocks.
But now as economic data and earnings season has not been exceedingly firm, seasonal weakness, technical resistance and elevated sentiment have created an environment where the market is likely to retreat toward recent support levels around the March and June 2019 lows near Dow 25000, S&P 2725 and NASDAQ 7333 over the next three months – in the 8-12% correction area.
However, our longer term outlook for yearend and Election Year 2020 remains bullish. So here’s a little preview of our outlook for 2020 from the Stock Trader’s Almanac 2020 that we just sent to the press first shared with you, our loyal Almanac Investor Newsletter members.
For 2020, we could easily join the throng of skeptics and bears that are forecasting recession and a down market for 2020 and stoke investor’s fears, but we have three main observations that have guided us toward a more bullish outlook for Election Year 2020.
1. The Power of Incumbency. As you can see in the accompanying chart the stock market has performed much better in election years when a sitting president is running for reelection. Since 1949 the Dow is up 10.1% in election years when a sitting president is running for reelection vs. 5.3% in all election years and –1.6% in election years with an open field and no incumbent commander-in-chief running for a second term.
2. Fiscal and Monetary Policy Synchronicity. After several years of conflicting policy the Federal Reserve and the U.S. Federal government are finally getting in synch. Interest rates are historically low and the Fed is on the brink of lowering rates at the same time as fiscal policy has been lowering taxes and increasing spending. These dual pro-growth policies should continue to propel the stock market higher.
3. Recent Pattern of 50% Moves Following Extended Consolidations. An interesting pattern has materialized following the past few market consolidation phases. After bouncing around a base for 2-3 years the DJIA has rallied 50% higher. Following the 2009 secular bear market low the market rose to the 12,000 level on the Dow in February 2011 and then moved sideways for about than 2 years up and down and around 12,000. Then it took off at the end of Election Year 2012 rising 50% to 18,000 at the end of 2014. DJIA stayed close to 18,000 until just after the election in 2016. Then it jumped up another 50% near 27,000 in January 2018. Until this month DJIA has been unable to breakthrough 27,000. If this pattern continues, the next 50% move higher can be expected to gain momentum in 2020.
These gains will of course not come without pause and correction. The world stage will continue to feature some challenging geopolitical, diplomatic, trade-related and economic storylines. U.S. presidential campaign politics will increasingly focus on domestic political disputes, standoffs and unfinished business. But when all is said and done we expect 2020 to be an up year based on the historical patterns and cycles and current favorable policies, relatively healthy economics, a dovish Fed and positive market behavior. This all points to the likelihood that our May 2010 Super Boom Forecast when the Dow was around 10,000 for the Dow to reach 38,820 by the year 2025 may be ahead of schedule. (Check out the
update of the Super Boom Forecast in the April 11, 2019 subscriber alert on our website.)
Pulse of the Market
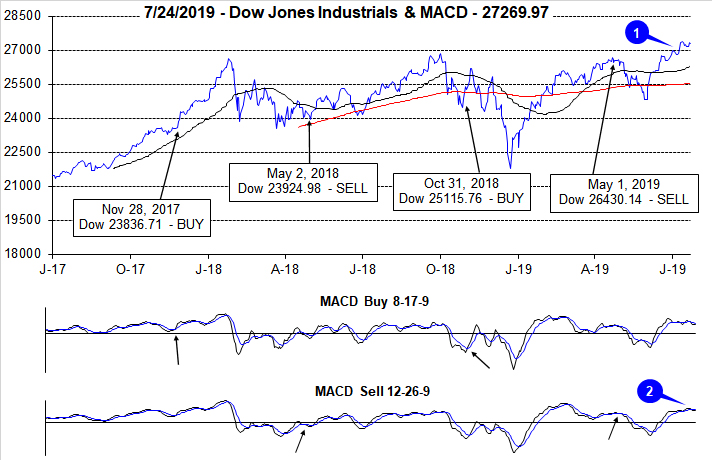
DJIA broke out to new all-time highs in July, crossing through and closing above 27,000 for the first time ever (1). Both DJIA’s 50- and 200-day moving averages are bullishly trending higher, but positive momentum is showing signs of waning which is being confirmed by MACD indicators. Both the faster and slower moving MACD indicators applied to DJIA are negative and trending lower (2). Thus far, DJIA has only demonstrated mild weakness, but absent further catalyst DJIA could be on the verge of a mild, seasonally driven pullback in the near-term.
During the holiday shortened week in observance of Independence Day DJIA recorded its fourth Down Friday/Down Monday (DF/DM) of 2019 (3). Historically such occurrences have been followed by weakness sometime during the following 90 calendar days. Thus far, that weakness has been virtually nonexistent with just a mild loss during last week. Although the DF/DM did break DJIA’s winning streak of Monday gains, Monday’s performance over the past eight weeks is the exact opposite of what it was in the prior eight-week period.
Even with a couple of weekly losses sprinkled in, DJIA, S&P 500 and NASDAQ all advanced solidly in June and are positive in July with four trading sessions remaining. DJIA, S&P 500 (4) and NASDAQ (5) have risen in six of the last eight weeks. Unlike lengthy consecutive weekly winning streaks an occasional down week is probably healthy for the market as it may keep sentiment in check.
Market breadth measured by NYSE Weekly Advancers and NYSE Weekly Decliners (6) has been somewhat tepid over the past four weeks with Advancers leading declining by only modest amounts. This is possibly an early caution sign as it suggests recent highs were not supported by a broad base of participating stocks. If the breakout was fueled by just a few large stocks, then it may not last.
Weekly New Highs and Low (7) have also broken the bullish trend that was in place in June. New Highs have slipped lower while New Lows have risen since late June. This is yet another caution flag that may suggest the breakout to new highs may be short-lived. If New Highs continue to decline in number with expanding New Lows, lower is likely to be the next direction for the market at least in the near-term.
After slipping to a multi-year low, the 30-year Treasury bond yield (8) has rebounded and appears to be leveling off in the 2.5 to 2.65 range. Yields are likely to bounce around in a narrow range while waiting for the next Fed announcement on July 31. Historically, low rates have been a positive for stocks and within that context; rates remain low, even today.
Click for larger graphic…