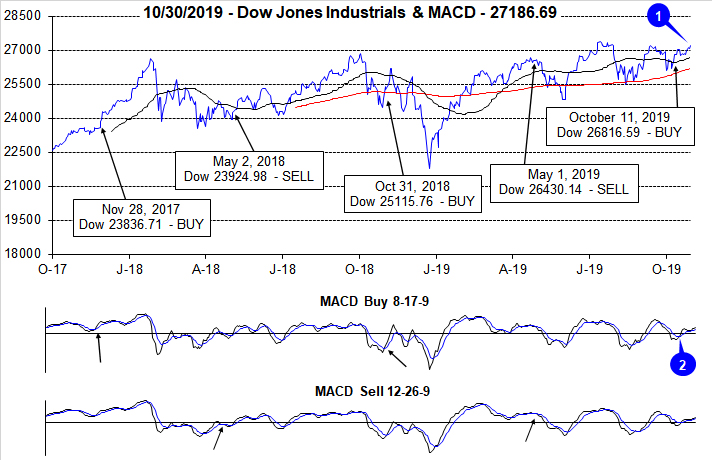
Despite a scary trading day today spooked by the latest trade and impeachment fears, the market has been rising steadily since our October 11 Seasonal Best Six Months MACD Buy Signal. Our defensive positions did well while the market gained little ground from our May 1st Sell Signal until our October 11 Buy Signal. We have now fully deployed for the Best Six Month with new positions in the
major market ETFs, Sector ETFs and a
brand new stock basket rich in undervalued growth stocks under Wall Street’s radar.
Now that we’ve survived Octoberphobia and the market has begun to strengthen again, breaking out above support and logging new highs on the S&P 500, we are likely to experience a bit of consolidation in November. Normally the top S&P month of the year and #2 for DJIA, NASDAQ and the Russell 2000, November is considerably weaker in Pre-Election Years.
As you can see in the updated chart of Pre-Election Year Seasonal Patterns overlaid with 2019 we have been tracking all year November tends to be flat in the Pre-Election Year with a pop around Thanksgiving. Then after the usual first half of December softness the market tends to push toward additional new highs near yearend. Considering the banner performance so far this year and the uncanny tracking of this historical seasonal pattern, we expect the stock to consolidate over the next few weeks and then resume the march to new highs.
Technically, the market has a little work to do here to convert the old highs and resistance levels we
discussed two weeks ago into support before we can comfortably move to new higher highs. Fundamentals are also encouraging with Q3 GDP and earnings numbers coming in better than expected, jobs data remaining strong and an accommodative Fed that appears to have effectively lowered rates in a mid-cycle adjustment.
Market internals have also improved and most encouraging is the rising Advance-Decline Lines. Broad market participation is apparent in this chart of the S&P 500 in black, DJIA in green, NASDAQ in blue and the Russell 2000 in pink with their respective A/D Lines in the lower panes. For better perspective we’ve included the NYSE Composite A/D line in green instead of DJIA. S&P’s A/D Line leaves a little to be desired as it is not rising as steeply as the others.
So we have the Fed Put firmly underneath the market now after their relatively successful mid-cycle adjustment, seasonals and the 4-year election cycle at our backs, better than expected fundamentals, positive technicals and rising sentiment. The news on the impeachment proceedings and logistical snafus with phase one of the China trade deal are hanging over the market right now.
Expect the market to mark time as it often does in November of the Pre-Election as it digests the latest geopolitical machinations, before it makes a move at more new highs toward yearend.
Pulse of the Market
On October 11, faster moving MACD indicators applied to DJIA (2), S&P 500 and NASDAQ all turned positive and our Seasonal MACD Buy Signal was triggered. This marked an early beginning to the “Best Six Months” for DJIA and S&P 500 and the “Best Eight Months” for NASDAQ. DJIA logged just a 1.5% gain during this year’s “Worst Months.” At yesterday’s close, DJIA was back above 27,000 and with 172.47 points of its previous all-time closing high (1). S&P 500 did close at new all-time highs twice, earlier this week. NASDAQ was also closing in on its previous record close.
The markets path back towards its old highs has been choppy. After four straight weeks of declines beginning in late July through most of August, DJIA has been up five of the last nine weeks (3). S&P 500 (4) has accumulated six advancing weeks over the same period while NASDAQ has logged seven weekly advances (5). Fresh trade and impeachment concerns are pressuring the market today and could end NASDAQ’s weekly winning streak.
Market breadth measured by NYSE Weekly Advancers and NYSE Weekly Decliners (6) was positive for three weeks straight with Advancers enjoying the largest margin last week. This trend did produce new S&P 500 highs this week but is currently in danger of being broken. Another brief period of consolidation may be needed before the market can mount its next assault at new highs.
Weekly New Highs and Lows (7) exhibited positive and bullish behavior throughout most of October. New Highs slowly expanded over the last four weeks while New Lows shrunk modestly. This week’s choppy trading could also end this trend.
Fed rate cuts have succeeded in pulling down the 90-day Treasury rate while the 30-year Treasury rate (8) appears to be settling around 2.25% Both rates are significantly lower now than they were last December. Low rates have been a positive for stocks and consumers alike. Interest rates may not be at historic lows, they are still very low.