The beat rolls on. In the face of ongoing geopolitical and U.S. political volatility, machinations and all the noise, equity markets continue to march higher. While economic growth has slowed underlying strength remains evident. Market internals still have room for improvement with the Advance/Decline positive but not on the same trajectory as the indices and dearth of new 52-week highs.
If election-cycle politics come into play, we will either get a deal in principle before the December 15 date when new tariffs are supposed to kick in or the White House will kick the can into next year and delay the new tariffs some more so they can settle on an initial agreement with the Chinese well ahead of the 2020 Presidential Election.
In any event, seasonal strength is firing on all pistons as it has been all year, pushing the market to new highs and the Dow over 28000. As is often the case we’ve had a little pull back this week before Thanksgiving after hitting the 28000 milestone, likely triggered by comments related to delays in completing “Phase One” of the trade deal with China.
Going back to 1949 we are on pace for the 10th biggest year-to-date through November gains for the S&P 500 – and it’s a healthy sign for the rest of the year and next. We crunched the numbers for the S&P 500 YTD gains as of the end of November. Average YTD November gains are 7.4%. The list below shows the Top 21 YTD November that are all twice the average, which we felt best represents the current situation.
Following Decembers and following years have had solid performance and average to slightly better than average results. After big YTD gains December is up 71.4% of the time with an average gain of 1.7% and the next year is up 81.0% of the time with an average gain of 9.9%. The reinforces our positive outlook for the rest of 2019 and 2020.
Fourth quarter seasonal strength is rather apparent in the updated accompanying chart of Pre-Election Year Seasonal Patterns overlaid with 2019. November has been stronger than usual, especially for a pre-election year, with DJIA up 2.7% for the month as of today’s close, S&P 500 up 2.2% and NASDAQ up 2.6%.
We may yet suffer a little more contraction before Thanksgiving considering how far we’ve come as the market digests the psychological threshold of the Dow’s big round number new high of 28000. This sets up the Thanksgiving Trade (Stock Trader’s Almanac, page 104) of buying into weakness the week before the holiday and selling into holiday strength. We should also get a boost from end-of-November seasonal strength.
Tax-loss selling often kicks in the first half of December, creating a soft patch for the market early in December. This is also evident in the chart here. The old “January Effect” of small caps outperforming large caps in January begins in mid-December. Then the Santa Claus Rally comes to town.
As soon as Thanksgiving comes around on the calendar – or even Halloween – all the talk on The Street is: “Will we or won’t we have a Santa Claus Rally?” But they all refer to it as the 4th Quarter Rally or the November-December Rally or the December Rally or the Halloween-New Year’s Rally or the Thanksgiving-Christmas Rally.
Yes, the market has a strong tendency to rally smartly in Q4, but that is not the Santa Claus Rally. The Santa Claus Rally was discovered and named by Yale Hirsch in 1972 and published in our 1973 Stock Trader’s Almanac. As defined by Yale and detailed on page 116 of the newly released 53rd Annual 2020 Edition:
“Santa Claus tends to come to Wall Street nearly every year, bringing a short, sweet, respectable rally within the last five days of the year and the first two in January. This has been good for an average 1.3% gain since 1969 (1.3% since 1950 as well). Santa’s failure to show tends to precede bear markets, or times stocks could be purchased later in the year at much lower prices. We discovered this phenomenon in 1972.”
To Wit, Yale’s witty rhyme which has become the headline of our “Santa Claus Rally” page and the battle cry of market pundits during the holiday season: “If Santa Claus Should Fail To Call, Bears May Come To Broad And Wall.” After last year’s debacle and Christmas Eve Crumble for the market, the SCR was our first confirming bullish indicator that we had reached a bottom on December 24, 2018 and that the prospects for 2019 were quite positive.
We capitalize on the Small Cap Effect and the Santa Claus Rally with our Bargain Stock Strategy we call “The Only Free Lunch on Wall Street.”
Last year’s basket of “Free Lunch” stocks making new 52-week lows on December Triple Witching Friday was a boon. This year we will make our selections from stocks making new 52-week lows on Friday, December 20, 2019. Subscribers will be emailed the list before the open on Monday, December, 23, 2019 – likely over the weekend.
Finally Pre-election Years tend to make their highs around yearend and 2019 has been tracking this pattern to a T this year. So after a little chop between now and mid-December we expect further new highs.
Pulse of the Market
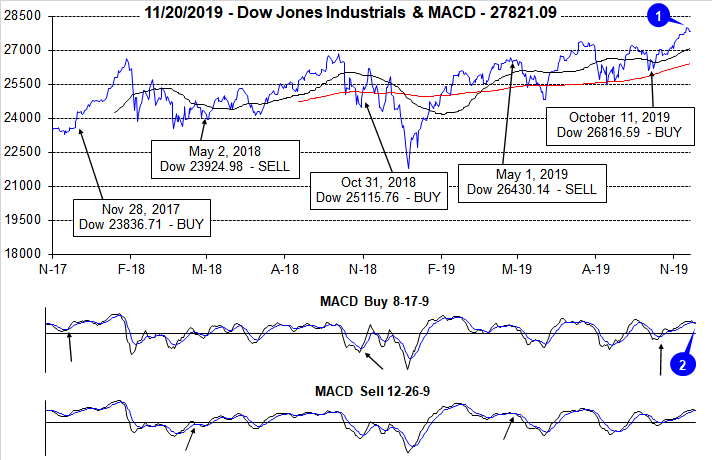
Fueled by better than expected corporate earnings and an improving trade outlook, DJIA surged above and closed above 28000 (1) for the first time ever on November 15. This was exactly five weeks after we issued our Seasonal MACD Buy Signal for DJIA, S&P 500, NASDAQ and Russell 2000. However, conflicting reports on trade have stalled DJIA’s progress this week. As a result, the faster and slower moving MACD indicators applied to DJIA have also begun to weaken (2). We have been looking for the market to weaken/pause around mid-November and that pause has arrived.
Bullishly, DJIA’s rise to new all-time highs was accompanied with corresponding new highs by S&P 500 and NASDAQ. DJIA has advanced four weeks straight (3) and five of the last six. S&P 500 has been up six weeks straight (4) while NASDAQ has logged seven straight weekly gains (5). Inevitably these winning streaks will end, but that does not mean the market’s rally will also be over. It’s been fourteen weeks (early August) since DJIA suffered back-to-back Down Friday/Down Monday warnings. This would suggest that trader and investor confidence remains firm.
Market breadth measured by NYSE Weekly Advancers and NYSE Weekly Decliners (6) has remained relatively positive over the last six weeks with Advancers outnumbering Decliners in five of the last six weeks. A wider margin, even more Weekly Advancers, would be a welcome and encouraging sign. At first blush the somewhat tepid number of Weekly Advancers could be an issue, but the more likely reason for the depressed number is rotation from defensive to growth positions. Utilities, energy and precious metals are all below their respective highs from earlier this year and are likely contributing to the number of Weekly Decliners.
Weekly New Highs and Lows (7) are also rather mixed. Previously mentioned rotation is also likely in play here as well. Another factor that could be weighing on readings is the fact that small caps, measured by the Russell 2000, are lagging. If the Russell 2000 was to catch up and trade at new all-times, weekly metrics would likely improve.
The 90-day Treasury rate and the 30-year Treasury rate (8) appear to be stabilizing around current levels. The Fed has signaled it is most likely done with rate cuts unless there is a material change to their outlook or the data. Historically, U.S. rates are low and other developed nation’s rates are even lower. Low rates have historically been a positive for stocks.
Click for larger graphic…