Last week the market was shrugging off pandemic setbacks, bleak economic and corporate outlooks, geopolitical tensions, civic unrest and a contentious U.S. presidential election battle with NASDAQ hitting a new all-time high and S&P 500 at a new recovery high. In fact we were looking at a classic
“Hot July” pattern with DJIA up 4.6% for the month as of the close on July 22.
Gains of this magnitude for July, however, have frequently been followed by late-summer or autumn selloffs and better buying opportunities than end-of-July. In the past, full-month July gains in excess of 3.5% for DJIA have been followed historically by declines of -7.2% on average (-4.7% median decline) in the Dow with a low at some point in the last 5 months of the year.
Quite a bit has changed in the past eight days with the Dow giving back 2.6% putting July up only 1.9% month-to-date. Jobless claims have up-ticked the past two weeks from 1.31 million to 1.43 million. To put it perspective the difference of 126,000 claims is just under half the entire pre-pandemic level of 282,000 weekly jobless claims released on March 19. Plus, today the Advanced Estimate (first reading of three) of Q2 GDP came in at -32.9%. This was the worst reading ever – even worse than the Great Depression. Perhaps we can find some solace in the fact that it was less bad than the early June estimates of -40-50%.
We are not bearish long term. The super accommodative Fed will continue to print money as needed and we are likely to see more fiscal stimulus from central governments that will tack on more trillions to the current running tab of about $13 trillion. With Congress scheduled to go into recess August 10 through Labor Day there is concern the next stimulus package that is currently in negotiation will not be completed prior. However, it is in both parties best self-interest to get it done before the break. If it does not get done the market will likely respond more negatively.
There has been a bit of chatter out there about how Q3 of election years is the best performing quarter of the entire 4-year presidential stock market cycle. But that study uses data going all the way back to 1900 when the world was a much different place with much of the economy driven by agriculture. Our studies show that all the election year Q3 outperformance transpired before WWII with an average DJIA gain of 11.1% from 1901-1948. However, from 1949-June 2020 election year Q3 averaged DJIA gains of only 0.7%, ranked 11th of 16.
Also any improvement to August and September performance during election years is attributable to the buzz and excitement around the conventions. Nowadays campaigning goes on pretty much nonstop. This year’s candidates are already set save Biden’s running mate. The rally off the pandemic low has put the market back at lofty levels again. With most of the good news baked in, the market will be hard-pressed to add significant gains over the next 2-3 months without some major virus breakthroughs and a return to more normal economic activity.
Checking the accompanying updated chart of election years tracking 2020 S&P 500 performance versus all election years and incumbent party wins and losses – as well as the polls – suggests that President Trump’s reelection is not a forgone conclusion. In fact S&P 500 is tracking the incumbent loss trend more closely. But that of course remains to be seen. Market performance over the next three months is critical to President Trump’s reelection bid and you can be sure he is well aware and will do everything in his power to boost the market as all incumbents generally do.
![[AIN_0820_20200730_Election_Year_Pattern.jpg Chart]](/UploadedImage/AIN_0820_20200730_Election_Year_Pattern.jpg)
Depending on the state of the pandemic, the economy and the market over the next three months and how President Trump handles the COVID situation as well as civic unrest and diplomatic machinations the election could go still go either way. If things go south and the president is not reelected the yearend rally will likely come from lower levels and be more robust. The market is more prone to a pullback or correction over the next two months than piling on the monster rally. So stick to the drill remain cautious, stay on the defense, hold winners, sell losers and be ready for the summer doldrums and then a yearend rally.
Pulse of the Market
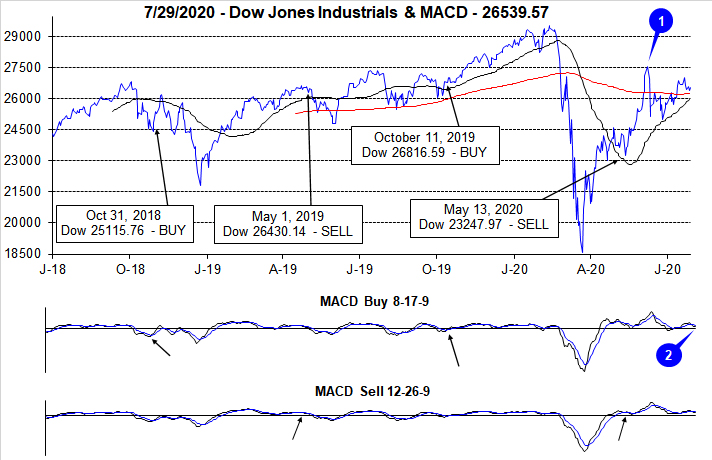
Spiking coronavirus cases across numerous locations in the U.S. has caused some areas of the country to slow and even reverse reopening plans. This has put a damper on expectations of a quick economic recovery and the pace of gains by DJIA. Early June DJIA highs (1) have not been eclipsed even with NASDAQ reaching new all-time highs and S&P 500 trading in positive year-to-date territory. As a result of DJIA essentially flat-to-sideways trading over the past five weeks, both the faster (2) and slower moving MACD indicators applied to DJIA are currently negative. This confirms DJIA’s loss of momentum and raises the odds of further weakness in the near-term.
Since the end of March, the market’s trend has been resoundingly higher, but that trend has grown increasingly choppy with DJIA (3), S&P 500 (4) and NASDAQ (5) oscillating between weekly gains and losses. Weekly winning streaks have not exceeded three weeks in a row since early in the fourth quarter of 2019. However, DJIA’s streak of advancing Mondays (or first trading day of the week) is impressive at eleven in a row and thirteen of the last fourteen. It would seem traders and investors worse fears and concerns have not been materializing over weekends. The last time DJIA enjoyed a longer streak of positive first trading days of the week was at the end of 2009 that lasted through January 2010.
Market breadth measured by NYSE Weekly Advancers and NYSE Weekly Decliners (6) has gotten choppier over the last five weeks as tech stocks have charged higher leaving many other sectors behind. As the pandemic drags on, the market will likely increasingly favor the companies and sectors best equipped to navigate an uncertain outlook. As major indexes become increasingly tech-heavy, their advances may not accurately reflect the state of the economy and employment. Weekly market breadth is likely to remain mixed which is probably a better reflection of the current economic conditions.
Weekly New Highs (7) have been steadily trending higher, but the pace has been slow as broad market participation is still lacking. New all-time NASDAQ highs and the success of tech in general during the pandemic has produced the majority of new individual stock highs. The subdued number of New Weekly Lows is encouraging though as it suggests selling pressure in weaker areas of the market may have subsided.
Interest rates (8) are once again historically low and are likely to remain so for at least the foreseeable future. After peaking in early June, the 30-year Treasury rate is again trending lower toward its April low. Lower rates will aid consumers (to varying degrees) and the last cycle of ZIRP (zero interest rate policy) proved especially beneficial to the stock market. Odds are stocks will enjoy a similar outcome as well this time around.