Seasonality remains back to normal and it appears from all our observations that it will continue to track historical patterns for the remainder of the year. April’s solid returns across the board led by S&P 500 (up 6.0%) and NASDAQ (up 6.3%) and new highs for DJIA, S&P 500 and NASDAQ capped off a banner Best Six Months. DJIA is up 28.5%, S&P 500 is up 28.8%, NASDAQ is up 29.1% and the Russell 2000 is up an amazing 49.2% since the close of October through today’s close.
We issued our
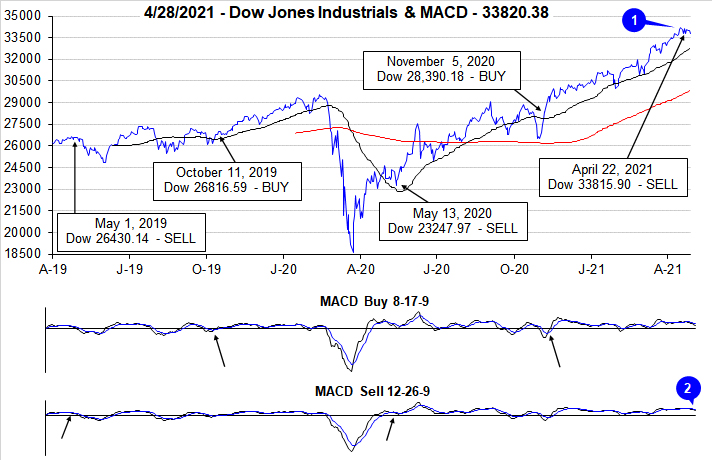
Best Six Months MACD Seasonal Sell Signal last week on the close of April 22. From our
November 5 Buy Signal DJIA gained 19.1% and S&P advanced 17.8%. The Sell Signal looks rather timely with the MACD crossover or negative histogram occurring well above the zero line. NASDAQ’s Best Eight Months ends June 1 so the running gains so far are 18.4% for NASDAQ and 38.3% for Russell 2000 as of today’s close. June 1 is the earliest NASDAQ’s Seasonal Sell can trigger.
Our portfolios are shifting to a more neutral stance until we get that NASDAQ Seasonal Sell Signal. SPDR DJIA (DIA) and SPDR S&P 500 (SPY) positions were closed out of the portfolio using their respective average prices on April 23. Invesco QQQ (QQQ) and iShares Russell 2000 (IWM) remain on HOLD until we get NASDAQ’s Seasonal Sell.
As you likely know, we don’t “Sell in May and go away.” We do sell some things, and we do buy some things for the Worst Six Months. Instead of selling in May, we prefer to “Reposition in May.” For the beginning of our Worst Six Months repositioning we’ve suggested establishing half positions in iShares Core US Aggregate Bond (AGG) with a Buy Limit of $115.00 and Vanguard Total Bond Market (BND) with a Buy Limit of $85.65.
We also sold SPDR Materials (XLB) and Vanguard REIT (VNQ) as these sectors’ bullish seasonalities end in May. Over the next several weeks in upcoming email Alerts we will be reevaluating all current stock and ETF holdings. Weak or underperforming positions may be closed out, stop losses may be raised, new buying may be limited and we will evaluate the timing of adding positions in sectors that perform well in the Worst Six Months and presenting you with a new basket of defensive stocks.
In case you missed it, we covered much of our Worst Six Months outlook and strategy in our April 28 webinar: “Sell in May But Don't Go Away! Tactical Seasonal Sector Rotation & Stock Trading Strategies.” You can watch the replay if you register at this link
https://register.gotowebinar.com/register/5753287365631356685.
Seasonal Patterns Endure
Year to date the S&P 500 is up 12.1%. This is way above the historical averages and a rather encouraging sign that supports our outlook for a muted Worst Six Months manifesting in mostly sideways market action with limited shallow pullbacks and no major corrections. We had a superb question come up on the webinar about market behavior following first four months up more than 10%. We posted our findings on the blog and found that the previous 17 times since 1950 that the
S&P 500 was up over 10% for the first four months preceded flat market performance from May to late-October.
The chart here of the S&P 500 Seasonal Pattern overlaid with the years January-April were up more than 10% also highlights how well the market continues to track seasonals in 2021. The magnitude of gains is well above historic norms, but weakness in late February and late March as well as solid April strength are emblematic of typical seasonal market behavior.
The market is ripe for a pause and pullback following the extended up move we’ve had. Technically the charts of the indexes look toppy. The chart here of the NASDAQ 100 (NDX) we have been tracking shows the NDX stalling around our 13,900 resistance line. As discussed in the Pulse of the Market below market internals also appear to be rolling over.
As the market’s prospects over the next several months look rather tame with little upside we will stick with the system and begin repositioning for the Worst Six Months and shift to a more neutral stance until we get our NASDAQ Sell Signal. But our outlook remains bullish for the year as a whole.
The Fed continues to reaffirm its unrelenting support for the economy and its commitment to remain super accommodative. The market seems to be reacting well to President Biden’s first 100 days, his agenda and the plans he laid out in his speech last night. Despite several concerning global hotspots the Covid-19 pandemic does not appear to be impacting the market much anymore.
Now that folks in many countries are returning to normal they will likely be returning to more normal seasonal behaviors and taking time away from the market in the summer months. This should help facilitate the usual summer market doldrums of lighter volume and the usual tepid sideways action with minor pullbacks during the Worst Six Months May-October. This is the perfect time for some spring portfolio cleaning, reevaluating positions and some repositioning.
Pulse of the Market
April has lived up to its historical reputation of being the best month of the year for DJIA since 1950 once again this year. Following a string of new all-time highs early in the month (1), DJIA closed above 34,000 for the first time ever on April 15. But momentum quickly faded and on the close of trading on April 22, the slower moving MACD “Sell” indicator applied to DJIA (2) and S&P 500 was negative triggering our Seasonal Sell for DJIA and S&P 500. From our Seasonal Buy on November 5, 2020, through April 22, DJIA gained 19.1%, well above historical average of 8.8%.
Prior to our Seasonal Sell, DJIA (3) and S&P 500 (4) logged gains in four consecutive weeks. NASDAQ (5) was only modestly weaker with gains for three straight weeks. All three indexes were down last week and could finish this week in the red. If this occurs it would be the first back-to-back weekly declines by all three indexes since last October. DJIA’s recent streak of gains on the last trading day of the week could also be at risk of ending.
Market breadth measured by NYSE Weekly Advancers and NYSE Weekly Decliners (6) was positive in four of the last five weeks. Weekly Decliners have been slowly creeping higher while market gains have slowed. Coupled with MACD turning negative this is additional confirmation that the market’s rally has faded.
Weekly New Highs (7) have wandered all over the place since peaking at 951 during the second week of March. Weekly New Lows have also increased. This suggests the market is running out of steam and much of the recent positive news has already been priced in. If New Highs continue to dwindle and New Lows expand then the market could be headed towards a pullback or a mild correction.
The Treasury yield curve had flattened out modestly over the past five weeks as 90-day Treasury yields held steady just above 0% and the 30-Year Treasury yield retreated from its mid-March peak of 2.41 (8). Talk of more Federal spending this week has rates moving higher this week. Rates could make a move higher, but any move higher is likely to be capped by significantly lower rates in other major developed markets like Europe and Japan.
Click for larger graphic…