|
September Almanac: Worst Month of Year Over Last 71 Years
|
|
By:
Christopher Mistal & Jeffrey A. Hirsch
|
August 19, 2021
|
|
|
|
Start of the business year, end of summer vacations, and back to school once made September a leading barometer month in first 60 years of 20th century, now portfolio managers back after Labor Day tend to clean house Since 1950, September is the worst performing month of the year for DJIA, S&P 500, NASDAQ (since 1971), Russell 1000 and Russell 2000 (since 1979). After four solid years from 1995-1998 during the dot.com bubble buildup, S&P 500 was down five Septembers straight from 1999-2003. In the 17 years since, S&P 500 has advanced 11 times in September and declined six times.

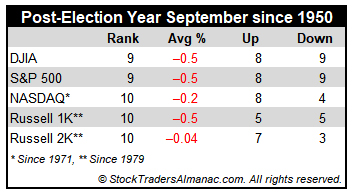
In post-election years, September’s overall rank improves modestly in post-election years going back to 1953 (third or fourth worst month depending on index). Average losses are little changed. Although September 2001 does influence the average declines, the fact remains DJIA and S&P 500 have declined in 9 of the last 17 post-election year Septembers. Russell 2000 has the best post-election year record, up seven times in 10 years.
Although the month used to open strong, S&P 500 has declined nine times in the last thirteen years on the first trading day. As tans begin to fade and the new school year begins, fund managers tend to sell underperforming positions as the end of the third quarter approaches. This has caused some nasty selloffs near month-end over the years. Recent substantial declines occurred following the terrorist attacks in 2001 (DJIA: –11.1%), 2002 (DJIA –12.4%), the collapse of Lehman Brothers in 2008 (DJIA: –6.0%) and U.S. debt ceiling debacle in 2011 (DJIA –6.0%).
September Triple Witching week is generally bullish with S&P 500 advancing nearly twice as many times as declining since 1990 but is has suffered some sizable losses. Triple-Witching Friday was essentially a sure bet for the bulls from 2004 to 2011 but has been a loser six or seven of the last nine years, depending on index with S&P 500 weakest, down eight of the last nine. The week after Triple Witching has been brutal, down 25 of the last 31, averaging an S&P 500 loss of 0.94%. In 2011, DJIA and S&P 500 both lost in excess of 6%. The week after was last positive in 2016 and 2017 for DJIA and S&P 500.
In recent years, Labor Day has become the unofficial end of summer and the three-day weekend has become prime vacation time for many. Business activity ahead of the holiday was more energetic in the old days. From 1950 through 1977 the three days before Labor Day pushed the DJIA higher in twenty-five of twenty-eight years. Bullishness has since shifted to favor the two days after the holiday as opposed to the days before. DJIA has gained in 16 of the last 27 Tuesdays and 20 of the last 26 Wednesdays following Labor Day.