It is a pleasure for Jeff to be reporting on our monthly outlook from the
49th Annual CMT Symposium. And it is a privilege and honor for him to be presenting to this venerable body of market technicians on Friday, April 29, 2022. “
The Chartered Market Technician® (CMT) designation marks the highest education within the discipline and is the preeminent designation for practitioners of technical analysis worldwide.” Perhaps it’s coincidence or perhaps it’s kismet that his presentation to the CMT Association 2022 Symposium occurs on the last day of the Best Six Months of the year November-April.
The Worst Six Months of the year (May-October) for 2022 commences on the heels of the worst start for the market since 1950. As of the close on Tuesday April 26, S&P 500 was down 12.4% for the year. The second worst start to the year was 1970, down 11.5% at the same point on the fourth to last trading day of the month – more on 1970 in a moment. As of the close on April 27, April is down 4.0% for DJIA, 7.6% for S&P 500 and 12.2% for NASDAQ. April being the best month of the year this is not a great sign.
As we noted on the
blog, when the S&P 500 is down year-to-date and down in April, it preceded a yearly loss 69.2% of the time with an average loss of 7.3%. With just two trading days remaining, April will not likely live up to its historically bullish reputation this year. S&P 500’s decline in April as of April 27 is 7.6%, the second worst April since 1950 and sixth worst since 1930.
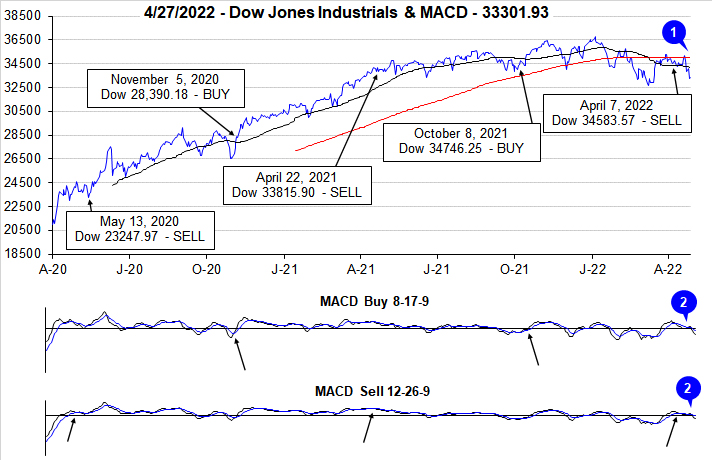
To top off the ominous seasonality readings, the current Best Six Months from the close of October are off 7.0% for DJIA and -9.2% for S&P 500. From our MACD Buy Signal on October 8 to our recent Sell Signal on April 7 the results improve to -0.5% for DJIA and positive 2.5% for S&P. NASDAQ’s Best 8 Months ends in June but so far, it’s down 19.4% from the end of October and -12.2% from the Buy Signal.
In the words of the late, great market analyst Edson Gould (Findings & Forecasts, 1902-1987): “If the market does not rally, as it should during bullish seasonal periods, it is a sign that other forces are stronger and that when the seasonal period ends those forces will really have their say.”
Welcome To the Weak Spot of the 4-Year Cycle
Not only are we on the cusp of the Worst Six Months, we also about to enter the Weak Spot of the 4-Year Presidential Election Cycle. We created the bar chart here to highlight this critical juncture of 4-Year Cycle we have been discussing all year. The second and third quarter of the midterm year has been the weakest period of the entire 4-year pattern averaging losses over the 2-quarter period of -1.2% DJIA, -1.5% S&P and -5.0% NASDAQ. But thankfully, this sets up the even more important Sweet Spot of the cycle where DJIA gains 19.3%, S&P 20.0% and NASDAQ 29.3% over the three quarters from midterm year Q4 to pre-election year Q2.
![[Weak/Sweet Spot Chart]](/UploadedImage/AIN_0522_20220428_Weak_Sweet_Spots.jpg)
Our updated S&P 500 Midterm Year Seasonal Pattern reinforces this quadrennial buying opportunity as the market tends to find a midterm bottom over the next six months. The graph shows the “average” year, but it is important to note that these midterm bottoms have occurred at different times in individual midterm years and many of them came toward the beginning of the Weak Spot. The May 26, 1970 bear market low is a prime example.
1960, 1970 & 2022
As you can see here in our graphic comparison of the years 1960 and 1970 to this year, 2022 is tracking eerily close to those two bear market years. Both 1960 and 1970 hosted recessions and rate increases in the prior year. Inflation in 1970 was closer to current conditions with the CPI (Consumer Price Index) peaking around 6.5% year-over-year. It would be nice if 2022 played out more like 1960 with milder losses. Unfortunately, present circumstances are more akin to 1970. 1960 was also an election year, while1970 was a midterm year like 2022.
This time is a little different due to covid-disrupted supply chains and the fallout from Russia’s invasion of Ukraine with soaring energy and commodity prices. We are not implying the 36% bear market losses from the 1968 top to the 1970 bottom are in the cards, but we suspect that we have not found bottom just yet. Though it is becoming increasingly possible we get a bottom sooner rather than later as we did in May 1970 with the Fed expected to raise rates 50 basis points at the May meeting and Russia looking to chalk up a victory on WWII Victory Day celebrated on May 9 in Russia.
Technical Support Being Tested
The support we have been keen on for the last two months at the intraday lows on February 24, the day Russia invaded Ukraine have held on DJIA and S&P 500 but are being tested on NASDAQ and our favorite benchmark these days NASDAQ 100 Index (NDX), which is tracked by the Invesco QQQ Trust (QQQ). NDX has been leading the market in both directions for several years.
After failing to find support at the 200- and 50-day moving averages in March and April NDX closed below the February 24 and March 14 intraday and closing lows two days in a row on April 26 and 27, closing just above the big round 13000 number. A breach of this level would likely signal a test of the March 2021 lows around 12250. This would be equivalent to about 31000 DJIA and 3750 S&P 500. The NASDAQ Composite has already tested and slightly breached the March 2021 support levels around 12500, which brings the old October 2020 support levels around 10500 into play.
![[NDX Chart]](/UploadedImage/AIN_0522_20220428_NDX.jpg)
In short, the market currently faces a plethora of headwinds. Preliminary readings for 2022 Q1 GDP (Gross Domestic Product) were a major disappointment today registering a 1.4% loss versus expectations of a 1% increase. It was a complicated report with big inflation numbers and a large trade deficit that likely subtracted about 3 percentage points from the GDP number. By the time the final Q1 GDP number comes in in June it is likely to be revised higher.
We might get an early midterm bottom like 1970 or a milder more drawn-out bottoming process like 1960 and the average midterm year. Either way, fasten your seatbelts, volatility is probably here for the next several months as the market searches for bottom. Stay cautious, be patient and wait for the fatter pitch later in the Worst Six Months or for our next Best Six Months Buy Signal sometime on or after October 1. Today’s rally is encouraging, but let’s not get ahead of ourselves as we expect continued heightened volatility in the face of midterm year and seasonal pressures, supply chain issues, inflation, and rate hikes.
Pulse of the Market
On the market’s close of April 7, the slower moving MACD Sell Indicator applied to DJIA and S&P 500 turned negative and we issued our Seasonal MACD Sell Signal for DJIA and S&P 500. For a brief period following the Sell Signal the market did provide an opportunity to unwind long positions associated with DJIA and S&P 500. However, uncertainty and volatility have remained elevated. From the April 7 close through yesterday’s close, DJIA is down 3.71% while S&P 500 declined 7.03%. DJIA has fallen back below both its 50- and 200-day moving averages (1). Both the slower and faster moving MACD indicators applied to DJIA (2) have continued to trend lower (2).
In the first four months of the year DJIA has recorded six Down Friday/Down Monday (DF/DM) occurrences. The most recent was completed just after mid-April (3). Initially it was shaken off with gains on the following Tuesday and Wednesday (April 19 & 20), but those gains did not hold as DJIA dropped nearly 1350 points on Thursday and Friday. At the current pace of six DF/DMs in four months DJIA is appears on track to record 18 for the full year. The last time that happened was in 2002 (STA22 page 78).
DJIA was on track for another weekly loss this week. Should today’s gains fade, DJIA could record five straight weekly losses (4) and would be down in 13 of 17 weeks this year. S&P 500 (5) and NASDAQ (6) were also on track for another weekly loss prior to today. If the gains do not hold then their current streaks would extend to four straight and would bring S&P 500 and NASDAQ to 11 weekly losses in 17 weeks this year. The previous weekly losing streak was followed by a brisk multi-week snapback rally in the second half of March. Perhaps next week’s Fed meeting will be the catalyst for a similar bounce in May.
NYSE Weekly Advancers and Weekly Decliners (7) have been consistent with the market’s overall move. Decliners have outnumbered Advancers during losing weeks while the opposite occurred in advancing weeks. In two of the three last weeks, Weekly Decliners outnumbered Weekly Advancers by over two to one. If the opposite were to transpire it would improve the likelihood of a more sustainable market reversal and rally.
Weekly New Highs (8) have actually ticked slightly higher, but so have Weekly New Lows. The trend of New Lows is consistent with the market’s weakness. The modest increase in New Highs is likely due to defensive and/or bearish positions. The peak in New Lows has been steadily falling since the end of January. This is potentially an early sign that broad selling pressure is beginning to abate. Those that wanted out have likely gotten out. A peak below the early March high of 939 during the current week would be somewhat encouraging.
As the Fed’s hawkish tone has increased so have the 90-day and 30-year Treasury bond yields (9). 30-year Treasury yields hovering around 3% with recent inflation metrics running at multi-decade highs seems to suggest that the bond market does view the surge in inflation as transitory. Considering the time period of 30 years, it does seem highly plausible. Current rates are off of their respective lows, but remain low especially when compared to where they were the last time inflation was as high as it is today.