NASDAQ Seasonal MACD Update
After surging to finish May, NASDAQ (along with S&P 500 and DJIA) have stalled out. Our slower moving MACD “Sell” indicator (12-26-9) remains positive but is fading following eight days of sideways to lower movement right around 12000. As of today’s close, NASDAQ would need to decline a massive 932.86 points (7.94%) in a single day to turn MACD negative.
When NASDAQ’s MACD Sell indicator turns negative, we will issue our NASDAQ Seasonal MACD Sell signal via email Alert and begin clearing out remaining technology and/or small-cap positions held in the Almanac Investor ETF Portfolios. Until that time, all related positions are on Hold.
S&P 500 Performance Before, During and After Recessions
A recession has widely been defined by economists as two consecutive quarters of decline in GDP. Whether or not you are a glass half-full or half-empty person, Q1 U.S. GDP was negative which does satisfy half of that definition. More recently the Federal Reserve Bank of Atlanta’s GDPNow model’s estimate for Q2 U.S GDP has been trending increasingly closer to the zero line. In its most recent update on June 8, its estimate stood at 0.9%. This is a substantial decline compared to its May 17 projection of a 2.5% annualized quarterly growth rate. In an effort to gain a better understanding of the market’s performance before, during and after recessions we have compiled the following table.
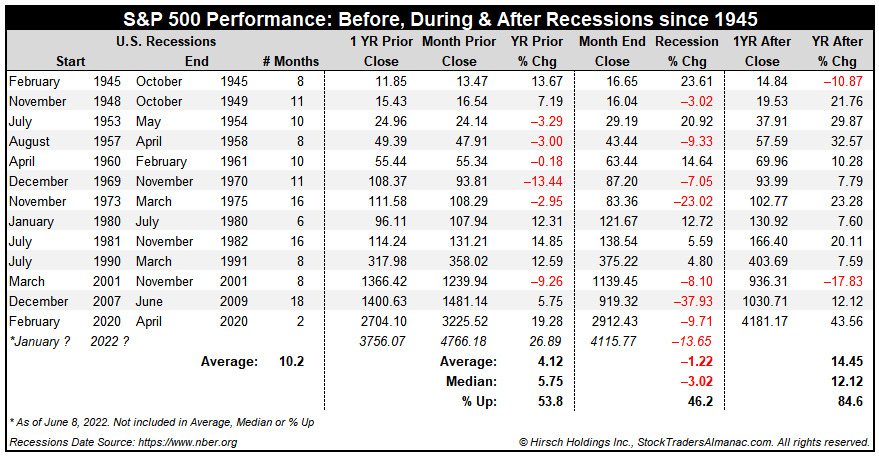
Dates for U.S recessions were sourced from the National Bureau of Economic Research (NBER). Since 1945, there have been 13 U.S. recessions. The most recent and shortest was the result of Covid-19 and began in February 2020 and ended two months later in April. The longest recession post WWII was caused by financial crisis in 2008-2009 and lasted 18 months. The average duration of a recession has been 10.2 months.
Historically, in the 12-month period (year) prior to the start of the recession, S&P 500 has been positive 53.8% of the time with an average gain of 4.12%. In the table above, the year before the recession began is calculated using monthly closes. For example the 1-year prior to the Covid-19 recession was calculated using the close from January 2019 through the close of January 2020. During recessions S&P 500 historically advanced 46.2% of the time but with an average loss of 1.22%. Once the recession ended S&P 500 generally tended to soar 14.45% on average higher over the next year with gains occurring 84.6% of the time.
If, and this is still a big “if,” we are currently in a recession, and it began in January of this year then it could also be around halfway over based upon the average recession duration of approximately 10 months. Projecting out further, then the end could also arrive sometime around October or November just in time for the “Sweet Spot” of the 4-Year Election Cycle to begin. Perhaps a recession is outright avoided and instead the market just completes a typical, volatile midterm year correction. The market is still navigating the “
Weak Spot” and we remain patient for a better risk/reward setup that will likely arrive in late Q3 or early Q4 this year.
Stock Portfolio Updates
Over the last four weeks since last update through yesterday’s close, S&P 500 advanced 4.6% while Russell 2000 jumped 10.1%. Over the same time period the entire stock portfolio climbed 1% higher, excluding dividends and any fees. A sizable cash position of approximately 74% of the total portfolio kept overall performance in check. This cash percentage is not a target allocation, it is the result of positions being closed as market volatility rose and positions began weakening.
Unlike recent updates, not a single position was stopped out in the last four weeks. The portfolio also has the fewest number of positions since the brief Covid-19 induced bear market of early 2020, two small-caps, one mid-cap and thirteen large-cap positions. Large-cap stocks performed the best, up 5% on average. Amdocs (DOX), DT Midstream (DTM) and Constellation Energy (CEG) are notable standouts each up over 11% since last update. AT&T (T) also receives an honorable mention, up 8.3% in four weeks and back into positive territory.
T's recent spinoff, Warner Brothers Discovery (WBD) has not fared well and is the only position in the portfolio currently in the red. A broad disinterest in growth stocks and a tightening streaming market are likely contributing to the weakness. Management changes are also apparently providing sufficient reason to keep selling pressure elevated. Trading volume does appear to be easing which could suggest a bottom in the near future.
All positions are on Hold. Please see the table below for updated stop losses and current advice for positions not covered above.