While the folks at the Fed convene their annual symposium this week at Jackson Lake Lodge in the Wyoming wilderness fishing for answers on the economy and its next policy moves Jeff reports in from the woods and beaches in Ogunquit, Maine. He did not come across any bears on the morning hike along the Ogunquit River, but the level of tourist activity here is suspiciously slow.
Maine’s popular southern coast is not dead, but the crowds are smaller, wait times at happening restaurants are short and beach parking spots are not too hard to come by. But the lobstah is still wicked good and the surfing is still consistently ridable. The scene up here this year is emblematic of the economic situation in the U.S. – tepid and slower than usual, but not collapsing.
The summer rally so far has been impressive, but we are not out of the woods yet. The major averages have stalled at their respective 200-day moving averages, a key technical level, and are now testing new short-term support around the June highs and the 50-day moving averages. Market internals are still not convincingly bullish. This week’s Down Friday/Down Monday with Monday’s loss the biggest since June is also a warning sign.
The second estimate of Q2 GDP was revised a little higher though still negative from –0.9% to –0.6%. Atlanta Fed’s GDPNow latest estimate for Q3 was a tad lower this week down to 1.4% from 1.6% last week and the high of 2.5% mid-month. Sentiment has also improved throughout the summer rally, but where the market moves next is really all about inflation and the Fed.
With history as our guide and current readings tame, we are inclined to heed the seasonal cautions that surround worst-month-of-the-year September and the Weak Spot of the 4-year cycle. We also still have the battles of the midterms, end of Q3 quarterly reshuffling pressures and October-phobia to contend with.
As you can see in our brand-new Stock Trader’s Almanac Aggregate Cycle index (STAAC) revealed earlier this month the seasonals and cycles point to a continued pullback into the end of September. STA Aggregate Cycle is a combination of the 1-Year Seasonal Pattern for All Years, the 4-Year Presidential Election Cycle and the Decennial Cycle. In the chart here STAAC is all years, midterm years and second years of decades post-WWII from 1946-2021.
Should the next readings on inflation not show continued abatement and should the Fed’s statements this week in Jackson Hole, over the next several weeks and in the next FOMC policy release be more hawkish than The Street has been pricing into the summer rally we could take out the June lows.
The more likely scenario from our vantage point is for a retest of the June lows with a slightly higher low at some point in September or October. Then we look for a new cyclical bull market to gather momentum in the Sweet Spot of the 4-year cycle from Q4 midterm year to Q2 pre-election year.
So, while we await to hear what the Fed has to say and see what they do with rates at the next FOMC meeting on September 21 (A meeting associated with a Summary of Economic Projections) and for the next inflation readings (CPI on September 13 and PPI September 14) we are going to stick to our system and seasonal strategy and wait for better bullish signals and the Sweet Spot of the 4-Year Cycle.
Pulse of the Market
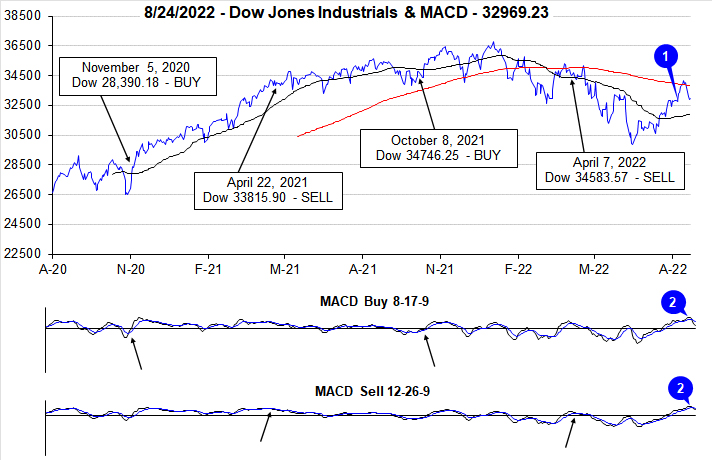
DJIA’s summer rally off the June lows continued into August. As of the close on August 24, DJIA was up 10.3% which is slightly above historical average performance since 1964 of 9.4%. During the rally, DJIA did briefly reclaim its key 200-day moving average (1) but failed to hold it as hope for a quick shift in Fed interest rate policy appeared to fade. Recent weakness is being confirmed by both the faster and slower MACD indicators applied to DJIA (2) flashing sell signal crossovers on August 22.
On Monday, DJIA’s worst daily decline since June completed its tenth Down Friday/Down Monday (DF/DM) of the year (3). Historically, DF/DM occurrences have occurred at inflection points and have traditionally signaled a reduction in confidence as traders become reluctant to carry positions over the weekend and perceive little reason to go long at the start of the new trading week. If DJIA can quickly recover its losses from Monday and Friday, then the odds of additional declines sometime during the next 90 calendar days also decline. However, should it fail, further weakness becomes increasingly likely.
DJIA (3), S&P 500 (4) and NASDAQ (5) did finish July with back-to-back weekly gains. S&P 500 and NASDAQ went on to extend their weekly winning streaks to four in a row, DJIA did not. Since the June lows, DJIA has advanced in five of the last nine weeks while S&P 500 and NASDAQ have risen in six of those weeks. These are solid streaks that have produced solid gains but there still appears to be an elevated amount of uncertainty confronting the market.
NYSE Weekly Advancers and Weekly Decliners (6) have been consistent with the market’s overall move higher and also suggest there was fairly broad participation in the rally with Advancers solidly outnumbering Decliners in positive weeks. This week’s weakness may produce a mixed reading that could be yet another reason to question the validity of the recent rally.
Despite the rebound off June’s lows, Weekly New Highs (7) have remained low. There has been some modest improvement but at just over 100 New Highs per week over the last three weeks it’s a grim reminder of just how far many stocks have fallen this year. Given the magnitude of the rally, the number of New Weekly Lows has retreated nicely and is currently at the lowest number of 2022. Until the market breaks one way or the other, both New Highs and New Lows are likely to remain relatively subdued.
The 90-day Treasury yield (8) has climbed to its highest level in August since January 2008 while the 30-year Treasury yield has eased from its mid-June peak at 3.38%. The higher near-term rate is consistent with the Fed’s inflation-fighting tightening of monetary policy while falling long-term rates would seem to suggest slipping growth potential and an eventual and meaningful decline in inflation. The partially inverted Treasury yield curve has also been a precursor to recession which is still apparently up for debate despite two consecutive quarters of negative U.S. GDP.
Click for larger graphic…