The jury is still out on whether October has killed another bear market. But with the Dow up 11.5% so far in October 2022, it is on pace to record its best October performance ever going back to 1901. While many analysts, technicians and pundits continue their deliberations we lean toward the case that we have entered a new bull market – at least for the near term. Sure, we have concerns and recognize the many headwinds the market faces, but perhaps this is the beginning of that proverbial “Wall of Worry” nascent bull markets climb.
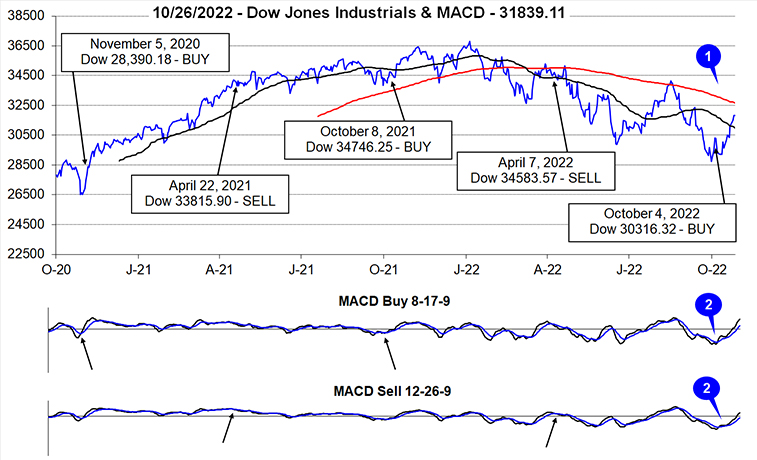
All year long our seasonal and cycle analysis combined with all the indicators we track got us out early and kept us out through the bulk of the bear market until earlier this month when we issued our Best Six Months Seasonal MACD Buy Signal on October 4. At the time we were concerned that the MACD trigger came a bit early on those first two strong days of October, but the market backed and filled over the next couple of weeks providing ample opportunities to establish the new long positions we put out.
What concerns us most is that the Fed will remain too aggressive too long like they were too accommodative and easy for too long. And then there is inflation. If inflation doesn’t begin to show signs of meaningfully retreating here in the U.S. soon that will force the Fed to get tighter and continue the rate hike cycle longer and it will hit Main Street, the economy, and Wall Street harder.
The last few CPI inflation readings topped expectations and disappointed the market. However, CPI has decelerated over the past three readings from a peak at 9.0% to 8.5%, 8.2% and 8.2%. Still painfully high for everyone but starting to ease. And the effects of the higher rates are only just beginning to have an impact on inflation.
We would not be surprised for the Fed to provide some pivot or pause language at their next FOMC meeting on November 2. After they announce another 75-basis point increase it is increasing likely they will telegraph smaller hikes at the next two meetings and then a pause. With everyone expecting inflation to remain stubbornly high the November 10 CPI is poised to surprise The Street with a continuation of the trend lower, which would positively impact the market. Of course, by that time the midterm elections will be over, and that uncertainty gone.
Anecdotally, Jeff was at an event last night at the New York Stock Exchange for Bob Pisani’s Shut Up and Keep Talking book launch. (It looks like a fun read, and it was great to chat with so many smart Wall Street folks.) But what struck him was this overwhelming bearish sentiment, almost nonchalant that no way is the bottom in and that we have not seen the despondent selling and despair associated with bear market lows. That’s when his contrary antennae start to purr. And besides, NASDAQ, the FAANG stocks and big tech have gotten creamed already this year.
On top of the seasonal and 4-year cycle bullishness we are encouraged by today’s positive GDP number, improving market internals, some developing technical support as well as a decent earnings season despite some big tech misses and disappointments. Perhaps it’s high time for some new market leadership and a new acronym to replace the FAANGs.
We are also encouraged by the Russell 2000. Technically all the other major U.S. indices took out their June lows. But the R2K held above it. Back in November 2021 the Russell 2000 was the first to top out then the first to reach bear market status and now during a historically weak spot for the small cap index, in October, it illustrated strength and looks like it found support around 1640 and has been rallying since. The Dow’s recent leadership is also encouraging.
For this rally to have real legs and materialize into a true cyclical bull market, we will need to see some combination of a change in trend in inflation, interest rates and/or the U.S. dollar. For now, the Best Six Months are upon us, and it looks like October has killed another midterm bear market, so we stick to the system, honor the buy limits and stops and keep a close eye on the indicators, the Fed and how the market reacts. We would not be surprised by another selloff either before yearend or early next year, though this time we expect a higher low.
Best Six-Month Period of All-Time Starts Now
We will leave you with this amazing statistic. We have been clamoring all year about the Sweet Spot of the 4-Year Cycle and how the midterm year is a bottom picker’s paradise and recently how the Best Six Months that begin in the midterm year are the best of the 4 years. We took it one step further.
We ran all the rolling six-month periods back to 1945 for DJIA and S&P 500 broken out into each of the 4 years of the cycle. As we suspected the data shows that the six-month period beginning in November of the midterm year has produced the best performance of them all. It is also worth noting that the Sweet Spot of the 4-year cycle from Q4 midterm year to Q2 pre-election contains all the top six-month periods.
Pulse of the Market
DJIA has lived up to its historical midterm October reputation thus far with only two full trading days remaining. Volatility has persisted throughout the month with historically sizable daily swings, but the cumulative result has been well above average gains by DJIA. As of the close on October 27, DJIA was up 11.5% for the month compared to its historical average gain of 2.6% in midterm Octobers since 1950. The current rally has lifted DJIA back above its 50-day moving average (1), but it will need to overcome resistance at its 200-day moving average for the rally to continue.
Back-to-back daily gains exceeding 2.5% on the first and second trading days of the month were sufficient to turn the faster and slower moving MACD indicators (2) positive when the market closed on October 4. With confirming MACD Buy indications from S&P 500 and NASDAQ we issued our annual Seasonal MACD Buy signal via email on that day. From their respective closes on October 4 through October 27 close, DJIA was up 5.7%, S&P 500 was up 0.4% while NASDAQ was down 3.4%. Collectively the trio is up an average of 0.9%.
DJIA’s most recent Down Friday/Down Monday (DF/DM) in early October (3) was the fourteenth of this year. That occurrence came at the end of a weekly losing streak where DJIA, S&P 500 (4) and NASDAQ (5) were all down in six out of seven weeks. A similar situation occurred back in June just prior to that month’s lows and an above average summer rally ensued. October’s DF/DM may have marked a significant turning point in sentiment and was possibly an early sign pointing to the end of the bear market.
NYSE Weekly Advancers and Weekly Decliners (6) have been consistent with the market’s overall moves. Weekly Decliners easily outnumbered Weekly Advancers during down weeks while the opposite was true in advancing weeks. Participation in last week’s (week ending October 21) advance was reasonably broad, but the ratio of Advancers to Decliners was less than 2 to 1. This hints that skepticism remains elevated, and buyers are being selective. Should the rally continue to gain momentum it would not be surprising to see it accelerate further as “fear of missing out” kicks in.
Weekly New Highs (7) have climbed back above 100 for the first time since August. New Weekly Lows have also been cut in half since the last week of September. This is also encouraging, but much more progress is still needed. Ideally a continuing trend of increasing New Weekly Highs and steadily declining New Weekly Lows is what fuels sustained rallies.
Treasury yields (8) continued to climber higher during the last four weeks. The 90-day Treasury rate has climbed to its highest level since October 2007. At the opposite end of the yield curve, the 30-year Treasury has climbed above 4% for the first time since July 2011. The brisk rise in rates this year is influencing the economy, most notably in the housing market where mortgage rates have risen to over 7%. However, most of the impact of higher rates does appear to be priced into the market already.