[Publication Note: Today’s Alert will be our last regularly scheduled Alert of 2022. Our next email will be on January 4, 2023. However, if market conditions warrant an interim update, one will be sent. Happy Holidays and Happy New Year!]
Last year at this time we were much more concerned and cautious than most of The Street as we anticipated heightened volatility during the midterm election when we made our
2022 Forecast for an Early Year High, a Worst Six Months Correction and a Q4 Rally.
After our
January Indicator Trifecta came in negative, we shifted more bearish. Even though our Santa Claus Rally delivered positive gains, the First Five Days Early Warning System and our full-month January Barometer were down. This deepened our cautious and bearish posture as we projected lower lows in the Worst Six Months May-October, while maintaining our expectation for a Q4 rally.
Then Russia invaded Ukraine, supply chain bottlenecks continued to mount, inflation heated up and the Fed began an aggressive tightening campaign. Most of the stock and ETF positions in our portfolios were stopped out by the time we issued our timely Best Six Months MACD Sell Signal on April 7. By June our
worst case scenario was in play.
We maintained a large cash position for much of the year and remained on the sidelines through Q3. In mid-August when most traders and pundits were jumping on the bull market bandwagon, we cautioned against the summer-rally hype and warned of another leg down as our
Stock Trader’s Almanac Aggregate Cycle pointed to a
mid-summer top and a retest of the June lows.
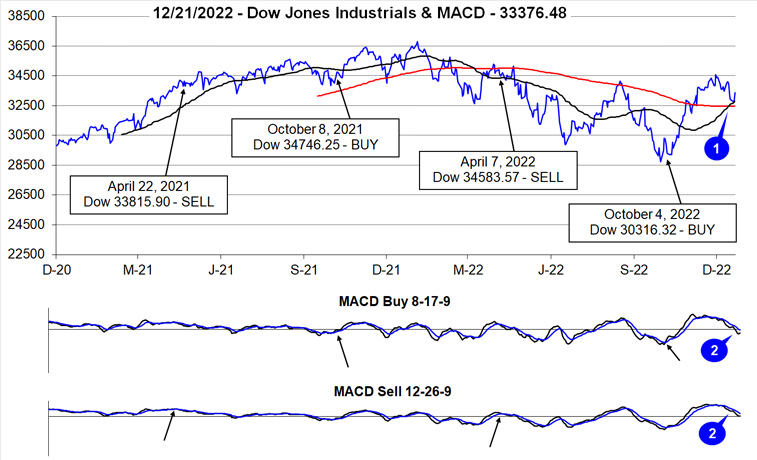
Midterm September and October delivered the volatility and selloff they often do, pushing the major averages to new bear market lows – except for the Russell 2000, which constructively held its June lows. Then on October 4th our Best Six Months MACD Seasonal Buy Signal was triggered and the Q4 Rally we had anticipated was underway.
NASDAQ is currently lagging and testing its lows, but as of today’s close the Dow is still up 15.0% for Q4. So now what? Well, unlike last year The Street is full of bears and that has our contrary antenna purring again. We logged a prototypical midterm year bear market here in 2022 and most everyone is calling for the bottom to fallout.
Current conditions remind us quite a bit of 1974 where we had a scattered bottom scenario. S&P and NASDAQ bottomed October 3 and the Dow hit its low on December 6. 2022 is a midterm year like 1974 and there is a steady flow of negative news and dire outlooks.
The chart here of the S&P 500 Seasonal Pattern for Pre-Election Years and our STA Aggregate Cycle first appeared on page 11 of the Stock Trader’s Almanac 2023. It depicts four rather bullish scenarios. All Pre-Election years since 1949 have an average gain of 16.8%. Pre-Election Years after a midterm bear market like 2022 average 20.3% and 1st Term President’s Pre-Election years average 20.1%. Our new Aggregate Cycle of the One-Year Seasonal Pattern, the 4-Year Presidential Election Cycle and the Decennial Cycle averages 12.3%. Despite current worrisome conditions, we believe a midterm bear market bottom is in and a new bull market is emerging. Remember Warrant Buffets wise words: “Be greedy when others are fearful.”
Sweet Spot of the 4-Year Cycle
As we have discussed for much of the year, we are currently sitting in the early stages of the Bullish Sweet Spot of the 4-Year Presidential Election Cycle, which runs from Q4 of the midterm year though Q2 of the pre-election. Over the 3-quarter span Dow averaged 19.3%, S&P 20.0% and NASDAQ 29.3%.
The current 4-year cycle has been more volatile than the average cycle, logging greater than average gains in post-election year 2021 and steeper declines, and a full-blown bear market, in 2022. Perhaps that will equate to outsized “Sweet Spot” gains this time around.
In any event, we are having a hard time swallowing all the doomsday scenarios we are hearing out there. With inflation decelerating, Q3 GDP revised higher to 3.2% from 2.9%, a steady employment picture and the Fed clearly telegraphing it will be done tightening in Q1, we are more inclined to look for a soft landing versus a full-blown catastrophic economic collapse with some positive surprises on the horizon.
Four Horsemen of the Economy
Let’s turn to our Four Horsemen of the Economy for some further perspective. Our lead horseman is the mighty Dow. While the bear market held sway over the market this year the historic blue-chip average was most resilient, losing less than its tech-laden brethren. And now DJIA is leading us higher, up 15.0% from its low. We contend S&P, NASDAQ, Russell 2000, and the broad market will follow suit.
Consumer Confidence collapsed this year as the bear gathered momentum. But it now appears to have bottomed. With inflation receding, GDP rising and retail sales doing just fine, it looks like the worst of consumers’ fears are behind us. Many of these ConCon lows have been associated with recessions in the past as you can see in the chart. We would not be surprised if the negative two quarters of GDP growth we had in Q1 and Q2 of 2022 end up appearing as a mild recession bar on this chart.
Inflation is falling and it may fall faster than most expect. Our 6-month exponential moving averages of the PPI and CPI show a steep drop in PPI. CPI will likely come down at a much slower pace, but it does appear to be rolling over.
Alas our most durable labor market. The unemployment rate will likely tick slightly higher moving forward off its historic low levels. But the labor market is likely forever changed from the pandemic with folks finding an endless array of ways to find gainful employment.
The Santa Claus Rally (created by Yale Hirsch in 1972) is scheduled to start tomorrow. This is our first indicator for the New Year. If the market does not rally over the 7-day period from the last 5 days of the year to the first 2 of the new year it will be cause for concern. To wit Yale’s famous line: “If Santa Claus Should Fail to Call, Bears May Come to Broad and Wall.” (Stock Trader’s Almanac 2023 p 118). But this is only part of our “January Indicator Trifecta.”
The results of the Santa Claus Rally along with the other two components of our “January Indicator Trifecta,” the first five days of January and the full month January Barometer (also created by Yale Hirsch in 1972) will help solidify our outlook for next year.
When all three are up the S&P 500 has been up 90.3% of the time, 28 of 31 years, with an average gain of 17.5%. When any of them are down the year’s results are reduced and when all three are down the S&P was down 3 of 8 years with an average loss of -3.6% with bear markets in 1969 (-11.4%), 2000 (-10.1%) and 2008 (-38.5%), flat years in 1956 (2.6%), 1978 (1.1%) and 2005 (3.0%). Down Trifecta’s were followed by gains in 1982 (14.8%) and 2016 (9.5%).
It has become increasingly apparent to us that the midterm year bear market is over, and we may have already experienced a mild recession. From our vantage point you can cut the bearishness on The Street with a knife. When the market was riding high last year all the big forecasts were for more gains. Now that we have our first double digit annual losses for the S&P since 2008, the big forecasts are for more downside.
Our cycles, indicators and readings of the market are leaning much more bullish. The Fed is almost done. Inflation is falling. China has relaxed its zero Covid-19 policy. With GDP revised higher we see the potential for the elusive soft landing and the usually bullish action associated with pre-election years – especially after the prototypical midterm year bear market we just had.
We will probably experience some early year choppiness. While it sure looks ugly out there, markets love to climb the proverbial “wall of worry.” We contend the worst is behind and a nascent bull is emerging.
Pulse of the Market
Typical first half of December weakness has persisted beyond mid-month this year. We continue to look for our Santa Claus Rally (SCR) which officially starts when the market opens for trading on December 23. Recent weakness could be setting up the SCR nicely this year. Despite recent weakness, DJIA’s Q4 rally has been solid this year with DJIA up 15.0% as of today’s close. DJIA’s Q4 advance has pulled its 50-day moving average back above its 200-day moving average creating a historically bullish golden cross (1). However, momentum has turned negative with bearish signals from both the slower and faster moving MACD indicators applied to DJIA (2).
At the start of this week DJIA logged its fifteenth Down Friday/Down Monday (DF/DM) of 2022 (3). Historically DF/DM occurrences have been associated with market inflection points that frequently were followed by additional weakness. On some occasions such as the DF/DM in early October, the market had already experienced a sizable decline and the DF/DM was followed by a reversal in market direction and solid gains. Today’s trading action is satisfying the near-term bearishness while it remains to be seen if this week’s DF/DM will trigger another rally.
DJIA (3), S&P 500 (4) and NASDAQ (5) are currently on track to record their third straight weekly loss. Tech-heavy NASDAQ has been the weakest throughout the year and during the recent weekly losing streak. Compared to other weekly losing streaks earlier this year, the current streak has been relatively less severe thus far suggesting that overall selling pressure could be getting exhausted.
NYSE Weekly Advancers and Weekly Decliners (6) have remained consistent with the market’s overall moves. Weekly Decliners easily outnumbered Weekly Advancers during down weeks while the opposite was true in advancing weeks. The spike in Weekly Decliners during the first full week of trading in December was likely due to tax-loss selling as this year has produced numerous candidates.
Weekly New Highs (7) did briefly bounce back after declining throughout all of November, but it was a short-lived bounce. Weekly New Lows have bearishly crept higher but have remained subdued when compared to their peaks earlier in the year. This appears consistent with a market looking for its footing and clearer signals as to where to go in the near-term.
Weekly CBOE Put/Call ratios (8) have been steadily trending higher reaching 0.93 last week. Historically elevated levels approaching 1.00 have been observed near significant market bottoms. However, the rising popularity of zero days to expiration (0DTE) options is impacting this once reasonably reliable indicator. High levels of bearish sentiment make for easy put option sales.
The 30-year Treasury bond yield is still below the 90-day Treasury yield (9) as the bond market appears to be increasingly pricing in the probability that the Fed will overtighten and possibly trigger a recession. Historically a recession was broadly defined as two quarters of decline in GDP. That definition was meet in the first half of this year.
2023 Forecast
Base Case: 65% Probability – Current trends remain intact. Inflation continues to moderate at current pace and Fed pauses rate hikes in Q1. No recession, but a marked slowdown in growth and a modest increase in unemployment. Supply chains slowly continue to improve with gains from loosening China Covid-19 policy being held in check by higher infection rates. Slightly below average pre-election year gains of 10-15%.
Best Case: 25% Probability – Loosening China Covid-19 protocols accelerate supply chain recovery. Ukraine and Russia conflict ends. Inflation rapidly retreats allowing Fed to ease to a neutral policy stance. Recession is avoided, growth picks up, and unemployment remains low. Above average pre-election-year gains of 15-20%.
Worst Case: 10% Probability – Inflation persists, and Fed forced to tighten beyond current expectations which triggers a full-blown recession that is accompanied by historically declines in economic growth and a spike in unemployment. Current rally ends up being a bear market bounce. Final bear market bottom arrives in first half of 2023 with late Q3-Q4 rally that returns major indexes to 0-5% at yearend.
We expect pre-election 2023 to deliver the usual gains with the return of a new bull market. And our May 2010 Super Boom Forecast when the Dow was around 10,000 for the Dow to reach 38,820 by the year 2025 is still on track. (Page 104, Stock Trader’s Almanac 2023.)
Happy Holidays & Happy New Year, we wish you all a healthy and prosperous 2023!