Jeff is reporting from Vermont. After his oldest son turned 18 and graduated high school, he dropped the younger guy off at Dartmouth rugby camp and headed across the Connecticut River past where the pavement ends in Sharon VT to a mod little house in the woods. Hiking the soaked forest trails of the Upper Valley along the rushing swollen streams provides a fresh perspective to reflect on our second half outlook.
It’s been a big week for the market and the world with the Russian rebellion sending the geopolitical pundits into a tizzy about the status of Putin’s reign and the war in Ukraine. It remains to be seen what happens with Prigozhin, Russia and Putin, and how it may impact the Russia-Ukraine War, if at all.
We kicked around an interesting internal theory we have not heard elsewhere that perhaps Prigozhin and the fleeting weekend revolt can serve as a scapegoat for Putin and Russia and can be used as cover and a face-saving excuse for an easy exit strategy out of Ukraine. However, it seems far more likely to us that the weekend’s events will only further solidify Putin’s power and harden his will and determination to continue fighting for outright victory. For now, the conflict and the uncertainty it creates persists.
At the midpoint of the year NASDAQ continues rushing like a rain-swollen summer stream. But the tech-laden index, as well as the rest of the market, are poised to roll down the other side of the mid-July peak into the market’s summer volume doldrums and the worst two months of the year August/September.
Our updated NASDAQ seasonal chart below comparing all years to pre-election years and our STA Aggregate cycle, which combines all years, the election cycle (pre-election years) and decennial cycle (third years) depicts how the market continues to closely track historical and seasonal patterns. So far in 2023 NASDAQ is following the trend of the pre-election pattern, but is way ahead, up 29.9% year-to-date!
As you know, June is the last month of NASDAQ’s Best 8 Months. But in case you missed it we issued our NASDAQ Best 8 Months MACD Seasonal Sell Signal on June 23. The sell signal appears to be rather timely this year. We may get a bit more upside as NASDAQ’s 12-day midyear rally from the last three days of June to the 9th trading day of July can carry stocks higher into July. Use any near-term upside to reposition for the Worst 4 Months July-October.
The three seasonal patterns below all show the likely path of the market is sideways over the next four months with a lot of chop and flop. We don’t expect much more than a few 5-10% pullbacks. As traders begin to take time off to enjoy the summer and congress goes into recess for the month of August, market trading volume tends to diminish into what we call the summer doldrums where stock prices drift, bobbing up and down until and unless some news event moves them one way or another. Then as the end of Q3 nears, institutional fund managers partake in their annual performance dance, restructuring portfolios and doing a little window dressing, which often results in a correction in August and/or September.
![[NASDAQ Pre-Election Year Seasonal Chart]](/UploadedImage/AIN_0723_20230629_NASDAQ_Seasonal_Pre-Election_STAAC_900.jpg)
The good news is that the “Sweet Spot” of the 4-Year Cycle has delivered. Gains over the best three quarters of the 4-Year Cycle from Q4 midterm year through Q2 pre-election year have been right in line with the historical averages. As of today’s close, Sweet Spot gains are 18.8% for DJIA, 22.6% for S&P and 28.5% for NASDAQ vs. 19.3%, 20.0% and 29.3% respectively on average from 1949-2022.
We just finished the 2024 Stock Trader’s Almanac page proofs, which will be off the press early this fall, and after 58 years of looking ahead 6-18 months for next year’s outlook, the strength of the 4-year cycle is clear and present. It is especially so this cycle as we have tracked the historical trend so closely. Here’s a sneak peek at the new edition. Many of you will recognize this chart – or a version of it.
Looking ahead to election year 2024 we are reminded of the power a sitting president running for reelection holds over the market. When a sitting president is running for reelection S&P 500 averages a gain 12.8% in election years since 1949. This is substantially better than when there is an open field with no sitting president in office running, culminating in a loss of -1.5% on average for the year. The market hates uncertainty and with a sitting president running there is a good chance market, economic and civic conditions will likely remain unchanged whereas with an open field there are a great deal of unknowns. 2024 has that power of incumbency going for it.
![[4-year cycle Line Chart]](/UploadedImage/AIN_0723_20230629_4-Year_Cycle_2023_Chart_900.jpg)
Analysis from other non-seasonal indicators supports our view that the market is likely to go nowhere for the next few months. Q1 GDP was revised higher, but at 2% it’s not blowing anybody away. Recession hawks out there remain vigilant, but with the economy and market plugging along we still don’t see it. Inflation continues to trend lower, yet it remains elevated. The Fed paused, but they remain hawkish and continue to threaten another ¼ point hike or two.
Blue chips rallied today on the major banks passing the stress test and Q1 GDP being revised upward. Small caps are finally participating in the rally, but have historically peaked versus large-caps in late-May to early June and tend to begin underperforming in July until sometime in the fourth quarter. NASDAQ and big tech appear to be on the ropes and running out of gas. Recent high bullish sentiment appears to have peaked and is heading lower ahead of the market’s weakest seasonal period.
Considering we have enjoyed this bull market rally since our Best Months Seasonal MACD Buy Signal back in October, sticking to the system, being patient and not chasing this rally remains the most prudent course of action. Fundamentals, technical analysis, sentiment, monetary policy and geopolitics tend to confirm our cautious stance for the next few months, while still anticipating new highs later this year and next.
So, enjoy your summer while collecting all those nice money market fund and bond interest payments we have not had for years, while we await the fatter pitch in the fall and the likely pre-election year Q4 rally to new recovery highs if not all-time. Wishing you all a happy summer on the sidelines. Enjoy!
Pulse of the Market
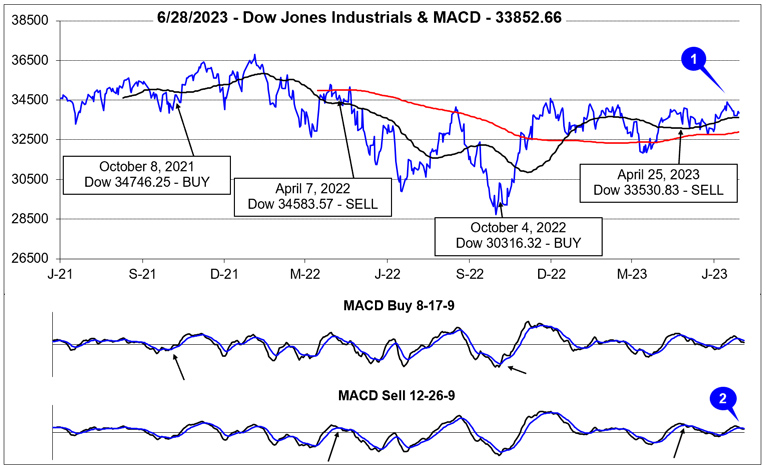
In stark contrast to NASDAQ, it has been a challenging year for DJIA as we near the end of the first half of 2023. As of today’s close (June 29), DJIA is up a mere 2.9% year-to-date. All of this meager gain and then some has been in June (+3.7%). DJIA’s meandering 2023 performance has kept it trapped in a narrow range between 32000 and 34500 (1). After a brief reversal in early June, both MACD indicators applied to DJIA are negative again (2) confirming its recent failed break out attempt and loss of momentum.
Following a nine straight week stretch free of any Down Friday/Down Monday (DF/DM) occurrences, DJIA has recorded three in the last six weeks and two back-to-back (3). Historically DF/DM occurrences have been around significant market inflection points that have frequently seen reversals in the prevailing trend at the time. The two most recent DF/DM’s have come at what is increasingly looking like the end of the spring rally. If DJIA fails to return to its highs of the year in timely manner, more weakness is likely especially after NASDAQ’s mid-year rally comes to an end.
With NASDAQ’s Best Months including May and June, it has enjoyed the best performance since the end of April (5). Until last week, NASDAQ had been up eight weeks straight. Tech-heavy S&P 500 also benefited, advancing in six (4) of the eight weeks that NASDAQ was up. As previously noted, DJIA has been the weakest this year and logged only five modest weekly gains during the same 8-week period. More choppy trading across all indexes is likely are some first half of July strength.
Market breadth had been making improvements in June up until around mid-month. Last week’s declines (during the historically weak week after June monthly and quarterly options expiration week) saw Weekly Advancers retreat to their lowest levels mid-March as decliners outnumbered advances (6) by over 2 to 1. Should the market find its footing look for a corresponding increase in Weekly Advancers.
Even though DJIA, S&P 500 and NASDAQ broke out to new 2023 highs in June, Weekly New Highs (7) did not. The peak in New Weekly Highs was 356 during the week ending February 3. Similarly, New Weekly Lows also failed to slip below earlier year minimum readings. This suggests leadership is growing increasingly thin which could result in a more meaningful pullback in the near term.
Since the start of June, the 90-day Treasury rate and the 30-year Treasury rate have declined modestly (8). Part of the decline could be the Fed’s pause and the other part could be the very early stages of the next rotation out of stocks in the advance of the “Worst Four Months.” Nonetheless, the Fed is signaling more increases are highly likely while the 90-day Treasury still has the highest yield since January 2001.