President Trump is shaking things up like never before. As promised Trump 2.0 has the put federal government, domestic politics and global affairs on their heels. His transactional, art-of-the-tariff tactics has the market on edge. But the reality is that the S&P 500 and NASDAQ 100 just hit new all-time highs last week. Yes, we have sold off since, but S&P is down just 4.6% at today’s close, but the intraday January 13 lows have held.
While the Trump administration may have the world on the run and stocks nervous at the moment, inflation is still the likely main driver of the market. That January low was triggered by inflation fears from a blowout jobs report. All eyes will be on tomorrow’s PCE inflation number. In addition to the tariffs and federal government overhaul, traders are also jittery over Nvidia and the mega cap techs. Some reality is hitting home that AI boom stocks are too rich. Rotation is healthy but for now folks are selling willy-nilly in the short term.
But it’s all about inflation. Expectations for tomorrow’s release are that headline PCE inflation rose 0.3% on a monthly basis for January and 2.5% on an annual basis. Core PCE is expected to come in the same on a monthly basis, but 2.6% annually, down from 2.8% in December. Anything more than that will likely spook stocks further. If we hit those numbers or come in lower that could put the low in for this selloff. That doesn't mean we are out of the woods though. We have warned that a 10% correction is possible this year, but perhaps not at this juncture.
We have updated our PCE Inflation Projection chart and as long as we stay at 0.3% or better on a monthly basis annual inflation is projected to trend down over the next five months. This will also keep the Fed on track for one or two rate cuts in the second half of the year. Tamer inflation will increase the likelihood of more cuts earlier. But for now, we don’t expect a cut before June.
Post-Election Years Plague Republicans
The fear on The Street is palpable and it’s hitting levels associated with interim lows and rebounds. We have warned all year that this type of chop and volatility is to be expected in post-election years, especially in Q1. With the S&P 500 dipping into the red for the year today, we turn to page 28 of the 2025 Stock Trader’s Almanac, “Post-Election Year Performance by Party.” Historically, more bear markets and negative market action have plagued Republican administrations in the post-election year whereas the midterm year has been worse for Democrats.
New republican administrations tend to come in and get down brass tacks more so than new democrats. This generates market uncertainty and Trump 2.0 has moved faster and further and covered more ground than any we can remember. Since 1985 post-election years have been the best year of the 4-year cycle with the S&P 500 averaging 18.1%, up 9, down 1. The third year, the pre-election year, ranks #2 up 16.4% on average, up 8, down 2. But as you can see on page 28 of the 2025 Almanac the market was down 5 years in a row under republican presidents in post-election years from 1953 to 1981.
So, in addition to updating the S&P 500 Post-Election Year Seasonal Pattern chart we have been tracking we have two addition analogs to examine. First note that at today’s close S&P fell into negative territory down -0.34% for the year. But that is right near the typical level for all post-election years at this point in the year as shown in the black line.
In the second chart we have added a line that is an average of those 5 down years in a row under republican presidents in post-election years from 1953 to 1981. Yes, it is rather disconcerting, but we want to be looking at the market with our eyes wide open as the headwinds continue to mount on several fronts.
In the last chart we have taken a two-year look at the three worst republican post-election years from page 28 of the 2025 Almanac: 1957, 1969, 1973. Election year 2024 had many similarities with election year 1968. The market trend was similar, notably the summer and December pullbacks. Both years had sitting Democratic presidents drop out of the race followed by republicans winning back the White House. The late 1960s had the Nifty-Fifty stocks and today we have the Mag 7.
The 1972-1973 pattern is also similar, while 1956-1957 is less so. But both were second term republicans with complex geopolitical and economic environments: Vietnam and the Cold War, turmoil in the Mideast, oil embargos and recessions. The current economy remains resilient and does not appear to be heading toward recession. These charts should help us identify a change in the health of the bull market. Should the market retreat further at this juncture that could bring the incumbent party loss and negative Republican Administration lines and our
Annual Forecast Worst Case scenario into play, which we gave a 10% probability.
If the market fails to recover soon, we may be in store for some old school weak Republican President post-election year performance. For now, the January 13 S&P 500 intraday low at 5773.31 has held. The market remains in an uptrend with major support at the 200-day moving average around 5734, which is still only a 6.7% correction. Hang tight, honor the stops and we look forward to going over the PCE numbers and the subsequent market action during the members’ webinar next Wednesday.
Pulse of the Market
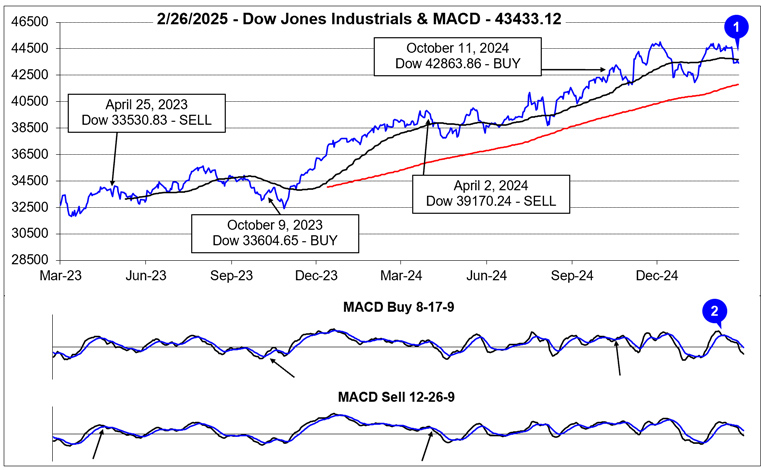
Market confidence has taken a hit here in the latter half of February, but for all the headline-driven concerns, DJIA has held up fairly well, slipping just below its 50-day moving average (1) over the past four trading sessions through February 26. After failing to break out to new all-time closing highs in early February, both the faster and slower moving MACD indicators applied to DJIA (2) confirmed the loss of bullish momentum by turning and heading lower. Gains in February would have been welcome, but it appears this February is turning out to not only be the weak link of the Best Months, but also in line with typical post-election year Q1 and February weakness. Bullishly, support at DJIA’s January lows and its 200-day moving average has held.
For all the chop and volatile swings, the market has endured thus far in 2025, DJIA remains positive year-to-date, up 2.1% as of its close on February 26. DJIA has logged one Down Friday/Down Monday (DF/DM) this year during the final week of January and the first trading day of February. Damage has been heavy on Fridays (DJIA down 6 of the last 8), but Mondays have been strong, DJIA up six of the last eight (3). Should the trend of strength on Mondays persist, it would not be surprising to see Fridays begin to improve which would be encouraging.
S&P 500 (4) and NASDAQ (5) have been modestly weaker in 2025 with each down a total of five weeks. S&P 500 slid into negative territory year-to-date today, down 0.34%. NASDAQ is now down 3.97%. A return to strength across all three indexes (and Russell 2000) would also be encouraging, but this may not happen until sometime later in March of even after Q1 ends.
Weekly market breadth has remained reasonably consistent with the major indexes’ ups and downs. With the exception of week ending February 7, Weekly Decliners have outnumbered Weekly Advancers during down weeks and last week’s sizable retreat also saw the greatest number of Weekly Decliners (6). A significant improvement in Weekly breadth metrics does not seem likely, while the new administration maintains a fast and furious pace of changes. Stability with a slow and moderate pace of change has historically been a better backdrop for market gains.
Absent a breakout or breakdown, Weekly New 52-week Highs and Lows (7) are also likely to continue to churn as the market chops along. No new clear trend has been successful in asserting itself this year. A handful of weeks with expanding New 52-Week Highs associated with a corresponding decrease in New Lows, would be positive and potentially indicate the resumption of the bull market.
Short-term interest rates have hovered around 4.20% since the Fed’s last cut in December. Recent inflation metrics have remained stubbornly elevated, but economic activity does appear to be softening, which has allowed the 30-year Treasury bond yield (8) (and 10-year Treasury not shown) to retreat. Tomorrow’s Personal Consumption Expenditures (PCE) has the potential to move rates in a meaningful manner. Any reading hotter than expected could easily send interest rates higher once again.