The midyear rally got off to an early start this week. De-escalation in the Middle East following the U.S. strikes on the Iranian nuclear infrastructure has reduced geopolitical risk. The fragile ceasefire in the Israel-Iran conflict appears to be holding. By no means do we assume that the threat of turmoil is over in the Mideast. If left unchecked, it is highly likely Iran will quietly try to reconstruct its nuclear capabilities. All eyes will be on this nascent ceasefire, activity from other factions, more detailed and conclusive intelligence reports on the damage, Iran’s stance on inspections, diplomatic progress, and a lasting resolution on Gaza.
But from what we can ascertain from some friends on the ground and other anecdotal observations there is real optimism in the region that longer term things are changing for the better. People are beginning to return to normal routines in Tehran and Tel Aviv. Commercial air traffic has resumed. No missiles have been fired into Israel since the ceasefire. Much still needs to be solidified in the region, but the market’s continued positive momentum suggests peaceful resolution is in the air.
Tariff and trade war fears have also subsided as inflation continues to moderate, and GDP is expected to rebound in Q2 after retracting in Q1. Other key global economies also continue to show resilient growth. Despite criticism from both MAGA stalwarts and Democrats the Trump administration appears to be on a run of successes. After the decisive strikes and U.S. brokered ceasefire President Trump was also able to persuade NATO members to push up their defense spending at the summit this week. But will this recent success translate into quick tariff solutions and the passing of his One Big Beautiful Bill? Remains to be determined.
As the fog of overlapping risks seems to be lifting, for the short term at least, the market is poised to hit new all-time highs. In fact, the NASDAQ 100 Index has closed at new highs the past two days. S&P 500 and the NASDAQ Composite traded at new highs intraday today and closed within a hair of them. As you can see from the S&P 500 Post-Election Year Seasonal Pattern chart below, the midyear rally we have been expecting looks like it’s in full force. However, the historically weak seasonality of August and September looms large on this chart as well. Should this weak seasonal period coincide with any setbacks on tariffs or the Big Beautiful Bill or the ceasefire and Mideast diplomacy efforts or other geopolitical hotspots the usual Q3 seasonal pullback could be steeper.
Look for Pullback After Down April Up May & June
With two trading days left in June S&P 500 is up 3.9% month-to-date. This follows a tumultuous month for the market that ended with April in the red. We have tabulated all the years since 1950 when the S&P was down in April but up in both May and June. All but one of these eight years, 2024, suffered a loss in either July, Q3 or Q4. And you will remember last year’s 10% S&P correction from July 16 to August 7. 1986 and 1987 both suffered losses over the last six months of the year, but unlike 2025 both had huge Q1 gains and were up substantially at midyear, whereas 2025 is still flat with S&P up 4.4% year-to-date. This bodes well for the rest of 2025 with more new highs into July followed by a likely pullback in the August/September timeframe and then a Q4 rally.
NASDAQ Best 8 Months MACD Sell Update
As of the close today, June 26, NASDAQ’s Seasonal MACD indicator was still negative, but it will turn positive on Friday, June 27 as long as NASDAQ does not decline 131.20 points (–0.65%) or more. It has been negative since May 30. The criteria we use to issue our NASDAQ Seasonal MACD sell is a new negative crossover of MACD (using 12-26-9 parameters) on or after the first trading day in June. Because NASDAQ’s MACD indicator was negative at the start of June, it still needs to turn positive first. Continue to hold associated positions in QQQ and IWM.
When NASDAQ’s Seasonal MACD registers a new negative crossover, we will send an email to all active members. At that time, we will finish repositioning our Portfolios for the “Worst Months.” We do anticipate adding to existing bond ETF and cash holdings in the Tactical Seasonal Switching Strategy portfolio and will also consider adding additional positions in the stock portfolio.
With the market clearly pushing to break out to new all-time highs, technicals are looking rather solid while fundamentals remain mixed though with rays of hope. A new all-time high for NASDAQ 100 is pulling NASDAQ Composite and S&P 500 back up near new highs. DJIA, S&P 500, and NASDAQ are all positive YTD. Russell 2000 is still lagging but rallying strong off the April lows. The Midyear rally started a few days early but appears to be working well.
Inflation is still cooling, but the Fed appears fearful of making another cut too soon. Geopolitical risk is improving with the Israel-Iran shooting war over for now or at least paused but the nascent ceasefire is still tentative, and we still have the war in Ukraine and tension in the Pacific rim. Ride the rally for now, but beware the Q3 seasonal weakness and heed the NASDAQ seasonal sell signal when it triggers and reposition to a more cautious stance.
Pulse of the Market
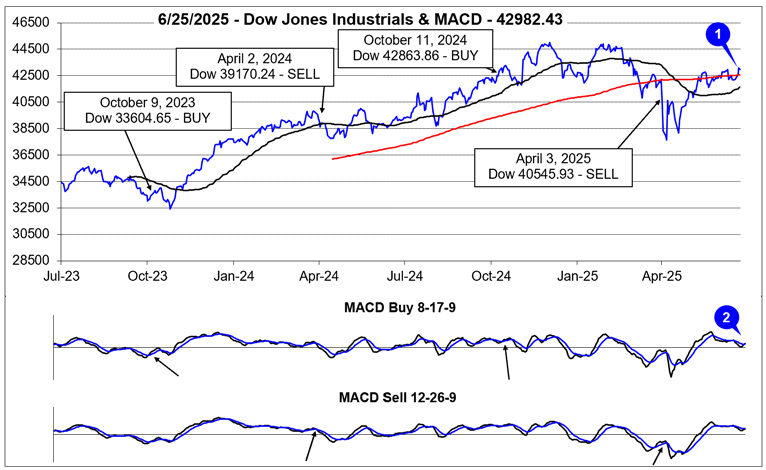
Until this week, DJIA had been treading water around its 200-day moving average. DJIA now appears to be making a decisive move higher as it participates in NASDAQ’s midyear rally (1). DJIA’s 50-day moving average is also climbing and trending back towards a traditionally bullish golden cross. A golden cross occurs when the 50-day moving average crosses back above the 200-day moving average. The return of positive momentum is being confirmed by DJIA’s faster moving MACD Buy indicator turning positive (2) on June 25. Today’s gains also turned DJIA’s slower moving MACD positive.
Daily volatility and chop have retreated significantly since early April, but the market’s weekly performance is still reflecting elevated uncertainty. Over the past 20 weeks, DJIA, S&P 500, and NASDAQ have not recorded a weekly winning streak of three or more weeks. DJIA last logged three positive weeks in a row in January of this year. For S&P 500 and NASDAQ you have to go back to November/December of last year. Provided this week’s gains hold through the close on Friday, DJIA (3) and NASDAQ (5) will be up three of the last four weeks while S&P 500 (4) will have one less advancing week.
Weekly market breadth (6) had shifted somewhat bearishly over the last two weeks through June 20 with Weekly Decliners outnumbering Weekly Advancers. Based upon gains thus far, weekly breadth will likely favor the bulls once again this week. As the indexes approach record highs, it would be encouraging to see Weekly Advancers continue to increase. This would increase the odds that the breakout would hold.
Weekly New 52-week Highs (7) remain stuck under 200. Here again it would be a plus if Weekly Highs could also steadily expand. When the broad market does reach record levels again, New Highs should be growing quickly, if not, further upside could be limited. New 52-week Lows have remained at low levels. Lower would be better, but at least the current rally has been lifting most stocks.
After a single week above 5%, the 30-year Treasury bond yield (8) has been slowly retreating. Modestly lower Treasury yields are providing some support to the stock market and likely reflect recently released modestly softer inflation, employment, and growth data. As long as yields drift sideways to lower the market is likely to continue to climb higher. A brisk reversal in yields would likely have the opposite effect.