October volatility has spooked many investors and may have spooked many of you. But as Almanac Investors you know this is prototypical market behavior this time of year. This Octoberhobia as we called it is precisely what sets up Q4 market magic rallies and the best three months of the year (November-January). And why we still expect a monster Q4 rally and S&P 7100 by yearend.
Next year is a different story entirely and you can read about it in our preliminary 2026 Outlook on pages 10-11 of the new 2026 Stock Trader’s Almanac, if you have not already. Most of you should have your complimentary copy by now (please let us know if you have not received it). Overseas Almanacs are still shipping. For now, we are bullish on the market’s prospects for the next several months and we are poised to break out to new highs shortly.
So, what’s really going on right now? There is a lot of headline volatility, bubble chatter, meme stock and hot stock action keeping traders and investors on edge. We hear lots of calls and discussions about “the top” across a multitude of social and mainstream media platforms and outlets as well as in our personal and professional circles. But we all know that bull markets end when everyone least expects it and bear markets get triggered by some external shock.
And what drives a bear market? Earnings, right? Stocks may look expensive, but the bulk of the market keeps reporting good numbers. Sure, there are some misses, but overall earnings and revenue of market leading companies continue to grow. The federal government may be officially shutdown while the politicians in congress jockey for position, but as far as we can tell the business of this country continues to power ahead. History shows that the market does just fine during and after these shutdown battles.
If the 10-year Treasury yield is any indication, and we believe it is, the recent dips below 4% are further evidence that rates are coming down and they appear to be coming down in an orderly fashion, not in response to some economic emergency. Mortgage rates fell to a 2025 low today which should give the housing market a boost. Lower rates increase stock buybacks, boost earnings and stock prices. Tax cuts and deregulation also continue to stimulate the economy and an influx of foreign investment in the U.S. doesn’t hurt. A quick look at the
CME FedWatch Tool shows a >90% probability of half point cut by yearend, we expect two quarter-point cuts at the next two FOMC meetings
Now let’s turn to the world stage. Despite the naysayers and doubters, the ceasefire in Gaza is holding and the current calm in the Mideast is bullish for stocks. The Russia/Ukraine war is another story and there does not appear to be much hope for ending that conflict anytime soon, but that is old news. Then there is China and the trade war and the recent rare earth dustup.
China is a one of the U.S.’s fiercest competitors; economically, diplomatically and geopolitically. China is a communist dictatorship that keeps extremely tight control over everything, including and especially rare earths. China’s latest directive on rare earths isn’t a new policy it’s another shot across Trumps bow in the trade war. The October 9 memo from the Ministry of Commerce just memorialized long standing policy. Beijing has treated rare earths as a national security asset since at least the 2010 export restriction episode with Japan. So, the memo that they will hold rare earths even tighter, is not a new stance, it’s just Xi playing hardball to cover for China’s deflating economy and other woes. The rest of the world is tiring of China’s strong-arm tactics.
“Best” Worst Six Months: Monster Q4 Rally, S&P 7100 Still in Play
Despite all the talk of spooky October market action, headline volatility and the bears coming out of the woodwork the S&P sold off a whopping 3.16% from the intraday high on 10/9 to the low on 10/10 and bounced right off the 50 DMA as illustrated in the candlestick chart of the S&P over the past six months. As of today’s close, S&P is up 0.7% for the month of October and heading into one of the most bullish short-term trades of the year.
We have also updated the S&P 500 Post-Election Year Seasonal Pattern chart, and the index remains on track with the most bullish post-election year pattern, the green “since 1985” line. Our Best-Case Scenario for a 20% gain for the S&P 500 remains in play. The Q4 Monster Rally is about to commence, and S&P 7100 is in our sights.
While we may be slightly off the new all-time highs reached two weeks ago this continues to be the “best” Worst Six Months since 1950. With six trading days left this May-October WSM is now up 21.0% at today’s close. As you can see from the updated table this bodes well for Q4, the full year and the next Best Six Months November-April.
Typical Octoberphobia struck again but the pullback has proven rather tame, shaving a mere 3.16% off S&P intraday two weeks ago. And now, as is clear from the updated Typical October chart, the market has likely turned higher to rally through month end and yearend.
Halloween Trade and Bitcoin Buy
This brings us to a couple of trades for you. One of the most bullish short-term stretches on the calendar are the last several trading days of October through the first few days of November, specifically the last 4 days of October plus the first 3 days of November. The “Halloween Trade.” Over this 7-day period Dow, S&P and NASDAQ are up 80.6% of the time since 1994 with average gains of 1.9% for Dow and S&P and 2.3% for NASDAQ. Russell 2000 is up 77.4% of the time with an average gain of 2.3%,
![[Halloween Trade Bar Chart]](/UploadedImage/AIN_1125_20251023_Halloween_Trade_900.jpg)
Finally, after getting stopped out of our iShares Bitcoin Trust ETF (IBIT), we are recommending buying IBIT again for the Q4 Rally with a Buy Limit at todays close of 62.56. No initial stop loss. It will be added to the portfolio at tomorrow’s average price (day’s high, plus low divided by 2) if it trades below 62.56 at anytime during the day. If it does not trade below 62.56 tomorrow, we will keep the buy recommendation live at the 62.56 buy limit and will add it at that price if it trades at or below that price until the next update.
So, ignore the headlines and bears and put your rally caps on for what promises to be a solid upside move over the next several months. The Best Three Months of the year are about to begin, the Q4 Monster Rally is lurking and the Santa Claus Rally is coming soon.
Pulse of the Market
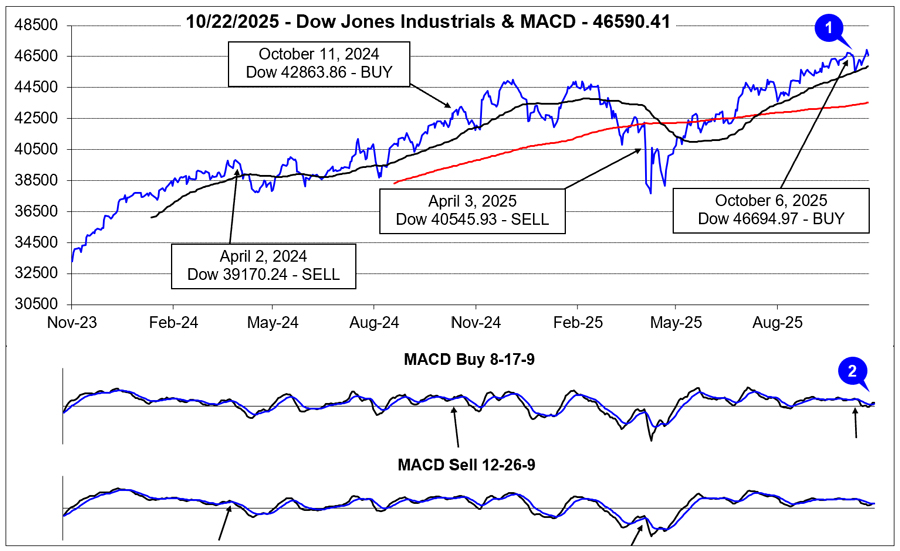
After kicking off October with new all-time closing highs, Octoberphobia struck with vengeance on October 10. DJIA dropped 1.9% that day and closed under its 50-day moving average (1). The catalyst was the threat of additional, steep tariffs on imports from China shortly after the communist dictatorship formally announced it was tightening its controls on exports of rare earth minerals. However, DJIA quickly recovered, erasing all of its declines and closed at a new all-time high earlier this week.
DJIA’s brisk retreat was exactly the “headline volatility” we mentioned
when the Seasonal MACD Buy signal triggered on the close on October 6th. Since then, the faster and slowing moving MACD indicators applied to DJIA briefly turned negative but are now both positive (2). In the near term, headline driven market volatility remains a headwind, but DJIA and the market still appear on course for a solid Q4 rally. Buying weakness while awaiting the end of the federal government shutdown, Fed interest rate cuts, and more trade deals can still be considered.
At first glance, the Pulse of the Market table contains quite a bit of red. This volatility has likely kept many on edge (and on the sidelines). Instead of focusing on that, note the gains that have occurred over the last 20 weeks. DJIA is up 8.0% from its June 6, close through last Friday (3). S&P 500 has climbed 11.1% (4) and NASDAQ has advanced a whopping 16.1% (5). Choppy week-to-week performance is likely to persist throughout the remainder of the year right along with further gains and new all-time highs.
Over the last four full weeks, market breadth has been seesawing with the major indexes (6). NYSE Weekly Advancers have outnumbered Weekly Decliners during positive weeks and vice-a-versa during negative weeks. Nothing unusual there. What would be of potential concern would be another week like week ending September 19th where NYSE Weekly Decliners outnumbered Weekly Advancers as the following week was down.
New 52-week Highs and Lows (7) are giving off mixed signals. Their respective trends have been choppy over the last four weeks, and the net result has been fewer New 52-week Highs and more New Lows. Some of the choppiness is likely the result of rotation due to the start of a new quarter. Another source could be just the retreat in the major indexes after closing at new all-time highs earlier this month. Ideally, we would like to see the number of New Highs steadily expanding while New Lows declined and/or stabilized around a low level.
Short-term and long-term Treasury bond yields continue to trend lower (8). Historically, lower interest rates have been positive for consumers and stocks. Interest rates may have also finally retreated sufficiently to revive the housing market with mortgage rates falling to the lowest level in about a year.
Click for larger graphic…