We head into February on solid footing. Markets shrugged off a disappointing earnings release and call from Microsoft and rallied off the morning lows with the Dow and Russell 2000 closing in the green, S&P off fractionally and NASDAQ clawing back a good chunk of the early losses. With one day left our January Barometer remains on track for a positive reading, supporting the bullish outlook we laid out in our
annual forecast.
Recent volatility generated mostly by President Trump’s Greenland/EU tariff gambit has raised awareness for “The December Low Indicator” that has been featured in the Stock Trader’s Almanac for years (STA 2026 page 36). Originated by Lucien Hooper, a Forbes columnist and Wall Street analyst back in the 1970s, the December Low Indicator is based on the Dow closing below its December Closing Low in the first quarter of the New Year. DJIA’s December closing low was 47289.33 on 12/1/2025.
Several of our esteemed colleagues, most notably, the venerable Larry McMillan in his excellent Option Strategist newsletter, have expressed concern that if the S&P 500 breaks below its December closing low of 6721.43 on 12/17/2025, it would be a bearish indication. So, we ran the numbers, and lo and behold, what really matters most is our January Barometer, at least statistically.
January Barometer Rules
This December Low Indicator study is based entirely on the S&P 500 data instead of using the Dow as we have in the Almanac based on Hooper’s original work. We used S&P 500 December Closing Low data along with our January Barometer stats. In the table below we have broken out the 35 years since 1950 when S&P 500 closed below its previous December’s closing low into the 27 years that the January Barometer was down and the 8 years it was higher.
Years when the S&P 500’s December Low Indicator was breached and the January Barometer was down, were weaker years, down 14 of the 27 years or 51.8% of the time with an average loss of -3.07%. On the other hand, when January Barometer was up and the December Low was crossed, the years were stronger. While only 50% of these years were up there are only two double-digit losses and the average gain was 4.76%. Additionally, these 8 years experienced smaller corrections of -10.15% from the cross to the low versus -14.49% for the 27 years the January Barometer was down and the December low was crossed.
But when it comes down to it the January Barometer is all that really matters with these New Year indicators. As we pointed out two weeks ago in “
January Barometer 101: Why It Works,” January is the perfect combination of indicative power, early warning and significant time frame. The Santa Claus Rally and First Five Days are early and helpful but short time frames that are more prone to being impacted by exogenous events. The December Low Indicator is useful as well but can come as late as March 31, which is well into the year.
When our S&P 500 January Barometer is positive the full year is up 41 of 46 years or 89.1% of the time for an average gain of 16.95%, the next 11 months are up 87.0% of the time for an average gain of 12.24%. When it’s down, the year is up only 50% of the time with an average loss of -1.75% and the next 11 months are up 60% of the time with a paltry average gain of 2.07%.
February Break
February is the weak link in the “Best Six Months” from November to April (STA 2026 pages 52 and 54) and the market often takes a breather in February. February tends to follow the current trend, though big gains in January often correct or consolidate in the second month of the year as Wall Street reevaluates and adjusts market outlooks based on January performance and earnings season.
When the S&P 500 gains 2% or more in January, February has corrected or consolidated with gains of 1% or less or losses 66.67% of the time. When January is down, February has followed lower 60% of the time and when January is up, February has followed higher 63% of the time.
As we noted in last week’s
February Almanac, February usually starts out strong but fades out in the middle part of the month after Presidents’ Day. Any weakness can be used to establish new long positions or add to existing positions as the market tends to resume its rally toward the end of the month or the beginning of March and continues to run until the end of the Best Six Months in April.
DJIA Historic 9-Month Winning Streak
If DJIA can hold its 2.1% gain for this January with one more trading day left, DJIA’s current monthly winning streak will reach 9 in a row. Since 1901, this would be just the 7th time that DJIA has been positive in nine consecutive months. Reviewing the previous 6 times DJIA was up 9 months in a row, we see performance holding strong 1-month later, with 5 gains and a single loss with an average gain of 3.17%. Two months later, average performance improved even further to +5.34% and frequency of gains climbed to 100%.
However, positive momentum faded by the 3- and 6-month later marks as average performance dripped to +4.83% 3-months after, a modest retreat from the 2-month mark. 6-month performance remains positive, but there were two declines. Historical performance suggests the current “Best Months” are likely to see further upside from current levels followed by some typical Q2-Q3 midterm weakness during the traditionally poorest performing two-quarter span of the 4-year cycle. This “Weak Spot” of the 4-Year Presidential Election cycle is then followed by the “Sweet Spot,” the best 3 consecutive quarter span.
S&P 500 Tracking Bullish 6th Year of Presidency
As you can see from the updated S&P 500 Midterm Election Year Seasonal Pattern chart the market is tracking the bullish base case scenario, we gave a 70% probability to in our 2026 Forecast that was published 7 weeks ago on December 11. Unless the market tanks tomorrow and the January Barometer turns negative, our outlook for 8-12% for 2026 will remain intact.
The president’s political party usually loses House and Senate seats during the midterm elections, driven by the inherent let down from unmet campaign promises. Considering the razor-thin majority the Republicans currently have, the odds of his party losing control of Congress are high. As most two-term presidents do, we expect President Trump to continue to do everything in his power solidify his legacy before the midterm elections. These efforts should keep the country moving on a positive economic trajectory, which is likely to push the market higher.
While there are some troubling events transpiring domestically and geopolitically, if you tune out the noise you can see that the underlying bullish foundation is solid. Economic growth remains resilient. AI spending and productivity gains continue to fuel growth. And the Fed’s interest rate policy remains stable. Inflation appears to be contained enough to not raise rates and the employment situation, which folks were getting worried about, has stabilized enough to justify holding rates steady. Bottom line the market prefers rate stability. So, don’t be alarmed if the market takes a breather in February. Use any weakness to add to longs. The macro backdrop of the AI Super Boom, the 6th year of the presidency, economic and corporate data and market action suggest the trend remains bullish.
Pulse of the Market
Given the hit taken by Microsoft (MSFT) today, DJIA showed resilience today by gaining a modest 0.11%. With a single trading session left in January, DJIA is currently up 2.10% year-to-date and on the verge of extending its monthly winning streak to an impressive nine straight. Although a relatively rare occurrence since 1901, historically DJIA has continued to log solid gains during the following two months of previous nine-month winning streaks.
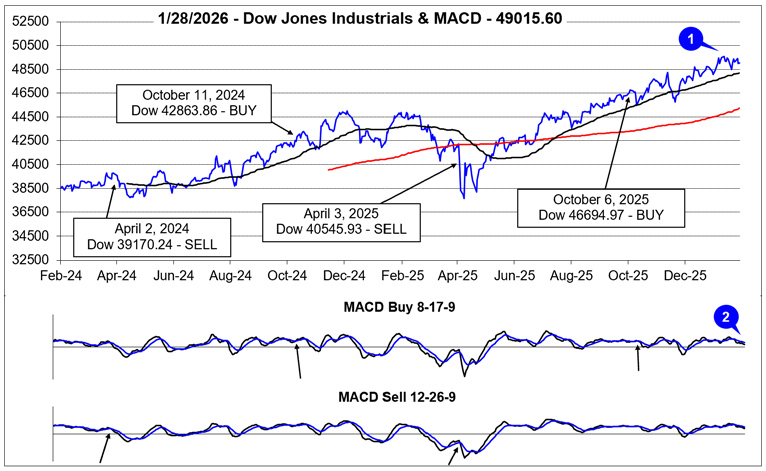
DJIA’s monthly winning streak lifted it to new all-time closing highs in December and January (1) with the most recent taking place on January 12. DJIA has since surrendered some of its gains but remains less than 2% below its all-time closing high. DJIA’s fading positive momentum is confirmed by both the faster and slower MACD indicators (2). The faster moving MACD turned negative on January 14 and the slower MACD followed suit on January 20. However, it currently appears that DJIA is just consolidating recent gains and barring any external shock it will likely resume climbing higher through the remainder of its “Best Months.”
Over the past two months DJIA has logged three Down Friday/Down Monday (DF/DM) occurrences. The most recent was completed on Tuesday after Martin Luther King Jr. holiday closing (3). Despite the three DF/DM’s, DJIA has powered ahead, gaining over 600 points. This appears to suggest a healthy amount of skepticism exists which can support additional upside. DJIA’s “dips” have been bought.
Although DJIA, S&P 500 (4) and NASDAQ (5) have declined in three of the last four weeks, all three are up more than 1.8% this month as of the January 29 close. For our January Barometer, which is based upon the S&P 500, this is a welcome, encouraging sign, especially with just a single trading day remaining in January. We plan to send an email Issue after the close on January 30 with the January Barometer’s final result.
Market breadth has remained somewhat choppy over the past two months but generally positive and consistent with the overall market direction. For the week ending January 16, Weekly Advancers did solidly outnumber Weekly Decliners (6) even as the major indexes dipped slightly. That week stands out as proof that the broader market was/is participating in the rally. The rising tide has been lifting more “ships,” most notably small caps.
Another positive and bullish indication is the number of new 52-week Highs (6) hit a high of 481 during the week ending January 16. This is the greatest number of new weekly highs since November 2024. It is also a sign that the market’s rally is broadening. Weekly Highs did ease modestly last week but Weekly Lows remained subdued below 100. We would anticipate more Weekly Highs once the market’s rally resumes.
Compared to mid-December levels, short-term and long-term Treasury bond yields have moved modestly higher (8). However, the “Sell America” trade does not appear to be substantiated by the magnitude of the move or its orderly movement. Compared to levels from one year ago, the 90-day Treasury interest rate is 0.63 points lower (3.59% now versus 4.22%), and the 30-year Treasury bond interest rate is just 0.02 points higher (4.86% now versus 4.84%). The Fed cutting its lending rate is responsible for the decline in the 90-day Treasury rate while firming economic growth expectations are more likely responsible for the tiny increase in the 30-year rate than foreign Treasury bond holders selling.