Over the past several weeks, the market has continued to grapple with heightened geopolitical tensions, elevated oil prices, and shifting economic dynamics. While indexes have retreated meaningfully from recent highs and made new lows today, the magnitude of the pullback remains relatively contained compared to prior geopolitical and oil shock periods. As we enter the final days of March, several technical, seasonal, and historical indicators converge.
The market finds itself at a seasonal crossroads: April is the end of the Best Six Months and the beginning of the Weak Spot of the 4-Year Cycle during midterm year Q2-Q3, but the new Trump-presidency annual cycle is also in play. The Iran conflict-induced volatility which triggered a rare March December Low Indicator (DLI) have knocked this rich market down. But our sense is that President Trump will do everything in his power to wrap this Iran operation up in the next several weeks, setting up another a potential spring low.
Trump Presidency Seasonal Cycle Pattern: Q1 Shock. Q2-Q4 Awe.
We have added the pattern of the five Trump presidency years — 2017, 2018, 2019, 2020, 2025 —to our S&P Midterm Election Year Seasonal Pattern Chart below. President Trump seems to have a penchant for creating turbulence when he is in The White House early in the year, that has tended to trace out a double bottom in late March and early April, then a sustained rally into year-end. We saw it during the tariff-driven decline last year, and the current pattern is tracking that blueprint remarkably closely.
Compared to the other midterm year seasonal patterns on this chart, 2026 market action so far could give you pause. What’s going on with Iran and oil prices is troubling. But perhaps there is something to this Trump-year cycle and it’s pulling all the usual midterm year weakness forward and concentrating it here in March.
Crisis Markets and December Low Indicator
Both the S&P and the Dow breached their December lows during the Iran selloff, officially
triggering the December Low Indicator (DLI). While the indicator appropriately calls for caution, the historical nuance matters: March DLI triggers are rare, and when combined with an up January Barometer—as we have this year—they’ve tended to result in shallower subsequent declines and better full-year outcomes than January or February triggers. In fact, the three previous March triggers averaged an additional drawdown of just –8.12%
In the chart below of the 30 trading days before and the 60 trading days after DJIA closed below its December closing low we have split the previous DJIA December low crossings into four groups along with 2026 through yesterday’s close (March 25) for comparison. The best performance was observed by the years that had the positive January Barometer. Years with greater than a 10% decline after the cross had the weakest performance. It appears the quicker DJIA recovers after crossing below its December low, the better its performance was. Even with today’s decline DJIA is above Friday’s low. Against that historical backdrop, current technical levels warrant close attention.
![[Before & After December Low Chart]](/UploadedImage/AIN_0426_20260326_DJIA_Dec_Low_b4-after_chart.jpg)
We have also updated the Before & After Crises chart and while today’s decline brings S&P 500 to a new crisis low, it is still only down 5.8% from the February 27 close before the conflict began and 7.2% from its all-time high on January 27. When analyzing and evaluating these seasonal charts and historical analogs the trend matters far more than magnitude or level.
Testing Technical Levels
Looking at the three technical charts below of DJIA, S&P 500 and NASDAQ are cause for concern though. DJIA is testing the 45,000–46,000 zone that represents the confluence of the December 2024 and January 2025 highs, and the October–November 2025 support lows. If the market fails to hold these levels the next major support level would be near 42,000, which lines up with the December 2024-January 2025 lows. At today’s close DJIA is down 6.2% from the start of the conflict and 9.2% from its all-time high.
S&P 500 is testing its support at 6500 and closed below it today. The next major support level we have highlighted on the chart is 6200 at last August’s low. However, S&P could find support above that in the 6350-6400 area. At today’s close S&P 500 is down 5.8% from the start of the conflict and 7.2% from its all-time high.
NASDAQ support near its November closing low around 22,000 has been taken out this past week. We added blue-dotted lines highlighting some additional support in the 20500-21500 area, which NASDAQ dipped into today. Support at the December 2024 lows and February 2025 highs around 20,200 looms below there. At today’s close NASDAQ is down 5.6% from the start of the conflict and 10.7% from its all-time high.
Prepare for End of Best Six Months
April is the last month of the Best Six Months for DJIA and S&P 500. As of today’s close, all four positions in the Tactical Switching Strategy portfolio are in the red. As a reminder, positions in the Tactical Switching Strategy portfolio are intended to be held until we issue corresponding Seasonal MACD Sell Signals on/after April 1 for DJIA and S&P 500 and on/after June 1 for NASDAQ and Russell 2000. For this reason, there are no stop losses associated with these positions. QQQ and IWM are a Buy at current levels up to their respective Buy Limits. DIA and SPY are on Hold. (Disclosure note: Officers of Hirsch Holdings Inc held positions in DIA, IWM, QQQ, and SPY in personal accounts.)
The criteria for issuing our Seasonal Best Six Months MACD Sell Signal is:
1. A new sell signal crossover using our 12-26-9 MACD indicator AND
2. The crossover must occur on or after the first trading day of April AND
3. DJIA and S&P 500 MACD indicators must all agree.
Continue to hold, “Best Months” positions. When all of the above criteria have been met, we will send a Special Email Alert.
Patience With Nervous Market.
Contrary sentiment has not reached capitulation levels. Absent panic selling, the market still seems to be holding out for a swift resolution — one that would certainly be welcome. VIX remains in that nervous 20-30 range and there are still more bulls than bears in Investors Intelligence Advisors % readings, but the market’s patience with this conflict is wearing thin. This is probably not the bottom or end yet. If some sort of deal or cessation of hostilities is not reached in the coming weeks it may be a cruel summer for the market. But while the outlook in the media may sound grim and market volatility is elevated the trend of 2026 on our two before and after comparisons and the Trump-year seasonal cycle are encouraging. Honor the stops and stick to the system.
Pulse of the Market
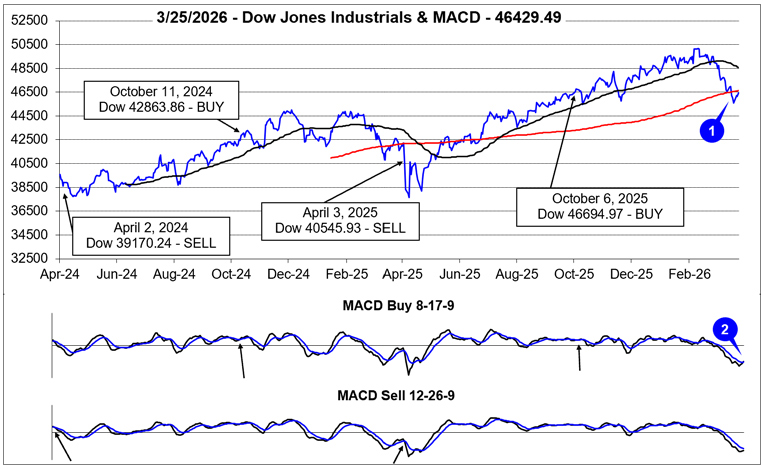
DJIA’s February all-time closing high above 50,000 is just a distant memory now and its monthly winning streak most likely will end at 10 months barring a strong rally during the final trading days of this month. As of the close on March 25, DJIA was down 5.2% in March. DJIA fell below its 50-day moving average on the last trading day of February and then broke below its 200-day moving average just after the Ides of March (1). Although support around the 200-day has fallen, support around 45,000 has held. This is encouraging in the near term.
Throughout DJIA’s March pullback, both the faster and slower moving MACD indicators continued to trend lower (2) until yesterday, March 25. Gains earlier this week by DJIA have turned the faster moving MACD “Buy” indicator positive. Additional gains are needed for the slower moving MACD to confirm. Such a confirmation would be an encouraging sign as signals below the zero line have generally been more reliable buy indications/confirmations. However, whether not or this positive signal holds will likely depend on the path of the Iran war.
February ended and March began with DJIA suffering its second Down Friday/Down Monday (DF/DM) occurrence (page 78 STA 2026) of 2026 (3). Historically DF/DM occurrences have frequently been infliction points for the market that have historically exhibited a bearish bias. This recent DF/DM has fulfilled that bearish tendency with three straight weekly DJIA declines following. Somewhat encouraging is traders and investors may be reluctant to hold long positions over the weekend, but they have been buying on Mondays. This would appear to suggest that their greatest concerns are not happening over the weekend.
Prior to the start of war with Iran, the market was already struggling with high valuations, private credit concerns and persistent inflation. Add on surging crude oil price and DJIA and S&P 500 (4) have declined in nine of the last twelve weeks while NASDAQ (5) has retreated in ten weeks. The last time the market suffered a similar streak of weekly declines was from April to early July 2022. The 2022 streak was followed by a strong bounce higher in July and the first half of August. A similar bounce is not out of the question, especially if a ceasefire and negotiations were to begin with Iran. Whether or not this happens remains to be seen.
Market breadth over the last four weeks has been heavily negative with Weekly Decliners solidly outnumbering Weekly Advancers (6). One potential positive development is the number of Weekly Decliners did fall last week (week ending March 20). This could suggest broad indiscriminate selling is in retreat and traders and investors may be beginning to be more selective. This could be any early sign of a market bottom, at least in the near term. Further improvement in the number of Weekly Advancers this week and beyond would be welcome confirmation.
New 52-week Highs and Lows are in line with expectations giving the market’s current state. After hitting a high of 653 in mid-February, New Highs briskly retreated while New Lows have nearly doubled (7). The jump in New Lows has been relatively orderly. The apparent absence of panic selling thus far would suggest that some optimism for a timely resolution to the Iran war still exists. A quick resolution would certainly be welcome.
Since briefly after the start of the Iran war, short-term and long-term Treasury bond yields have been trending modestly higher (8). The increase is likely a reflection of growing inflation concerns and additional federal spending on war further contributing to an already ballooning fiscal deficit and total federal debt. The modest increase in rates is already putting pressure on the fragile housing sector and the Fed. Neither of which are beneficial to the market.
Spring Break with Jeff!
Last chance to join me on the beach at The 2026 MoneyShow Masters Symposium Hollywood Florida which will run from April 9-11 at the exclusive Diplomat Beach Resort. Over three days at the oceanfront venue, you’ll learn about the greatest investing and trading opportunities in 2026 – from dozens of the nation’s leading financial experts.
Here are my two sessions at the Expo on Thursday, April 9, 2026:
Should you Sell in May in the Midterm Election Year 2026?
Stock Panel: The NEW Leaders: A Case for Small Caps, Out-of-Favor Sectors, and “Forgotten” Stocks