As we close out June and head into the second half of the year, get ready for Christmas in July. After selling off on the Iran war and rallying sharply in line with the Trump Seasonal Cycle Pattern (TACO Trade), the market is settling into more historically typical Worst Months and Midterm Year Q2-Q3 Weak Spot behavior.
June delivered on the usual seasonal weakness setting up for a rather typical midyear rally led by NASDAQ. This 12-day rally from the last three trading days of June through the first nine trading days of July is what we refer to as Christmas in July.
Since 1985, NASDAQ has gained an average of 2.5% during this 12-trading-day period, with a median advance of 2.9%. The rally has produced gains in 32 of the last 41 years, a success rate of 78%. While not every year has been positive, the historical tendency has been remarkably resilient across a wide variety of market environments, including bull markets, bear markets, recessions, and recoveries.
Several of the strongest advances occurred during periods of heightened uncertainty. NASDAQ surged 10.4% during the 1999 midyear rally, climbed 10.0% in 2000, and gained 9.6% in 2016. More recently, the rally posted gains of 4.7% in 2020, 4.1% in 2023, and 3.8% in 2024. Last year’s rally generated a respectable 3.3% advance.
The pattern is likely driven by a combination of quarter-end portfolio adjustments, the start of a new quarter, fresh capital inflows, and generally favorable investor and trader sentiment heading into earnings season. Whatever the underlying cause, the tendency has proven durable over four decades.
Negative outcomes have occurred nine times since 1985, reminding traders and investors that market conditions and unexpected events can overwhelm seasonal patterns. Nevertheless, with a long-term track record of success and a solid average gain, NASDAQ’s 12-Day Midyear Rally remains a compelling seasonal opportunity.
Awaiting NASDAQ Best 8 Months MACD Sell
NASDAQ’s Midyear Rally should also provide us with an excellent opportunity for our NASDAQ Best 8 Months MACD Seasonal Sell Signal. NASDAQ’s Seasonal MACD indicator entered June in negative territory (red arrow in the chart below). It remains negative as of today’s close. Because our sell signal requires a new negative crossover (using 12-26-9 parameters) on or after the first trading day in June, the indicator must first turn positive before it can trigger. Currently NASDAQ would need to gain at least 2361.46 points (9.31%) in a single day to turn its MACD positive.
![[NASDAQ Technical Chart]](/UploadedImage/AIN_0726_20260625_MACD_NASDAQ_900.jpg)
We have talked about the April 8 ceasefire gap as an area that might get filled down around 22500, but that seems less likely now and would take some especially negative developments on the world stage or systemically in the market. However, a summer correction to 24000 or little above that is not out of the question. The dotted line in the chart represents some strong support at the October 2025 and January 2026 highs. There is also another gap on April 16/17 just above 24000 when Trump announced the Israel-Lebanon ceasefire that is more likely to get filled should a summer correction ensue.
When NASDAQ’s Seasonal Sell signal criteria are satisfied, we will send an email to all members. At that time, we will finish repositioning the Portfolios for the “Worst Months.” We still anticipate adding to some or possibly all of the existing bond ETFs and cash holdings in the Tactical Seasonal Switching Strategy portfolio.
NASDAQ Midterm & Trump Cycle Seasonal Pattern
With tech stocks and the end of NASDAQ’s Best 8 Months in focus we have created the chart below of NASDAQ Seasonal Patterns for Midterm Years and Trump Presidency Years. As illustrated by the red 6th Year of Presidency and the blue All Midterm Election Years lines, NASDAQ’s “Weak Spot” tends to get hit harder than DJIA and S&P 500. June’s selloff has also brought 2026 back in line with the green Trump Presidency Years and black All Years lines.
Bullishness ahead of the July 4th Independence Day holiday and the 250th Anniversary celebratory vibe should help propel the market higher into mid-July once end-of-Q2 and mid-year rotation and rebalancing abate. Whether we reach new highs or not, we expect ample opportunity for our NASDAQ MACD Sell Signal to materialize and to finalize repositioning for the “Worst Months” and be in prime position for the best three quarters of the 4-year cycle from Q4 midterm year to Q2 pre-election year.
The seasonal set up points to a rebound in the first half of July, but after that, the market is prone to selloff from a host of risks. Inflation is sticky and the data is a mess. Today’s PCE ran hot with core at 3.1% and headline hitting 4.1%, the hottest since October 2023. That’s not a print that gives the Fed cover to ease. So, rates are likely to stay where they are and guidance from the new Warsh Fed is likely to stay vague. Any hint of a more hawkish shift could send the market into another correction.
Energy is the wild card. The Iran ceasefire is an agreement to talk, not a resolution. If the 60-day clock runs out, and the can gets kicked down the road again, it would only take one escalation to send crude vertical. Energy prices, especially at the pump, go up like a rocket and come down like a feather. Any setback during the summer driving season could knock the market down. With all the government and AI capex spending even if energy prices come down, inflation may prove to be stickier than the market has hoped for.
We’re in the Weak Spot now and July begins NASDAQ’s Worst 4 Months. Midterm summers are for patience, not heroics. Don’t fight it. Be prepared to use NASDAQ’s Midyear Rally to take some profits and get positioned for a better buying opportunity in late-summer or early fall.
(Disclosure note: Officers of Hirsch Holdings Inc hold positions in EFAV, EFV, IBB, IDV, IWM, QQQ, SGOV, TLT, XBI, XLP, XLU and XLV in personal accounts.)
Pulse of the Market
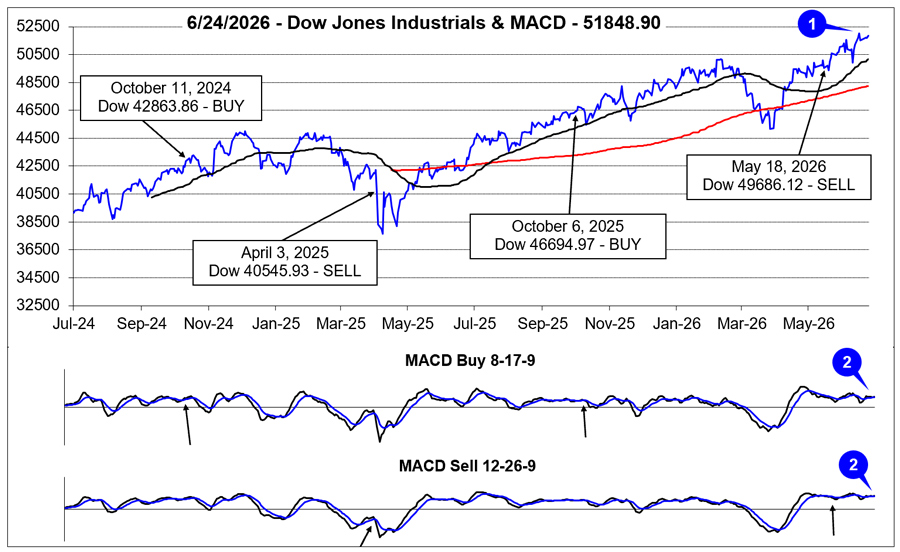
Following a brief pullback in the first half of June, DJIA briskly rebounded to new all-time closing highs (1) just 0.33 points below 52,000. As of DJIA’s close today, it is up 1.74% in June, substantially better than S&P 500 and NASDAQ that are down –2.94% and –5.98% respectively. DJIA also remains solidly above its 50- and 200-day moving averages.
However, DJIA’s rebound has not yet given new life to faster and slower moving MACD indicators. Both the MACD “Buy” and “Sell” indicators have continued to seesaw between positive and negative (2). In the past when MACD was above the zero line and chopping sideways, DJIA also chopped higher, but ultimately a meaningful pullback did transpire to push MACD back below the zero line. In the second half of July, when seasonal forces typically switch from tailwinds to headwinds, DJIA could be susceptible to a modest pullback.
During DJIA’s early June pullback, it triggered its fifth Down Friday/Down Monday (DF/DM) warning (3) (page 78 STA 2026) of 2026. Like some recent DF/DM occurrences, DJIA was able to quickly reclaim its losses and even climb to new all-time closing highs. Since the late-March market bottom, DJIA has largely ignored the historical negative implications of a DF/DM. At some point, DJIA may not be so resilient especially if the DF/DM occurs in traditionally weak August and/or September.
After extending its weekly winning streak to nine straight, S&P 500 (4) strength ended abruptly during the first week of trading in June when it declined –2.6%. NASDAQ (5) was down nearly twice as much (–4.7%) the same week. Absent a period of consolidation or another pullback, the major indexes could struggle to repeat their respective strong spring runs during the summer, especially after mid-July.
Weekly market breadth data was generally in line with the index’s weekly performance until last week (ending June 19, 2026), when DJIA, S&P 500, and NASDAQ all advanced, but Weekly NYSE Decliners outnumbered Weekly NYSE Advancers (6). Last week’s lack of broad participation likely foreshadowed some of this week’s mixed and choppy trading. With DJIA trading around all-time highs and NASDAQ still looking for firm footing, this week’s market breadth is also likely to be mixed.
Despite DJIA, S&P 500, and NASDAQ all closing at new all-time highs in June, New 52-week Highs have remained subdued (7). One potentially positive development is New 52-week Lows have declined for two weeks in a row. For the market to embark on a broad, sustained rally, additional New 52-week Highs and fewer New 52-week Lows are most likely needed.
Over the last five weeks, the 90-day Treasury bond yield (8) has ticked modestly higher as inflation metrics have heated up and the Fed appears to be contemplating interest rate hikes. However, that trend could be nearing an inflection point as falling crude oil prices could soon begin pushing inflation expectations lower. The retreat in the 30-year Treasury bond yield back under 5% would suggest the bond market has already begun lowering its expectations for inflation.
Click for larger graphic…