This year’s mid-year rally came fast and furious. Most of NASDAQ’s Midyear Christmas in July Rally came on the last two trading days of June, gaining 3.6% over the two days after being down the first day of the rally. Stocks meandered for the next two weeks, gaining little ground though ticking a hair higher on July 10 before rolling over this week. For the full 12 days of the mid-year move NASDAQ was up 3.0% in line with the historical average.
NASDAQ’s Best 8 Months MACD Seasonal sell signal that triggered July 17 wasn’t perfect but looks like it may turn out to be rather timely as stocks continue to sell off this week, especially techs. Welcome to the summer selloff. We warned you about this last issue.
A convergence of geopolitical conflict, surging crude prices, and an overextended AI tech trade is colliding with rising interest rates to amplify the market’s traditional seasonal headwinds. 4-Year Cycle Midterm forces also appear to be reasserting themselves as hostilities between the U.S. and Iran heat up. This has driven energy prices and interest rates higher and stock prices lower.
It now looks like the Midterm Weak Spot Pattern is overtaking the Trump Presidency Years Cycle. When we identified the Trump Presidency Seasonal Cycle back in March, the usual midterm year Q2-Q3 Weak Spot got pulled forward into Q1 by the Iran War — in classic Trump Q1 shock-cycle fashion. Then the ceasefire rally drove the market to new highs.
Note the red 6th Year of Presidency (the second midterm year of a two-term president) and blue All Midterm Election Years lines. The pink 2026 line is trending lower after mid-year in a similar fashion. Our concern is that with the AI tech trade stretched, hostilities ramped up in the Mideast, the weakest two-month stretch (August/September) and the midterm elections just around the corner, the market is likely to be weaker over the next few months into September or October. If we continue to track the Midterm Years and 6th Years of Presidency, we should be primed to kick off the Sweet Spot of the 4-Year Cycle with a solid Q4 rally.
![[Trump August]](/UploadedImage/AIN_0826_20260723_Trump_August_900.jpg)
In the chart above we have pulled out August Market Performance just during Trump presidency years and his previous midterm year, 2018. Much better overall performance, but nothing new, really. Typical August trend with greater weakness the first half of August, much stronger second half. President Trump’s actions can knock the market down and he can just as quickly reverse course for another “TACO Trade.” However, it does seem like it is getting harder and harder for the administration to pause, end or resolve the Iran mess in some reasonable manner in short order. The chart is encouraging, but it does not seem likely to repeat this year given the headwinds that exist now.
![[DJIA technical chart]](/UploadedImage/AIN_0826_20260723_DJIA_Technical_900.jpg)
DJIA logged its sixth Down Friday/Down Monday (DF/DM) of 2026 earlier this week, and according to research in Stock Trader’s Almanac (page 78, 2026 edition), this is a market signal worth watching. When the Monday close was breached (as it was today, black arrow), subsequent performance was considerably weaker. Monday’s market action initially suggested that investors were willing to step back in and buy the dip, but that failed.
Was Turnaround Tuesday’s rally merely one of those typical short-term bounces that have historically followed many DF/DM signals? The bigger question is whether the market can bounce off today’s lows or breaks near-term support. Should DJIA break below its 50-day moving average (blue line) around 51400, the area in the yellow band between 49500 and 50000 is the next level of support. Just below that there is support around 48800 where the April 16/17 Israel-Lebanon ceasefire gap and the red 200-day moving average line converge.
If NASDAQ breaks below today’s lows near 25000 it is likely to fall to the next support level in the yellow band between 24000-24250, where the October 2025 highs, January 2026 highs, the Israel-Lebanon ceasefire gap and the red 200 DMA line converge.
S&P 500 has formed a symmetrical triangle off the June highs. The direction of this neutral continuation pattern is usually decided when it breaks out one way or another. It was on the brink of resolving lower at the close today. A break lower would first test the 7250-7300 level near the June lows and the early May gap before challenging the 7000-7100 level in the yellow band above the January 2026 highs and around the April 16/17 gap.
However, we do suspect this ends up being a typical summer correction to the near-term support levels in the charts. A 7%-8% move to S&P 7000-7100 would be an ordinary correction. It would also be the first one this market has had to digest such a correction since the March lows and the subsequent big rally to new all-time highs.
The 10-year yield hit a new 52-week high today. Odds are the Fed will not change interest rates at its meeting next week. But if crude prices remain elevated the market may force the Fed to raise rates. So, sit tight and ride out the summer midterm year Q3 correction, a fatter pitch is coming. We should be in a good position to jump into the Sweet Spot of the 4-Year Cycle with a solid Q4 rally by October.
Pulse of the Market
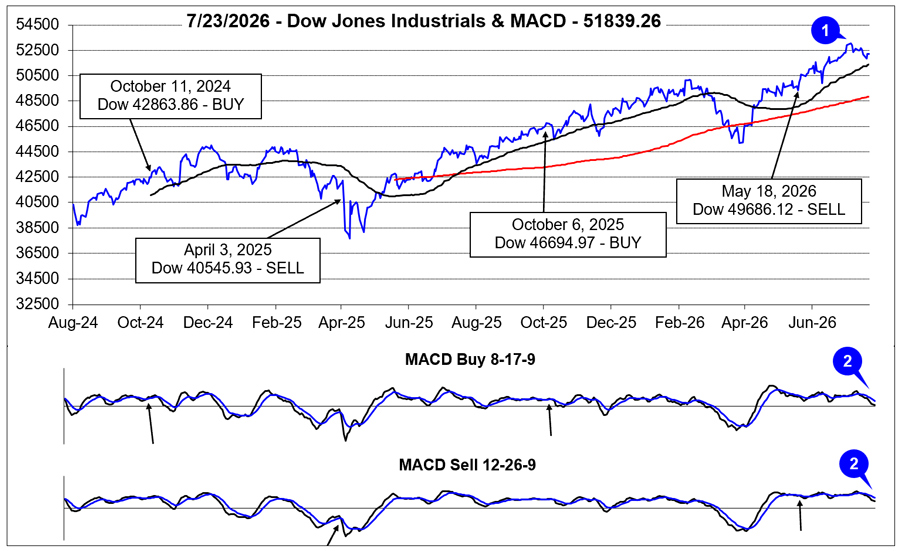
During this year’s mid-year rally, DJIA asserted its leadership by climbing to new all-time highs (1) that ultimately culminated on July 6 just above 53,000. S&P 500 and NASDAQ also participated in the mid-year rally, but they did not climb to new highs. As we noted in the July 2026 Outlook, second-half July weakness did materialize somewhat earlier this year in the form of choppy sideways trading shortly after the Independence Day holiday.
DJIA’s fading momentum after closing at new all-time highs in early July has been confirmed by both the faster and slower moving MACD indicators (2). Both MACD indicators turned negative on July 9, and have remained so since. Additional sideways-to-lower trading is likely as the worst two months of the year, August and September, are just around the corner. However, any meaningful pullback would likely push MACD indicators below the zero line, where buy signals tend to be the most reliable, setting them up for DJIA Seasonal MACD Buy signal sometime on or after October 1 and the official beginning of the Sweet Spot of the 4-year cycle (page 46 STA 2026).
Market headwinds strengthened further earlier this week when DJIA completed its sixth Down Friday/Down Monday (DF/DM) warning (3) (page 78, STA 2026) of 2026. After shedding over 700 points on Friday and Monday combined, DJIA did enjoy a rally on “Turnaround Tuesday.” But with DJIA closing below its Monday close, today, its odds of a quick recovery and renewed strength have fallen.
Previously mentioned second half of July weakness also arrived early for S&P 500 (4) and NASDAQ (5) with both recording a loss last week. Even with those losses last week, S&P 500 was up in 13 of last 16 weeks and NASDAQ was positive in 12 weeks since the end of March. Such strength would suggest some period of consolidation is not out of the question and it could be accelerating now.
Over the last five weeks, market breadth (6) has not been encouraging. In four of the five weeks, it was not as expected. There were two negative weeks where Weekly Advancers outnumbered Weekly Decliners and two positive weeks where Decliners outpaced Advancers. On the surface this would appear to suggest that a limited number of stocks continue to pull the broader indexes along with them. A deeper dive appears to suggest a seesaw battle of rotation where neither side can maintain the advantage for long. Regardless, mixed weekly breadth is consistent with consolidation, chop, and volatility. If weekly decliners take the lead and hold onto it, a more meaningful pullback is possible.
Looking at New 52-week Highs and Lows (7), we see a continuation of the mixed theme. New 52-week Highs have effectively done nothing since late April when they first broke above 300 while New 52-week Lows also remain range bound. Considering the market’s gain since late April, the relatively stagnant number of New 52-week Lows is not unusual or unexpected. The lack of expansion in new 52-week Highs, however, could be cause for some concern as it could mean the rally never really broadened out.
Renewed hostilities in the Mideast have and still are pushing crude oil higher which is pushing inflation expectations and Treasury bond yields higher. The 90-day Treasury bond yield (8) has reached its highest level since last November, just before the Fed cut rates in December. The 30-year Treasury bond yield has also moved to its highest level since May. Consumers and the stock market can likely tolerate modestly higher interest rates for a relatively brief time period but are likely to struggle if the trend remains higher for longer.
Click for larger graphic…