|
2016 Forecast: Tepid Gains Expected Last Year of 2-Term President
|
|
By:
Jeffrey A. Hirsch & Christopher Mistal
|
December 17, 2015
|
|
|
|
Publication Note: The Free Lunch Menu of bargain stocks will be served via Almanac Investor Email Alert prior to the market’s open on December 21st. Tuesday, December 22nd will be our last regularly scheduled Alert of 2015. Our next email will be on January 5, 2016. However, if market conditions warrant an interim update, one will be sent. Happy Holidays and Happy New Year!
All year long we have been tracking the divergent pattern of the 7th year of a 2-term president in the chart below in this space, illustrating how 2015 has been tracking the weaker track of the 7th year of the president’s term instead of the higher trajectory of the pre-election year, or 3rd year of the term, pattern. As of the close today the S&P 500 is back in the red.
Our good friend
Dan Turov, who publishes the stellar
Turov on Timing service, took an excellent poll on Tuesday. He asked all his subscribers of which we are one, “
On Wednesday, I believe the stock market will advance/decline in response to the Federal Reserve’s raising/not-raising interest rates.” We responded that we believed that the market would advance in response to the Fed’s raising rates.
Despite the market’s positive reaction yesterday to the Fed’s first rate increase in nine and half years after seven years at zero, volatility is still with us. Today’s 1.5% drubbing may be disconcerting, but this is not out of the ordinary following a big up day on
FOMC announcement days. While for much of this year we had not been expecting the first Fed rate hike until 2016, recently it became apparent that it was going occur at yesterday’s meeting.
As time is running out 2015 is on pace to be the first losing pre-election year for the DJIA since war-torn 1939 when Germany invaded Poland. If 2015 ends in the red, that would not be a great sign. 1939 was the seventh year of FDR’s Presidency, his second pre-election. The S&P 500 was down 5% in 1939 and as WWII broke out in Europe the stock market was down double digits the next two years.
So Santa Claus better get his act down to Wall Street stat. For as you all know from our missives early this week and over the past two months and page 114 of the 2016 Almanac, “If Santa Claus should fail to call, bears may come to Broad and Wall!” (Yale Hirsch defined the Santa Claus Rally, in 1972, as a seven-trading-day period that spans the last 5 trading days of the year and the first two of the New Year.)
2015 Forecast Recap
Before we reveal our outlook for 2016 let’s examine how our 2015 forecast panned out. Last year at this time we said:
The end of quantitative easy, a plunge in the price of oil and several geopolitical and exogenous issues seem to have been shrugged off by this market. We expect the usual 50% move from the midterm low to the pre-election year high to be below average in the 20-30% range as Fed rates hikes loom large. Toward the later part of 2015 the economy is prone to slowing as Republicans and Democrats begin the next battle for the White House.
We expect a high most likely in the first half of 2015 around Dow 19000, S&P 2250 and NASDAQ 5000, slightly higher or lower than NASDAQ’s all-time high. Then we look for a move sideways to slightly higher throughout the last half of 2015 with an ultimate high near yearend 2015.
We made new highs on all the major averages, clearing 5000 on NASDAQ, but the DJIA and S&P 500 came up a bit short of our forecast at 18312 and 2131 respectively. So far the Dow is up 19% from its 2014 midterm year low to this year’s high – S&P 22%. The economy is arguably slowing and the battle for the White House raging. So all in all, not perfect but not too shabby.
Four Horsemen of the Economy
The Unemployment Rate has been in a steady downtrend for the past six years and below the Fed’s threshold for over a year and at the current 5% rate since the summer. Though the labor participation rate shows that the economy is battling to expand, which is a good sign. Despite likely layoffs in the energy patch, solid hiring in other sectors like health care and tech are picking up the slack.
Inflation is another matter entirely and this aspect of the Fed’s dual mandate was clearly driving the Fed’s long delay on raising rates. Both PPI and CPI have been sliding lower for years and after a brief respite in mid-2014 CPI has drifted to the low single digits, while PPI has taken a nose-dive into negative territory as low oil and commodities prices have put pressure on inflation. Now that the Fed raised rates 0.25% perhaps the low CPI inflation and negative PPI will prove transitory, but it is rather worrisome.
Consumer Confidence continues to trend higher and is now above the critical 90 level, though threatening to breakdown at a moment’s notice. While we finally experienced the long awaited 10% correction this summer DJIA and the US stock market bounced back and are threatening a move to new all-time highs if we get some good data and Santa comes back to town.
Existing home sales and Housing starts remain on the rise with sales of existing homes being by far the shining data point of the housing market, coming in at well over the seasonally adjusted annual rate of 5 million for the last year and a half. Starts have not been able to gain as much traction.
New home sales remain in the toilet and this is the major concern for the housing market. This is usually the last indicator to turn, but will provide an important confirmation when the housing market, the economy and the market have entered the next secular boom.
While the housing market is doing better overall, NAHB Housing Market Index (HMI) may be rolling over in the face of the lagging new home sales and housing starts. HMI is the best indicator of the overall housing market – it led all the other indicators before the meltdown and recovered fastest. Look for HMI to hold above its midpoint line and gain ground for a clear indication that the housing market and the economy are staying healthy.
Pulse of the Market
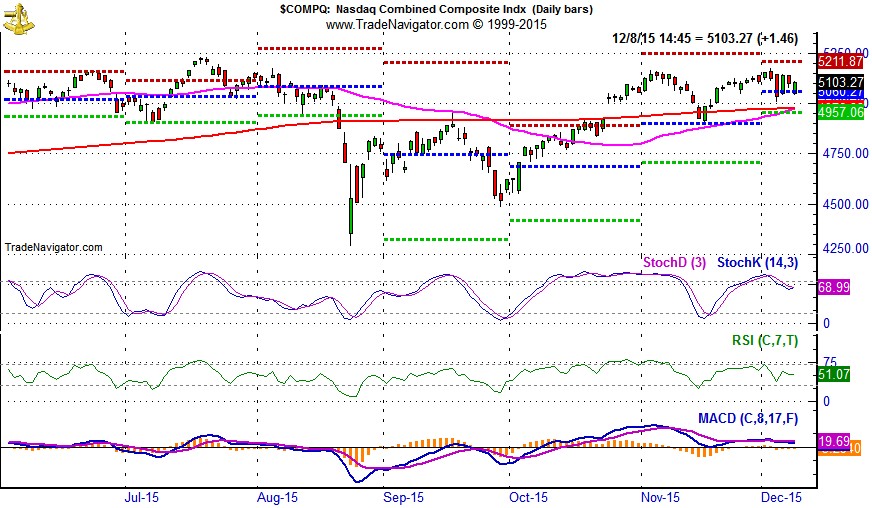
Seemingly heavier than usual tax-loss-selling pressure in the first half of December generated above average weakness this year. Virtually on cue, weakness did come to an end right around the middle of the month, this past Monday. Three straight days of DJIA gains had brought both the faster and slower moving MACD indicators to the verge of turning positive (1). Today’s decline will delay the bullish crossover at least another day or two.
A second bullish, albeit lagging crossover, will trigger today. DJIA’s 50-day moving average has finally risen back above its 200-day moving average (2). This crossover event is bullishly known as a “golden cross.”
Our research found recent “golden crosses” to be reasonably indicative of further upside as the last four have preceded extended moves higher.

Early-December weakness was foreshadowed this year by the eleventh DJIA Down Friday/Down Monday (DF/DM) (3) of 2015 on the last trading day of November. DJIA’s subsequent low on December 11 was within the realm of recent post DF/DM weakness in a bull market supported by highly accommodative monetary policy. DJIA’s December 11 close (4) capped one of 2015’s worst weeks and will likely be an important level to remember during the first quarter of 2016. S&P 500 (5) and NASDAQ (6) declined 3.8% and 4.1% respectively last week. Interestingly, last week’s heavy losses were just the second weekly decline in the last nine weeks for S&P 500 and NASDAQ.
Market breadth, measured by NYSE Weekly Advancers and Decliners has been all over the place. In weeks with solid upside moves, Advancers have held the clear advantage while in sharply down weeks, Decliners lead. Last week’s big decline was preceded by a modest weekly advance where Decliners heavily outnumbered Advancers (7). This would seem like it could be a worthwhile indicator until you look back further (week ending October 30) and see a similar meager weekly gain and lopsided ratio, but the following week was up. Broad energy and materials sector weakness is likely responsible for the chaos that weekly metrics have been displaying recently.
New NYSE Highs (8) have yet to show any sign of life as the broader indices have been muddling around well below their respective highs. Should New NYSE Highs begin to expand meaningfully, new all-time highs could be around the next corner.
In anticipation of this week’s Fed meeting, and widely expected rate hike, the 90-Day Treasury rate (9) rose to its highest level since 2009 at 0.26%. After seven years essentially at zero, the move likely feels much more significant than it actually is. The Fed is still highly accommodative within longer-term historical context.
Click for larger graphic…
2016 Forecast
Even if DJIA ends the year down for the first time since FDR’s 7th year in office in 1939, it does not necessarily imply that the next two years will be horrible like 1940 and 1941. There is no world war raging and while ISIL is a concern, they are not the Third Reich or Axis Powers and we will not wait as long to deal with them as we did with the Axis in WWII.
In fact, don’t be surprised if Putin takes care of ISIL unilaterally or with a coalition sooner rather than later. He wants stability in the region – his backyard and he does not care which despots are in charge as long as there is stability in the region. This was the same wisdom of Bush 1, Colin Powell and Schwarzkopf in 1991. They dismantled Iraq so they could not threaten the world but left them in power to keep order among the warring tribes and radical groups.
Election years average 4.8% on the DJIA, but 8th years, the last year of a two-term presidency average -13.9%, down 5 of the last 6. So we see two scenarios for 2016. If the Fed is right and the energy and commodities price decline proves transitory and prices stabilize, we expect average election year gains in the mid-single digits. If the Fed is wrong and oil and commodities suffer further declines and the junk bond scenario unravels we may begin a mild bear market next year.
As we do every year we will reassess at end of January with our indicator trifecta of the Santa Claus Rally, the First Five Days, and the full-month January Barometer as well as the December Low Indicator. We will also take into consideration at the end of next month all the economic data that has been released since as well as policy commentary from Washington and geopolitics.
The next bear market may begin in 2016 and could take the market 20-30% lower into 2017-2018 in the last cyclical, garden-variety bear market that finally puts an end to this secular bear that began in early 2000. We do not expect much upside over the next few years in the market. But after the next bear market our Super Boom forecast should kick in. We have raised the floor on our initial forecast, but the 500+% move to Dow 38820 by 2025 is still on target.
Happy Holidays & Happy New Year, we wish you all a healthy and prosperous 2016!
|
January 2016 Strategy Calendar
|
|
By:
Christopher Mistal
|
December 22, 2015
|
|
|
|
|
January Almanac, Vital Stats & Strategy Calendar: Once a Consistent Gainer, Now Rather Volatile
|
|
By:
Jeffrey A. Hirsch & Christopher Mistal
|
December 22, 2015
|
|
|
|
January has quite a legendary reputation on Wall Street as an influx of cash from yearend bonuses and annual allocations typically propels stocks higher. January ranks #1 for NASDAQ (since 1971), but fifth on the S&P 500 and sixth for DJIA since 1950. It is the end of the best three-month span and possesses a full docket of indicators and seasonalities.
DJIA and S&P rankings did slip from 2000 to 2015 as both indices suffered losses in nine of those sixteen Januarys with three in a row, 2008, 2009 and 2010. January 2009 has the dubious honor of being the worst January on record for DJIA (-8.8%) and S&P 500 (-8.6%) since 1901 and 1931 respectively. After three straight gains from 2011 to 2013, S&P 500 was off 3.6% in 2014 and 3.1% in 2015.
On pages 106 and 110 of the Stock Trader’s Almanac 2016 we illustrate that the January Effect, where small caps begin to outperform large caps, actually starts in mid-December. Early signs of the January Effect have yet to materialize this year as iShares Russell 2000 (IWM) continues to lag behind SPDR S&P 500 (SPY). The majority of small-cap outperformance is normally done by mid-February, but strength can last until mid-May when most indices reach a seasonal high.
The first indicator to register a reading in January is the Santa Claus Rally. The seven-trading day period begins on the open on December 24 and ends with the close of trading on January 5. Normally, the S&P 500 posts an average gain of 1.5%. The failure of stocks to rally during this time tends to precede bear markets or times when stocks could be purchased at lower prices later in the year.
On January 8, our First Five Days “Early Warning” System will be in. In presidential election years this indicator has a solid record. In the last 16 presidential election years 14 full years followed the direction of the First Five Days. The full-month January Barometer has a presidential-election-year record of 12 of the last 16 full years following January’s direction.
Our flagship indicator, the January Barometer created by Yale Hirsch in 1972, simply states that as the S&P goes in January so goes the year. It came into effect in 1934 after the Twentieth Amendment moved the date that new Congresses convene to the first week of January and Presidential inaugurations to January 20.
The long-term record has been stupendous, an 87.7% accuracy rate, with only eight major errors in 65 years. Major errors occurred in the secular bear market years of 1966, 1968, 1982, 2001, 2003, 2009, 2010 and 2014. The market’s position on January 29 will give us a good read on the year to come. When all the Santa Claus Rally, the First Five Days and January Barometer are in agreement, it has been prudent to heed their call.
| January (1950-2015) |
| |
DJI |
SP500 |
NASDAQ |
Russell
1K |
Russell 2K |
| Rank |
|
6 |
|
5 |
|
1 |
|
6 |
|
3 |
| #
Up |
|
42 |
|
40 |
|
29 |
|
23 |
|
20 |
| #
Down |
|
24 |
|
26 |
|
16 |
|
14 |
|
17 |
| Average
% |
|
1.0 |
|
1.0 |
|
2.7 |
|
1.0 |
|
1.7 |
| 4-Year Presidential Election Cycle Performance
by % |
| Post-Election |
|
0.7 |
|
0.7 |
|
2.2 |
|
1.6 |
|
2.0 |
| Mid-Term |
|
-0.9 |
|
-1.0 |
|
-0.7 |
|
-1.3 |
|
-0.9 |
| Pre-Election |
|
3.7 |
|
3.9 |
|
6.6 |
|
2.9 |
|
3.2 |
| Election |
|
0.3 |
|
0.5 |
|
2.6 |
|
0.7 |
|
2.3 |
| Best & Worst January by % |
| Best |
1976 |
14.4 |
1987 |
13.2 |
1975 |
16.6 |
1987 |
12.7 |
1985 |
13.1 |
| Worst |
2009 |
-8.8 |
2009 |
-8.6 |
2008 |
-9.9 |
2009 |
-8.3 |
2009 |
-11.2 |
| January Weeks by % |
| Best |
1/9/76 |
6.1 |
1/2/09 |
6.8 |
1/12/01 |
9.1 |
1/2/2009 |
6.8 |
1/9/87 |
7.0 |
| Worst |
1/24/03 |
-5.3 |
1/28/00 |
-5.6 |
1/28/00 |
-8.2 |
1/28/00 |
-5.5 |
1/4/08 |
-6.5 |
| January Days by % |
| Best |
1/17/91 |
4.6 |
1/3/01 |
5.0 |
1/3/01 |
14.2 |
1/3/01 |
5.3 |
1/21/09 |
5.3 |
| Worst |
1/8/88 |
-6.9 |
1/8/88 |
-6.8 |
1/2/01 |
-7.2 |
1/8/88 |
-6.1 |
1/20/09 |
-7.0 |
| First Trading Day of Expiration Week: 1990-2015 |
| #Up-#Down |
|
16-10 |
|
12-14 |
|
12-14 |
|
11-15 |
|
11-15 |
| Streak |
|
D2 |
|
D3 |
|
D3 |
|
D3 |
|
D3 |
| Avg
% |
|
-0.02 |
|
-0.05 |
|
0.001 |
|
-0.1 |
|
-0.03 |
| Options Expiration Day: 1990-2015 |
| #Up-#Down |
|
15-11 |
|
14-12 |
|
13-13 |
|
14-12 |
|
14-12 |
| Streak |
|
U5 |
|
U1 |
|
U1 |
|
U1 |
|
U1 |
| Avg
% |
|
-0.1 |
|
-0.1 |
|
-0.2 |
|
-0.1 |
|
-0.1 |
| Options Expiration Week: 1990-2015 |
| #Up-#Down |
|
13-13 |
|
9-17 |
|
14-12 |
|
9-17 |
|
13-13 |
| Streak |
|
D1 |
|
D2 |
|
D1 |
|
D2 |
|
D1 |
| Avg
% |
|
-0.3 |
|
-0.3 |
|
-0.1 |
|
-0.3 |
|
-0.1 |
| Week After Options Expiration: 1990-2015 |
| #Up-#Down |
|
12-14 |
|
15-11 |
|
13-13 |
|
15-11 |
|
18-8 |
| Streak |
|
U1 |
|
U1 |
|
U1 |
|
U1 |
|
u1 |
| Avg
% |
|
-0.5 |
|
-0.3 |
|
-0.1 |
|
-0.2 |
|
0.06 |
| January 2016 Bullish Days: Data 1995-2015 |
| |
4,
5, 25 |
19,
27 |
4,
11, 12, 19 |
11,
12, 19 |
8, 11, 19, 26 |
| |
|
|
20,
26, 27 |
26,
27 |
27, 29 |
| January 2016 Bearish Days: Data 1995-2015 |
| |
8,
21, 22 |
21 |
21,
22 |
21 |
21 |
| |
|
|
|
|
|
|
2015 Free Lunch Stocks Served: Option Expiration Serves Up 38 Select New Lows
|
|
By:
By Jeffrey A. Hirsch & Christopher Mistal
|
December 19, 2015
|
|
|
|
Publication Note: Tuesday, December 22rd will be our last regularly scheduled Alert of 2015. Our next email will be on January 5, 2016. However, if market conditions warrant an interim update, one will be sent. Happy Holidays and Happy New Year!
As a reminder, our “Free Lunch” strategy is purely a short-term strategy reserved for the nimblest traders. Traders and investors tend to get rid of their losers near yearend for tax loss purposes, often driving these stocks down to bargain levels. Our research has shown that NYSE stocks trading at a new 52-week low on or about December 15 will usually outperform the market by February 15 in the following year. We have found that the most opportune time to compile our list is on the Friday of December triple witching.
This strategy takes advantage of several year-end patterns and indicators. First, the stocks selected are usually technically, deeply oversold and poised for a bounce, dead cat or otherwise. Second, all of the stocks are of the small- and mid-cap variety that will benefit from the January Effect which is the tendency for small-caps to outperform large-caps from mid-December through February. Lastly, the strategy spans the usually bullish Santa Claus Rally and the First Five Days of January.
To be included in this list, the stock must have traded at a new 52-week low on Friday, December 18, 2015. Then, preferred stocks, funds, splits, special high dividends, new issues, trusts, LP’s and MLP’s were eliminated. To remain on this year’s list, the stock had to still be trading at $1.00 or higher as several online trading platforms place additional restrictions on a trade when shares are below $1.00. Furthermore, the stock had to average at least 100,000 shares per day over the last three months and have a market cap of at least $100 million, but not greater than $10 billion. Finally, any stock that was not down 60% or was down over 90% from its 52-week high to the 52-week low reached on Friday were also eliminated.
Once again this year, we are suggesting specific buy limits and stop losses for each stock included and the trades will be tracked in the Almanac Investor Stock Portfolios.
If you buy these stocks, please note the following:
1. Consider selling them as soon as you have a significant gain and utilizing stop losses.
2. The stocks all behave differently and there is no automatic trigger point to sell at.
3. Standard trading rules from the Almanac Investor Stock & ETF Portfolios do not apply for these stocks.
4. We think you should be out of all of these stocks between the middle of January and the middle of February.
5. Also, be careful not to chase these stocks if they have already run away.
DISCLOSURE NOTE: Officers of Hirsch Holdings do not currently own any of the shares mentioned. However, we may participate in the Free Lunch Strategy this year.
|
Market at a Glance - 12/17/2015
|
|
By:
Christopher Mistal
|
December 17, 2015
|
|
|
|
12/16/2015: Dow 17749.09 | S&P 2073.07 | NASDAQ 5071.13 | Russell 2K 1148.97 | NYSE 10267.83 | Value Line Arith 4386.82
Psychological: Nervous. Only two weeks remain in 2015. Where is the holiday cheer and the corresponding yearend rally? Other than NASDAQ; DJIA, S&P 500 and Russell 2000 are all down year-to-date, in a pre-election year! This year could be DJIA’s first pre-election year decline since 1939. Not to mention soaring junk bond yields and the persistent energy rout. Yes, all good points and valid concerns. Let’s not overlook the fact that the market has not collapsed upon itself yet. There appears to be some underlying strength supporting the markets. Perhaps all the negatives are “transitory” as Fed Chairwoman, Yellen is fond of saying. In two weeks we will all be given a fresh start.
Fundamental: Mixed. Outside of the labor market, data remains dicey. Overall corporate revenues and earnings have been weighted on by falling energy and commodity prices and a stronger dollar. The very same declines in energy and commodities along with a strong dollar are also dragging inflation metrics lower. Tepid global growth, geopolitical tensions and the threat of terrorism are also eroding confidence. Some commodity price stability could go a long ways towards improving the fundamental landscape.
Technical: Range bound. Alas, some Fed uncertainty has been removed from the market. Unfortunately, broad energy and materials sector instability remains and a clear upside catalyst is still not in sight. DJIA, S&P 500 and NASDAQ appear to be stuck in a range from around their respective November lows and a few percentage points below their all-time highs. As long as all three indices do not slip below their November lows, the near-term outlook remains positive. If all three indices fall solidly below the November lows, the outlook would darken substantially.
Monetary: 0.25-0.50%. It finally happened. ZIRP has passed into the history books, for now anyways. For months the Fed had slowly painted itself into a corner and that corner was yesterday. After seven years at zero, the Fed funds rate is now 0.25 to 0.50%. The primary reason for the increase appears to be a Fed now focused on the potentially damaging effects of acting too slowly. Their biggest fear, so far looking quite unlikely, was that inflation could rapidly increase and force a faster tightening cycle than desired. Bottom line; even though some interest rates are higher today than yesterday, monetary policy is still highly accommodative to the economy and the financial markets.
Seasonal: Bullish. January is the third month of the Best Six/Eight, but it is the last of the Best Consecutive Three month span. January is the top month for NASDAQ (since 1971) averaging 2.7%, but it has slipped to sixth for DJIA and fifth for S&P 500 since 1950. The Santa Claus Rally ends on January 5 and the First Five Days early-warning system ends on the 8th. Both indicators provide an early indication of what to expect in 2016. However, we will wait until the official results of the January Barometer on January 29 before tweaking our 2016 Annual Forecast. Alerts will be issued after the close on these dates.
|
‘Tis the Season for Market Rallies
|
|
By:
By Jeffrey A. Hirsch & Christopher Mistal
|
December 15, 2015
|
|
|
|
In some respects this December has felt more like an October than a typical December. Market volatility, measured by the CBOE Volatility index (VIX), spiked as high as 26.81 on December 14 and has been above 20 for three straight days after the second (S&P 500) or third (DJIA and NASDAQ) worst weekly loss of the year. The Russell 2000 small-cap index had its worst week of 2015 last week, off 5.1%.
We suspect much of this year’s first-half-December weakness was the result of heavier than usual tax-loss-selling pressure and Fed rate jitters. Energy stocks and crude oil had another tough year and were amongst last week’s biggest losers. High-yield bonds, many of which are linked to energy, also had a challenging year and found themselves being aggressively sold last week as well. The pace and magnitude of early-December’s declines would seem out of the ordinary at first glance. However, based upon the next four charts, this December is still well within the range of what the last 21 Decembers experienced.
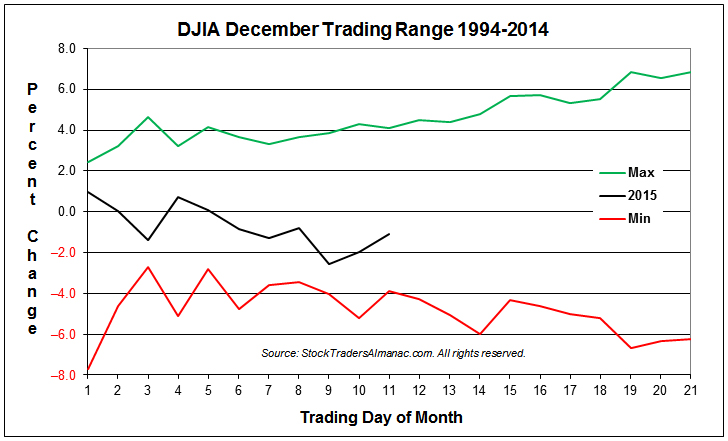
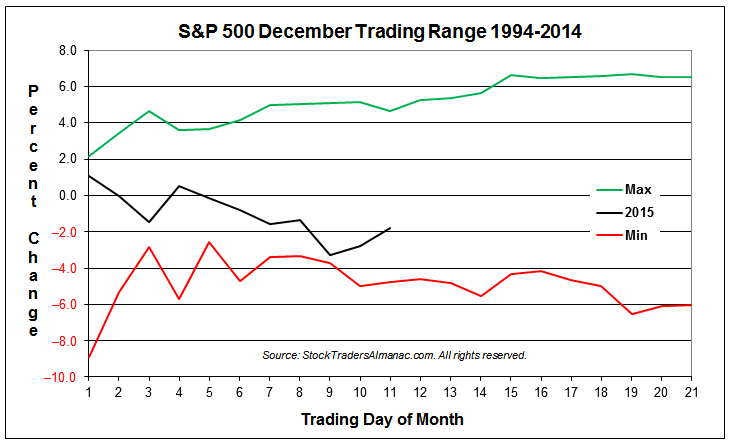
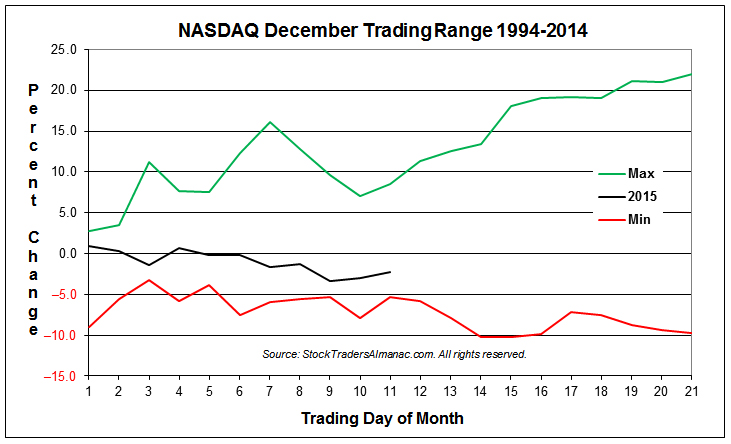
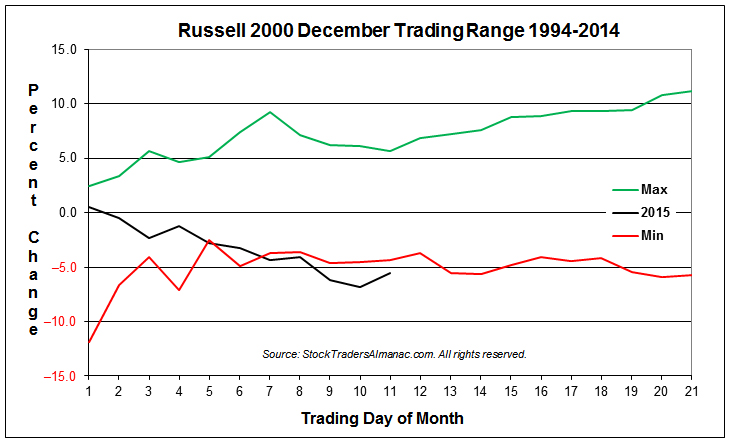
These charts represent a somewhat different take on seasonality, but still apply the basic approach as many of our other seasonality charts. Instead of plotting the average percent change, one trading day at a time for the time period, we are plotting the minimum and the maximum for each trading day during the time period. The Day 21 Min value represents the worst December since 1994 and the Max value represents the best December finish. NASDAQ’s 21.98% gain in December 1999 pushes its min-max range to the largest spread amongst the four indices.
Of the four major indices plotted above, only Russell 2000 has exceeded the low-end of its 21-year December trading range. DJIA, S&P 500 and NASDAQ are trending in the lower half of the range, but remain comfortably above it thus far. The arrival of mid-month, today, accompanied by gains yesterday and today suggests the worst of tax-loss selling is likely over and the typical second-half December rally is likely underway.
Santa Delivers Cheap Small Caps
Typical first-half-of-December weakness was a bit magnified this year. The lackluster performance of the stock market this year, Fed-rate-hike handicapping, new lows in crude, and a mini-run on junk bonds all conspired to exacerbate yearend tax-loss selling. But this appears to be setting the market up for a quintessential yearend “Santa Claus Rally” and some outperformance from the lagging small cap sector.
Perhaps one our favorite market tacticians put it best today on CNBC. Raymond James chief investment strategist Jeffrey Saut said that “
the market has the potential for a rip your face off-type rally…. It’s human nature to read into negativity, what happened last Friday, but it really doesn’t deconstruct the bullish case right here. You’ve got massively oversold conditions in the equity markets. You’ve got a December option expiration in the trillion plus dollars that everybody is worried about – it typically has a bullish tilt to it…. The setup is pretty good for a rally to the upside that's going to surprise a lot of people. I think you could make new highs by the end of the year – new all-time highs.”
As you can see in the chart below of the Russell 2000 Small Cap Index One-Year Seasonal Pattern, this year the R2K has stayed rather close in trend and shape with the historical pattern, but well below in level. The pink arrow point to last Friday’s low, which lines up directly with the usual mid-December low. It is at this point when the market tends to rally into yearend and small caps outperform large caps. This has been referred to as the January Effect for years, but in recent history we have discovered that this so-called January Effect starts in mid-December (STA 2016 pages 106 & 110).
![[Russell 2000 Small Cap 1-Year Patter V 2015]](/UploadedImage/AIN_0116_20151215_R2K2015vHistory.jpg)
Then comes the Santa Claus Rally. This cute little seasonal phenomenon has been erroneously ballyhooed for months and we have discussed enough ourselves that we almost can’t bear to mention it again, but it is important. Number one, if it does not transpire it is not a great sign for 2016. Yale Hirsch defined the SCR in 1972 as a seven-trading-day period that spans the last 5 trading days of the year and the first two of the New Year.
The S&P has averaged 1.4% over the period. But, the real significance is when it does not appear. As we remind in the headline on page 114 of the 2016 Almanac, “If Santa Claus should fail to call, bears may come to Broad and Wall.” In the table below you can see that the last four times SCR was negative the year was either flat or suffered a bear market. The S&P was down -3.0% this year and 2015 is on pace for a flat year.
The other reason the Santa Claus Rally is so important is that it helps drive up beaten down bargain stocks. Along with the Small Cap Effect the starts in mid-December, the Santa Claus Rally contributes to our Only “Free Lunch” On Wall Street Strategy.
Lunch is Almost Ready
Investors tend to get rid of their losers near year-end for tax purposes, often hammering these stocks down to bargain levels. And this year is a pretty good example. Over the years the Stock Trader’s Almanac has shown that NYSE stocks selling at their lows on December 15 will usually outperform the market by February 15 in the following year. When there are a huge number of new lows, stocks down the most are selected, even though there are usually good reasons why some stocks have been battered.
Our “Free Lunch” strategy is only a short-term strategy reserved for nimble traders. It has performed better after market corrections as we have had recently in 2015 and when there are more new lows to choose from. The object is to buy bargain stocks near their 52-week lows and sell any quick, generous gains, as these issues can often be real dogs.
This strategy has been profitable in 15 of the last 16 years with an average basket gain of 14.8%. Like nearly every asset class at the time, the “Free Lunch” trade was down 3.2% in 2007-2008, but still it still outperformed the NYSE over the same period. As you can see in the table below, though last year’s basket was underwhelming it still outpaced the NYSE Composite.
This year’s “Free Lunch” stock basket will be emailed to Almanac Investor Subscribers before the market opens on December 21, but you will likely receive it over the weekend. We will glean through the lists of stocks making new 52-week lows, sifting out all non-common shares, splits, new issues and other illiquid and questionable securities and email it out as soon as we are satisfied. Subscribers will receive specific buy limits and stop losses for each stock included and the trades will be tracked in the Almanac Investor Stock Portfolios.
|
Stock Portfolio Update: Buying Weakness Ahead of Anticipated Yearend Rally
|
|
By:
Christopher Mistal
|
December 10, 2015
|
|
|
|
History may not repeat itself exactly to the letter, but the market certainly has been following along rather closely. Two patterns we have been monitoring recently,
Market Performance Before & After Major Rate Tightening Cycles and
Typical December Trading, have been unfolding reasonably closely this month. The former pattern suggested choppy trading with a mild upside bias ahead of the Fed’s up-coming December meeting where the probability of the first rate hike in nearly a decade is high. The latter pattern suggested a weak first half of December due to tax-loss selling and early year-end portfolio restructuring. Both of these patterns have been updated in the following to charts to include December’s trading action through today’s close.
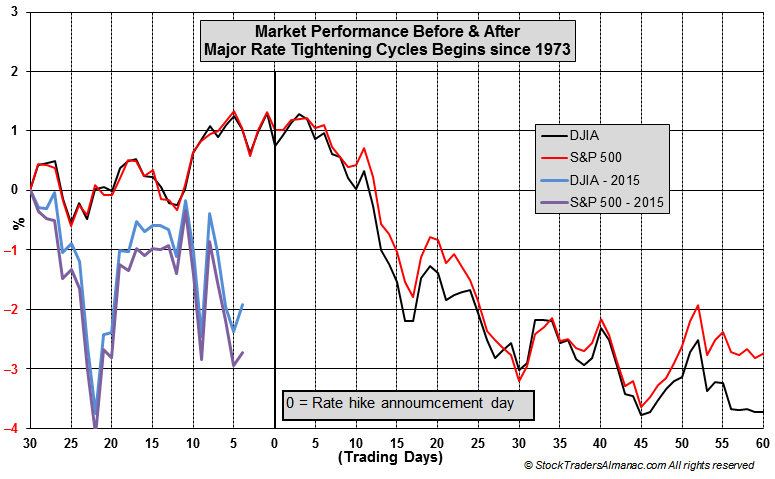
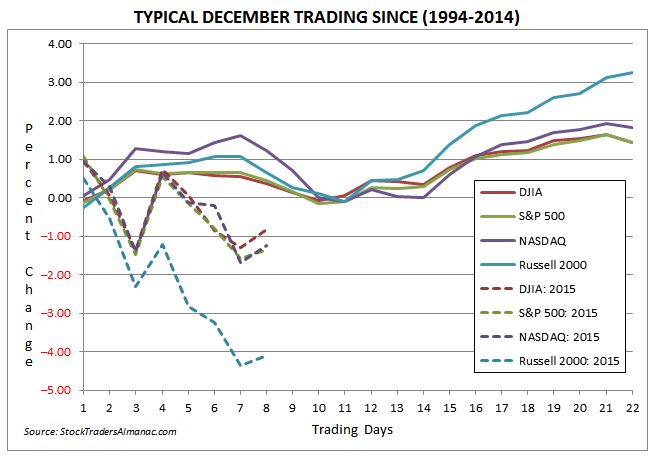
As you can see in both charts, the market is running below average. A typical December would have the market floating around unchanged on the eighth trading day of the month which would be better than the down roughly 1% that it is today. Russell 2000 is the worst performer by a wide margin, currently down 4.1% this December. Small-cap underperformance in the first half of the month is actually quite normal and does potentially set up that index for solidly outperforming in the second half and potentially beyond.
This rate hike cycle has been the mostly widely debated and telegraphed in the history of the Fed and yet it is still not a 100% forgone conclusion it will begin on December 16. Based upon Fed funds futures pricing listed on
www.cmegroup.com, the current probability of a Fed rate hike is now 83%. This uncertainty combined with previously mentioned tax-loss selling and year-end portfolio moves is the most likely cause for the elevated market volatility seen so far this month. Once December 16 passes on the calendar, market volatility will likely begin to diminish and typical holiday cheer and year-end buying will probably kick in, taking the market higher to finish up the month and the year. Suggested weakness after the rate hike will likely be offset by the positive effect created by the removal of rate increase uncertainty.
Stock Portfolio Updates
Over the past four weeks, the Stock Portfolio slipped 1.3% while S&P 500 and Russell 2000 dropped 1.3% and 2.7%, respectively, as of yesterday’s close. Small-, Mid- and Large-cap sub-portfolios suffered declines. Mid-caps were hit the hardest, off 2.8%. Group 1 Automotive (GPI) was stopped out on November 13 when it closed below $78.88. GPI’s return was reduced to 25.8% since addition, excluding dividends and fees. Amerco Inc (UHAL), Cal-Maine Foods (CALM) and Team Health (TMH) were also drags as these shares slid the most. Bright spots included Lithia Motors (LAD), which held its ground and Sunoco (SUN) that climbed 5% in the face of falling crude oil prices and general energy-sector malaise.
Large-cap holdings collectively shed 1.2% as recently added positions (from October stock basket) weakened modestly with the broader market. Older holdings, Fidelity National Finance (FNF) and UnitedHealth (UNH), climbed slightly higher, but not enough to offset the drag from other positions. This month’s Seasonal Sector Trades’ idea, Southern Copper (SCCO) was added to the portfolio on December 8 when it traded below its buy limit of $25. At yesterday’s close, it was up $0.21 or 0.8%.
Our Small-caps performed the least bad, down 0.8% combined. Newtek Business Service (NEWT) is issuing a special dividend consisting of cash and/or stock in the amount of $2.69 per share (approximate value of $34 million). However, only 27% of the dividend will be paid in cash, the balance will be paid in shares. Shareholders are to receive election forms to decide which they prefer, all cash or all stock. If enough shareholders opt for stock, then those that opt for cash will receive all cash. If too many shareholders request cash such that the 27% limit would be exceeded then payment will be cash and shares. Based upon the reason for this special dividend and the fact that NEWT has paid a generous dividend already this year, taking the additional shares appears to be the appropriate action. NEWT’s original price and stop loss have been adjusted for this special dividend. Additional information can be found on their website here: http://investor.newtekbusinessservices.com/index.cfm.
Other notable happenings in the small-cap portfolio include some rather volatile moves by Century Community (CSS) and LGI Homes (LGIH). CCS was pulled even further lower than last update while LGIH initially shot higher only to be sharply sold off to much lower levels. LGIH appears to be finding support now right around $27. CCS is back at the level it broke out from back in February. Finally Walker & Dunlop (WD) was picked up on November 13 at $26.90.
In last month’s update, based on previous research, we were anticipating some weakness to present creating an opportunity to make some additional purchases on dips in November and in early December. That weakness has materialized. As a result many of the more recent trade ideas can be considered either at current levels or on dips below their respective buy limits. Please note, Buy Limits and Current Advice are based upon the closing prices from December 9. Positions may have moved higher or lower today.
Disclosure Note: At press time, officers of the Hirsch Organization, or accounts they control held positions in CALM, CCS, CNC, CVS, DHI, HBI, LGIH, MMSI, NTRS, PLOW, SUN, TMH, TSCO and VSR.
|
Market Update: More Weakness Likely, but Still on Track for Rally Mid-December
|
|
By:
Christopher Mistal
|
December 08, 2015
|
|
|
|
Even before the month of December arrived, expectations were running high for the market in the final month of 2015. Historically, the market is rarely down in December and when it is it is usually just barely. Remember, this is for the full month. History has also shown a tendency for the market to be weaker during the first part of the month as tax-loss selling and yearend portfolio restructuring has been happening sooner and sooner in recent years.
It seems reasonable to assume that some of this has been taking place already this month. Some of the year’s biggest losers have been hit the hardest lately specifically, energy-related stocks and crude oil. Tax-loss selling appears to only be exacerbating broad commodity weakness that has existed all year. It does not look like the global economy is decelerating further. As long as the market can hold its November lows between now and mid-month December, then the market is still on track for a typical yearend rally that has
historically commenced around mid-month.
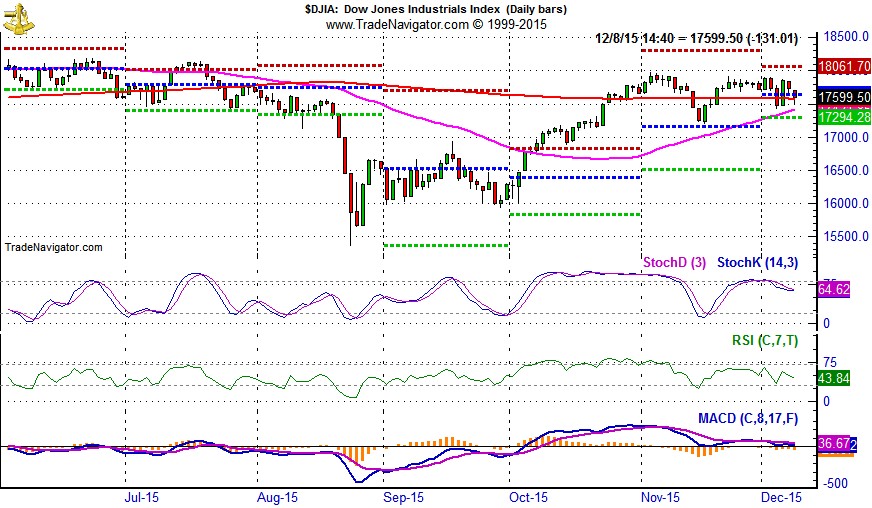
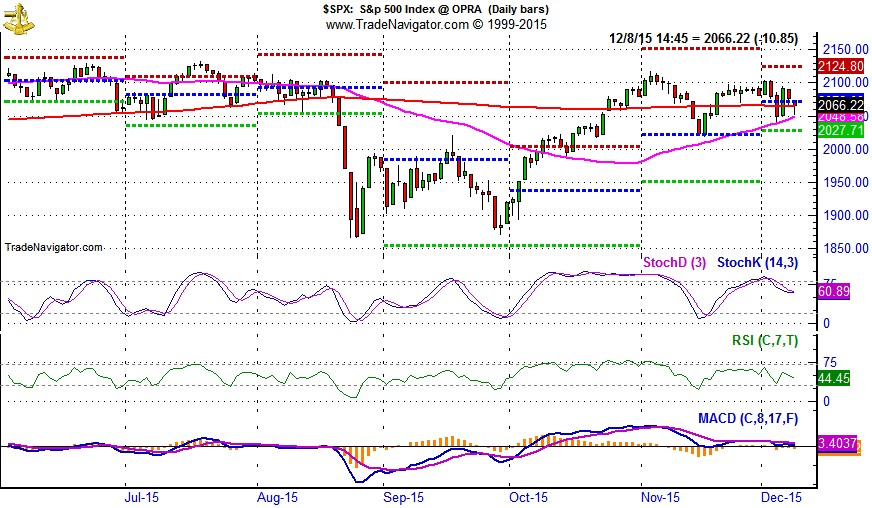
In the above three charts, November’s lows were all right around the projected monthly pivot-point (blue-dashed line). Those levels were DJIA 17159, S&P 500 2022 and NASDAQ 4900. Over the past four trading sessions, DJIA, S&P 500 and NASDAQ have been on either side of December’s projected monthly pivot point which is also roughly where DJIA’s and S&P 500’s 50-day moving averages currently sit. NASDAQ, the best performing index year-to-date of the three, has not touched its 50-day moving average since mid-November and is on the verge of registering a bullish golden cross, when its 50-day moving average crosses back above its 200-day moving average.
Contrarian View of Interest Rates and the U.S. dollar
This year the catalyst for a yearend rally beginning in mid-December could be stronger than usual. Besides the slowing of usual tax-loss selling and end-of-year portfolio restructuring, the Fed could finally announce the first rate hike in nearly a decade on December 16. Conventional thought expects an increase in interest rates will lead to a stronger U.S. dollar. This may not be the case though. Currency values are based upon much more than just interest rates. Economic growth and inflation, actual and expected, are also integral to a currency’s value. Politics, government policies, leadership and debt burden also play a role.
Consider what just happened to the euro when the ECB cut rates and pledged additional QE. The euro spiked 3% on the day and has managed to hang on to most of the gains in the days since. Some will say it spiked because the ECB did not do as much as expected, but it looks more like short-covering than disappointment. A single-day move of 3% is substantial in the currency markets and even more so when it is the euro. The decision to cut rates and expand QE was well telegraphed resulting in a sizable drop in the euro before the official announcement was even made. This seems like a classic example of “buy the rumor, sell the fact.”
The U.S. dollar index has enjoyed a vigorous rally over the past 16 months from around 80 in July 2014 to just over 100 this month. It would seem a series of rate hikes may already be baked into the cake.
Furthermore, during the last rate hike cycle the Fed embarked upon from June 2004 to July 2006 (shaded in yellow in chart above), the U.S. dollar index actually declined. Granted it was not a straight line lower nor was it by a massive amount. Nonetheless, by the time the Fed moved interest rates from 1% to 5.25%, the U.S. dollar was weaker. The USDX closed May 2004 at 88.95 and was at 85.30 at the end of July 2006 and reached a high of 92.63 in November 2005.
That rate hike cycle was well telegraphed and orderly. The next rate hike cycle has been expected for even longer and is likely to be even slower. Giving the surge of the U.S dollar in anticipation of the first hike it seems quite possible that the U.S. dollar could actually weaken instead of strengthening further as profits are taken “on the news.” A weaker dollar would give commodities a much-needed boost and would also aid our manufacturing sector by making our exports more attractive overseas, which could eventually lead to new all-time market highs in the near-term.
|
Seasonal Sector Trades: Copper Building a Bullish Foundation
|
|
By:
By Christopher Mistal & Jeffrey A. Hirsch
|
December 03, 2015
|
|
|
|
Copper has a tendency to make a major seasonal bottom in December and then a tendency to post major seasonal peaks in April or May. This pattern could be due to the buildup of inventories by miners and manufacturers as the building construction season begins in late-winter to early-spring. Auto makers are also preparing for the new car model year that often begins in mid- to late-summer. Traders can look to go long a May futures contract on or about December 14 and hold until about February 23. In this trade’s 43-year history, it has worked 28 times for a success rate of 65.1%. This trade has produced gains in ten of the last fourteen years. Losses were in 2006 (end of housing bubble), 2012 (copper peaked in February), 2013 (peaked in late December as emerging market growth slowed) and 2014 (bottomed in January 2015).
Cumulative profit, based upon a single futures contract excluding commissions and fees, is a respectable $69,400. Slightly more than one-fourth of that profit came from 2007, as the cyclical boom in the commodity market magnified that seasonal price move. However, this trade has produced other big gains per single contract, such as a $14,475 gain in 2011, and even back in 1973, it registered another substantial $9,475 gain. These numbers show this trade can produce big wins and big losses if not properly managed. A basic trailing stop loss could have mitigated many of the losses.
Let’s consider a stock that mirrors the price moves of copper. The chart below has Southern Copper (SCCO) prices (solid black line) overlaid on copper. This company mines, explores, smelts and refines copper and other minerals primarily in South America. SCCO revenues and earnings have fallen alongside the price of copper and other metals, but it has managed to remain profitable and maintain a small dividend.
![[Copper (HG) Bars, Southern Copper (SCCO) Closes and Seasonal Pattern Chart (Weekly Data November 2014 – December 3, 2015)]](/UploadedImage/AIN_0116_20151203_HG-SCCO_Seasonal.jpg)
Since peaking in May, copper and SCCO are both down substantially. Copper has fallen by roughly a third while SCCO is off nearly 25% over the past six months. Tepid global growth and a strong U.S. dollar are two of the biggest drivers behind this year’s dive in copper prices. There are a few signs suggesting global growth could accelerate namely substantial stimulus in Europe and Japan. And the dollar index (USDX) looks like it has topped out again. Currently down nearly 3% following today’s ECB announcement. While copper appears to be forming a base just above $2, a key psychological support level. All of this improves the likelihood of another seasonal rally by copper and potentially by the companies that mine it. SCCO could be bought on dips below $25.00. If purchased, a stop loss of $21.75 is suggested. This trade will be tracked in the Almanac Investor Large-Cap Stock Portfolio.
![[Southern Copper (SCCO) Daily Bar Chart]](/UploadedImage/AIN_0116_20151203_SCCO.jpg)
Yet another option to take advantage of copper’s seasonal move is iPath Bloomberg Copper TR Sub-Index ETN (JJC). As a reminder, ETNs differ from ETFs. An ETN is debt whose current value is based upon an index return. In the case of JJC, it is linked to the Bloomberg Copper Total Return Sub-Index which represents the potential return of an unleveraged investment in copper futures. JJC trading volume is on the light side, trading just 17,000 shares per day on average over the past three months, but it does pick up when copper moves. JJC could be bought on dips below $23.45. Once purchased a stop loss of $21.15 is suggested. This trade will be tracked in the Almanac Investor ETF Portfolio.
|
ETF Trades: Nearly the Season to Consider Energy Stocks
|
|
By:
Christopher Mistal
|
December 01, 2015
|
|
|
|
At the current pace, 2015 is on track to be a flat year. At yesterday’s close, the last day of November, DJIA was down 0.6% year-to-date while S&P 500 was up just 1.0%. We have heard much about December’s prowess for gains recently. Going back to 1901, DJIA in December has been up 71.9% of the time with an average gain of 1.5%. Since 1930, S&P 500 has been up 72.9% of the time with an average gain of 1.4%. For DJIA, December is the best month by average performance and frequency of gains. S&P 500 is second best by average performance, but still first in frequency of gains. Expectations for December are clearly running high this year.
However, in the following table we see that the market’s flat year-to-date performance could weigh on December’s performance this year. All past DJIA and S&P 500 years where year-to-date performance on the last day of November was less than or equal to 2015 appear. The frequency of December gains dips modestly to 64.4% for DJIA and 63.6% for S&P 500. Average performance falls noticeably. Ultimately, the fate of December this year is most likely in the hands of the Fed. Should they raise rates this month; the removal of uncertainty will likely send stocks higher into yearend.
December Trade Idea
In the chart below, the NYSE Arca Oil Index (XOI) of oil producing companies has reasonably closely tracked its seasonal pattern this year peaking in May then falling to an early-October low where it bounced. Since bouncing off multi-year lows in August and again in October, XOI has essentially moved sideways for the past seven weeks. Should XOI fall back in line with its seasonal pattern, another buying opportunity is likely sometime later this year or earlier next year.
Oil companies typically come into favor in mid-December and remain so until the beginning of July (yellow box in chart above). This trade has averaged 11.9%, 11.6%, and 7.5% gains over the last 15-, 10-, and 5-year periods, This seasonality is not based upon the commodity itself; rather it is based upon XOI. This price-weighted index is composed of thirteen of the largest integrated oil and gas producers. We will look to add the following ETF to the portfolio on a dip.
SPDR Energy (XLE) is the top pick to trade this seasonality. A new position in XLE could be established on pullbacks with a buy limit of $66.10. Employ a stop loss of $59.49. Take profits at the auto sell of $81.36. Exxon Mobil is the top holding in XLE at 17.15%. The remaining top five holdings of XLE are Chevron, Schlumberger, EOG Resources and Occidental Petroleum.
ETF Portfolio Updates
As a reminder, three sector seasonalities come to an end in December: Gold & Silver, Semiconductor, and Telecom. The existing SPDR Gold (GLD) position is not related directly to this seasonality, but does benefit from it. Gold is currently sitting at key support and can do one of three things; do nothing, break down or stage an oversold rally. Our position in GLD was acquired near the lows and can be held as an oversold bounce appears to be the highest probability outcome. iShares DJ US Telecom (IYZ) and iShares PHLX Semiconductor (SOXX) are on Hold. IYZ was up 8.9% as of yesterday’s close while SOXX was recently added on November 13 at $87.15, up 5.1% already.
In addition to SOXX, iShares DJ Transports (IYT) and Vanguard REIT (VNQ) were added to the portfolio on November 13 leaving only SPDR Technology (XLK) as the last open trade idea. IYT and XLK can be considered on dips below their respective buy limits.
The second trade idea from last month’s
Sector Seasonal Trades,
iShares Barclays 20+ Tear Bond (TLT) was shorted today when it traded above $122.59. Because we use the previous days close to calculate returns there is no return yet listed in the table. However, as of today’s close this trade is slightly in the red and the position is
on hold.
Based upon historical analysis, this December is expected to open bullishly, which it did today by bucking the first trading days recent streak of weakness, then the market is likely to drift sideways to lower into mid-month before rallying to close out the year. The magnitude of the rally will likely largely depend on the Fed. Based upon this expectation, DIA, IWM, QQQ and SPY could be purchased on dips below their buy limits.
See table below for updated buy limits, stop losses and auto-sell prices.
Disclosure Note: At press time, officers of the Hirsch Organization, or accounts they control held positions in IBB, IWM, IYT, QQQ, VNQ, XLV and XRT.