|
January 2020 Trading & Investment Strategy
|
|
By:
|
December 26, 2019
|
|
|
|
|
2020 Forecast: Santa Brings New Highs, Market Sanguine on Impeachment & Sitting President Running
|
|
By:
Jeffrey A. Hirsch & Christopher Mistal
|
December 19, 2019
|
|
|
|
The House of Representatives impeached President Trump last night. The stock market woke up today, yawned and rallied smartly to new all-time highs across the board. Senate republican leadership has made it clear they are not on a trajectory to remove the president from office. The market remains sanguine as the likelihood of the president’s removal from office appears low. So we have sitting president running for reelection with mountains of cash, and an apparently reunified Republican Party rallying around the president.
Late today the House passed Trump’s USMCA trade agreement between the USA, Mexico and Canada. Across the pond Boris Johnson recently won the latest general election handily, so the UK finally appears headed toward the long awaited smooth and soft Brexit by January 31. Trade is improving with the Phase 1 trade deal with China nearing completion as both China the US have been announcing concessions and details.
The Fed is on hold, but ready to act and already has QE lite underway as it keeps the treasury repo markets flush with liquidity. Weak earnings and high valuations represent the best reason for a mild pullback, mid-January perhaps or just ahead of next earnings season. Risks remain, mostly on the trade and earnings/valuation fronts, but uncertainty appears to be trending lower. Growth is soft, but not zero or negative. Trade deals are moving forward and we have an easy Fed ready to act. Declining uncertainty supports a bullish outlook for 2020.
Four Horseman of the Economy
DJIA along with S&P 500 and NASDAQ have been leading the pack all year long. We have just logged new highs in prototypical Pre-Election Year fashion. Save any major setbacks on the trade, earnings, election or geopolitical fronts gains are likely to trend higher, except for a mild correction.
Consumer confidence remains positive though it has been flattening out over the past five years. Continuing progress on trade deals and Brexit, plus an easy Fed and more stable and functional federal government should help to improve consumer confidence in 2020.
The Unemployment Rate continues to remain super low at 3.5%. Economic activity may have decelerated some, but it remains solid and prices remain stable. Even more jobs are on the near-term horizon as Census 2020 hiring and 2020 election campaign hiring ramps up. We have seen the mailings for how to apply for a census job.
Our inflation horseman as measured by our 6-month exponential moving average calculations on the CPI and PPI have been in retreat, especially the PPI which has gone negative – likely the underlying reason the Fed lowered rates three times this year. CPI is now below the Fed’s target inflation rate of 2% at 1.88%.If negative PPI trickles into CPI we would not be surprised if Fed cut rates again. The Fed is terrified of sub 2% inflation. But with all the government hiring and deficit spending we don’t see a recession likely in 2020.
2019 Forecast Recap
The three-case forecast we presented last year was:
- Worst Case – Prolonged bear market caused by hawkish Fed, dysfunctional Federal Government, slow growth and weak corporate fundamentals brings us all the way back to November 2016 pre-Trump election levels or lower. Repeat of pre-election year 2015 with the bear lasting throughout 2019 into 2020.
- Base Case – Something gives. Mild bear market bottoms soon or in early 2019 as Fed tones down rhetoric and holds off raising rates, Trump and the Dems work out a few deals and we have modest pre-election year gains in the 5-10% range.
- Best Case – Everything resolves quickly. Fed becomes accommodative. Trade deals are worked out expeditiously. Trump tacks towards the center and works with congress and does not get “Muellered.” Typical pre-election year gains of 10-15% for Dow and S&P 500 and 20-30% for NASDAQ
We scrapped our worst case scenario rather quickly in 2019 as our January Indicator Trifecta came in positive 3-for-3. The Santa Claus Rally reemerged on the day after Christmas, logging a 1.3% gain for the S&P 500 during the 7-trading day stretch that includes the last five days of the year and the first two of the New Year, right in line with the historical average. Then our “First Five Days Early Warning System” came in strong with a 2.7% gain for the S&P and finally our full-month January Barometer registered a whopping 7.9%. This flashed a big green light for us as the market posted gains in 27 of the previous 30 years that all three components of our January Indicator Trifecta were up.
As the year progressed, closely tracking the bullish pattern of Pre-Election Years and often trending well above the historic seasonal pattern for Pre-Election Years (as we documented all year long), our base case scenario fell by the wayside. Then the Mueller Report found nothing conclusive on collusion, the Fed became accommodative and the Trade deal negotiations progressed with China. Decent fundamentals, supportive technicals and few attractive investments other than US equities kept us bullish all year in line with our best case scenario (except for our seasonal defense over the “Worst Six Months, which proved to be prudent and beneficial). Currently, at todays close the market is above our best case scenario with DJIA up 21.6% year-to-date, S&P 500 up 27.9% and NASDAQ up 33.9%.
Pulse of the Market
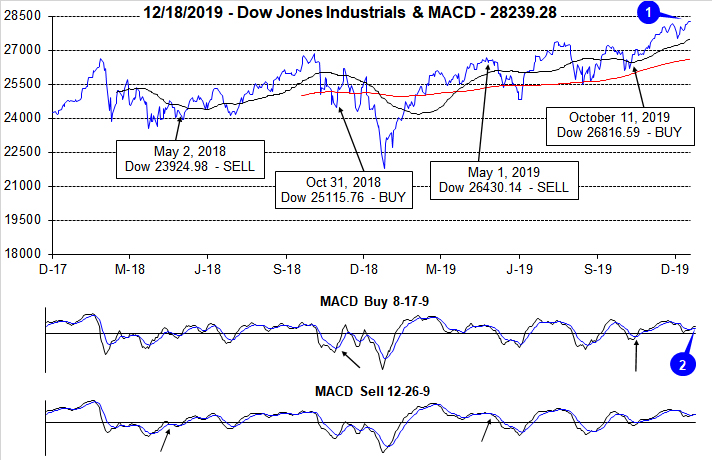
Typical first-half December weakness arrived a bit earlier than usual this year. DJIA suffered back-to-back, greater than 200-point declines on the first and second trading days of December (1). This “dip” proved to be brief as DJIA quickly recovered and is once again trading above 28,000 and at new all-time highs. As a result of DJIA’s quick reversal and new positive momentum, both the faster (2) and slower MACD indicators applied to DJIA are once again positive.
After four straight weeks of gains, DJIA has declined modestly in two of the last four weeks ending December 13. In the middle of this mixed streak of performance DJIA logged its seventh Down Friday/Down Monday (DF/DM) of the year (3). Since 1995, DJIA has recorded an average of 10 DF/DMs per year. This year’s below average number of DF/DMs is yet another confirming sign of underlying market strength. However, given the historical record of DF/DMs, it would be prudent not to forget that most past occurrences were followed by some weakness during the next 90 calendar days. Early December weakness may have been sufficient as the most recent DF/DM was most likely the result of trade and progress has since been made in the form of a Phase 1 deal with China.
S&P 500 has advanced in nine of the last 10 weeks (4) and NASDAQ has risen in nine of its last eleven (5). The worst weekly decline by S&P 500 or NASDAQ was a meager 0.3% during the week before Thanksgiving. Solid performance across all three indexes would seem to suggest more new all-time highs are likely in the near-term.
Market breadth measured by NYSE Weekly Advancers and NYSE Weekly Decliners (6) has begun to improve over the past two weeks with Weekly Advancers outnumbering Weekly Decliners by larger amounts when compared to mid-November. Rotation from defensive sectors to growth is likely slowing and participation in the rally could be broadening.
Weekly New Highs and Lows (7) remained somewhat mixed considering the new all-times highs reached by the major indexes. Overall New Highs remain subdued, but they are trending higher while New Lows continue to bounce around leaving room for further improvement. Should small-caps pick up and join in the rally, weekly metrics will likely respond with improvement.
The 90-day Treasury rate and the 30-year Treasury rate (8) appear to be stabilizing around current levels. The Fed has signaled it is most likely done with rate cuts unless there is a material change to their outlook or the data. Historically, U.S. rates are low and other developed nation’s rates are even lower. Low rates have historically been a positive for stocks.
Click for larger graphic…
2020 Forecast
- Worst Case – Correction, but no bear in 2020. Flat to single digit loss for full year due to on-going unresolved trade deals, no improvement in earnings and growth weakens further. Trump is removed from office by the Senate, resigns or does not run and political uncertainty spikes.
- Base Case – Average election year gains. Incumbent victory, trade and growth remain muddled, modest improvement in corporate earnings and Fed stays neutral to accommodative. 5-10% gains for DJIA, S&P 500 and NASDAQ.
- Best Case – Above average gains. Incumbent victory, trade resolved, growth improves, earnings improve and Fed stays neutral and accommodative. 7-12% for DJIA, 12-17% for S&P 500 and 17-25% for NASDAQ.
We will be keeping you fully abreast of all readings from our three January Trifecta Indicators: Santa Claus Rally, First Five Days and the full-month January Barometer and will make adjustments on the close of January 2020.
Happy Holidays & Happy New Year, we wish you all a healthy and prosperous 2020!
|
Market at a Glance - 12/19/2019
|
|
By:
Christopher Mistal
|
December 19, 2019
|
|
|
|
12/19/2019: Dow 28376.96 | S&P 3205.37 | NASDAQ 8887.22 | Russell 2K 1667.09 | NYSE 13831.67 | Value Line Arith 6625.64
Fundamental: Improving. U.S. labor market remains firm with unemployment declining to 3.5% and 266,000 net new jobs added in November. A firm labor market should continue to support consumers. Estimates of Q4 U.S. GDP are improving. Atlanta Fed’s GDPNow model is forecasting 2.3%. Trade outlook also appears to be improving with a Phase 1 deal with China and USMCA advancing through Congress. Corporate earnings are also forecast to improve in 2020.
Technical: Breaking Out. After a brief early December pause, DJIA, S&P 500 and NASDAQ are all at new all-time highs. Small caps, measured by the Russell 2000 have not traded at new highs yet, but appear to be on course to do so after finally breaking through resistance right around May’s high close.
Monetary: 1.50-1.75%. At the last scheduled meeting of the decade, the Fed left rates alone and confirmed that is where rates are likely to remain, for now. QE4, Fed balance sheet expansion, also continues in 2020. Low rates and an expanding Fed balance sheet have proven to be bullish for stocks. It would be surprising if this time was any different.
Seasonal: Bullish. January is the third month of the Best Six/Eight, but it is the last of the Best-Three-Consecutive-month span. January is the top month for NASDAQ (since 1971) averaging 2.7%, but it has slipped to sixth for DJIA and S&P 500 since 1950. Election-year Januarys have been weaker (DJIA -0.01%, S&P 500 +0.2% NASDAQ +1.7%). The Santa Claus Rally ends on January 3rd and the First Five Days early-warning system ends on the 8th. Both indicators provide an early indication of what to expect in 2020. We will wait until the official results of the January Barometer on January 31 are in before tweaking our 2020 Annual Forecast. Email Alerts will be sent after the close on these dates.
Psychological: Holiday cheer. According to
Investor’s Intelligence Advisors Sentiment survey bulls are at 57.7%. Correction advisors are at 25.0% and Bearish advisors are 17.3%. New all-time highs, bullish yearend seasonality and the holiday season typically cause high levels of bullish sentiment from now until well into the New Year.
|
2019 Free Lunch Stocks Served: 13 New Lows Make the Cut
|
|
By:
Jeffrey A. Hirsch & Christopher Mistal
|
December 21, 2019
|
|
|
|
Publication Note: On Thursday, December 26th we will deliver to you our last regularly scheduled Alert of 2019 covering the January 2020 Almanac and Strategy Calendar. Our next email will be on January 2, 2020. However, if market conditions warrant an interim update, one will be sent. Happy Holidays and Happy New Year!
Our “Free Lunch” strategy is purely a short-term strategy reserved for the nimblest traders. Traders and investors tend to get rid of their losers near yearend for tax loss purposes, often driving these stocks down to bargain levels. Our research has shown that NYSE stocks trading at a new 52-week low on or about December 15 will usually outperform the market by February 15 in the following year. We have found that the most opportune time to compile our list is on the Friday of December quarterly options and index futures expiration – AKA Triple Witching Day.
This strategy takes advantage of several year-end patterns and indicators. First, the stocks selected are usually technically, deeply oversold and poised for a bounce, dead cat or otherwise. Second, all of the stocks are of the small- and mid-cap variety that will benefit from the January Effect which is the tendency for small-caps to outperform large-caps from mid-December through February. Lastly, the strategy spans the usually bullish Santa Claus Rally and the First Five Days of January.
To be included in this year’s list, the stock must have traded at a new 52-week low on Friday, December 20, 2019. To remain on this year’s list, the stock had to still be trading at $1.00 or higher as several online trading platforms place additional restrictions on a trade when shares are below $1.00. Furthermore, the stock must have traded at least 50,000 shares on average over the past 20 days. Then, any stock that was not down 40% or more from its 52-week high to the 52-week low reached on Friday was also eliminated. Finally, preferred stocks, funds, splits, special high dividends and new issues were eliminated. No stocks from the American Stock Exchange made the cut.
Our suggested guidelines for trading these Free Lunch stocks is to initiate a position at a price no greater or less than 2% of Friday’s closing price and to implement an 8% trailing stop on a closing basis from your execution prices. If the stock closes below 8% of the execution price or a subsequent high watermark, then the stock would be closed out of the portfolio. If any of these stocks trades in a window between -2% to +2% of Friday’s closing price it will be tracked in the Almanac Investor Stock Portfolios using the trade’s execution price with an 8% trailing stop on closing basis.
If you buy these stocks, please note the following:
1. Consider selling them as soon as you have a significant gain and utilize stop losses.
2. The stocks all behave differently and there is no automatic trigger point to sell at.
3. Standard trading rules from the Almanac Investor Stock & ETF Portfolios do not apply for these stocks.
4. We think you should be out of all of these stocks between the middle of January and the middle of February.
5. Also, be careful not to chase these stocks if they have already run away.
DISCLOSURE NOTE: Officers of the Hirsch Organization do not currently own any of the shares mentioned. However, we may participate in the Free Lunch Strategy.
|
January Almanac: Not as Strong in Election Years
|
|
By:
Christopher Mistal & Jeffrey A. Hirsch
|
December 26, 2019
|
|
|
|
January has quite a reputation on Wall Street as an influx of cash from yearend bonuses and annual allocations typically propels stocks higher. January ranks #1 for NASDAQ (since 1971), but fifth on the S&P 500 and sixth for DJIA since 1950. It is the end of the best three-month span and holds a full docket of indicators and seasonalities.
DJIA and S&P rankings did slip from 2000 to 2016 as both indices suffered losses in ten of those seventeen Januarys with three in a row, 2008, 2009 and 2010 and then again in 2014 to 2016. January 2009 has the dubious honor of being the worst January on record for DJIA (-8.8%) and S&P 500 (-8.6%) since 1901 and 1931 respectively. Last year, January was downright stellar after the worst December since 1931 for DJIA and S&P 500.
In election years, Januarys have been weaker. DJIA and S&P 500 slip to number #8 while S&P 500 average performance dips negative. NASDAQ slips to #3, but average performance remains respectable at 1.7%.
On pages 110 and 112 of the Stock Trader’s Almanac 2020 we illustrate that the January Effect, where small caps begin to outperform large caps, actually starts in mid-December. Early signs of the January Effect can be seen when comparing iShares Russell 2000 (IWM) to SPDR S&P 500 (SPY) since December 16. The majority of small-cap outperformance is normally done by mid-February, but strength can last until mid-May when indices typically reach a seasonal high.
The first indicator to register a reading in January is the Santa Claus Rally. The seven-trading day period began on the open on December 24 and ends with the close of trading on January 3. Normally, the S&P 500 posts an average gain of 1.3%. The failure of stocks to rally during this time tends to precede bear markets or times when stocks could be purchased at lower prices later in the year.
On January 8, our First Five Days “Early Warning” System will be in. In pre-presidential election years this indicator has a solid record. In the last 17 presidential election years 14 full years followed the direction of the First Five Days. The full-month January Barometer has a slightly softer record in presidential-election years with 12 of the last 17 full years following January’s direction.
Our flagship indicator, the January Barometer created by Yale Hirsch in 1972, simply states that as the S&P goes in January so goes the year. It came into effect in 1934 after the Twentieth Amendment moved the date that new Congresses convene to the first week of January and Presidential inaugurations to January 20.
The long-term record has been stupendous, an 85.5% accuracy rate, with only ten major errors in 69 years. Major errors occurred in the secular bear market years of 1966, 1968, 1982, 2001, 2003, 2009, 2010 and 2014 and again in 2016 as a mini bear came to an end. The tenth and most recent error was in 2018 as a hawkish Fed continued to hike rates even as economic growth slowed and longer-term interest rates fell. The market’s position on January 31 will give us a good read on the year to come. When all three of these indicators are in agreement it has been prudent to heed their call.
| January (1950-2019) |
| |
DJI |
SP500 |
NASDAQ |
Russell 1K |
Russell 2K |
| Rank |
|
6 |
|
5 |
|
1 |
|
4 |
|
3 |
| #
Up |
|
45 |
|
43 |
|
32 |
|
26 |
|
23 |
| #
Down |
|
25 |
|
27 |
|
17 |
|
15 |
|
18 |
| Average
% |
|
1.0 |
|
1.1 |
|
2.8 |
|
1.2 |
|
1.7 |
| 4-Year Presidential Election Cycle Performance
by % |
| Post-Election |
|
0.6 |
|
0.8 |
|
2.3 |
|
1.6 |
|
1.8 |
| Mid-Term |
|
-0.5 |
|
-0.7 |
|
0.01 |
|
-0.6 |
|
-0.6 |
| Pre-Election |
|
3.9 |
|
4.1 |
|
6.8 |
|
3.4 |
|
3.9 |
| Election |
|
-0.01 |
|
0.2 |
|
1.7 |
|
0.1 |
|
1.2 |
| Best & Worst January by % |
| Best |
1976 |
14.4 |
1987 |
13.2 |
1975 |
16.6 |
1987 |
12.7 |
1985 |
13.1 |
| Worst |
2009 |
-8.8 |
2009 |
-8.6 |
2008 |
-9.9 |
2009 |
-8.3 |
2009 |
-11.2 |
| January Weeks by % |
| Best |
1/9/76 |
6.1 |
1/2/09 |
6.8 |
1/12/01 |
9.1 |
1/2/2009 |
6.8 |
1/9/87 |
7.0 |
| Worst |
1/8/16 |
-6.2 |
1/8/16 |
-6.0 |
1/28/00 |
-8.2 |
1/8/16 |
-6.0 |
1/8/16 |
-7.9 |
| January Days by % |
| Best |
1/17/91 |
4.6 |
1/3/01 |
5.0 |
1/3/01 |
14.2 |
1/3/01 |
5.3 |
1/21/09 |
5.3 |
| Worst |
1/8/88 |
-6.9 |
1/8/88 |
-6.8 |
1/2/01 |
-7.2 |
1/8/88 |
-6.1 |
1/20/09 |
-7.0 |
| First Trading Day of Expiration Week: 1990-2019 |
| #Up-#Down |
|
17-13 |
|
13-17 |
|
12-18 |
|
11-19 |
|
11-19 |
| Streak |
|
D3 |
|
D3 |
|
D7 |
|
D7 |
|
D7 |
| Avg
% |
|
-0.03 |
|
-0.08 |
|
-0.08 |
|
-0.1 |
|
-0.2 |
| Options Expiration Day: 1990-2019 |
| #Up-#Down |
|
19-11 |
|
18-12 |
|
17-13 |
|
18-12 |
|
18-12 |
| Streak |
|
U9 |
|
U5 |
|
U5 |
|
U5 |
|
U5 |
| Avg
% |
|
0.07 |
|
0.07 |
|
-0.01 |
|
0.07 |
|
0.1 |
| Options Expiration Week: 1990-2019 |
| #Up-#Down |
|
16-14 |
|
12-18 |
|
17-13 |
|
12-18 |
|
16-14 |
| Streak |
|
U2 |
|
U2 |
|
U2 |
|
U2 |
|
U2 |
| Avg
% |
|
-0.1 |
|
-0.08 |
|
0.1 |
|
-0.08 |
|
0.01 |
| Week After Options Expiration: 1990-2019 |
| #Up-#Down |
|
16-14 |
|
18-12 |
|
17-13 |
|
18-12 |
|
22-8 |
| Streak |
|
U5 |
|
D1 |
|
U5 |
|
D1 |
|
U5 |
| Avg
% |
|
-0.2 |
|
-0.07 |
|
0.07 |
|
-0.04 |
|
0.2 |
| January 2020 Bullish Days: Data 1999-2019 |
| |
2,
3, 27, 28 |
6,
9, 10, 16 |
2,
8-10, 16 |
6,
9, 10 |
9, 10, 16 |
| |
|
23,
27 |
24,
28 |
23,
27 |
28, 31 |
| January 2020 Bearish Days: Data 1999-2019 |
| |
8,
17, 22 |
13 |
22 |
None |
21, 30 |
| |
|
|
|
|
|
|
January 2020 Strategy Calendar
|
|
By:
Christopher Mistal
|
December 26, 2019
|
|
|
|
|
Seasonal Sector Trades: Copper Strength Begins Early
|
|
By:
Christopher Mistal & Jeffrey A. Hirsch
|
December 12, 2019
|
|
|
|
Copper has a tendency to make a major seasonal bottom in November/December and then a tendency to post major seasonal peaks in April or May. This pattern could be due to the buildup of inventories by miners and manufacturers as the construction season begins in late-winter to early-spring. Auto makers are also preparing for the new car model year that often begins in mid- to late-summer. Traders can look to go long a May futures contract on or about December 13 and hold until about February 24. In this trade’s 47-year history, it has worked 31 times for a success rate of 66.0%. After four straight years of declines from 2012 to 2015, this trade has been successful the last three years with increasing potential gains.
Cumulative profit, based upon a single futures contract excluding commissions and fees, is a respectable $79,513. About one-fourth of that profit came in 2007, as the cyclical boom in the commodity market magnified that year’s seasonal price move. However, this trade has produced other big gains per single contract, such as a $14,475 gain in 2011, and even back in 1973, it registered another substantial $9,475 gain. These numbers show this trade can produce big wins and big losses if not properly managed. A basic trailing stop loss could have mitigated many of the historical losses.
![[Long Copper (May) Trade History Table]](/UploadedImage/AIN_0120_20191212_HG_History.jpg)
In the following chart, the front-month copper futures weekly price moves and seasonal pattern are plotted. Typical seasonal strength in copper is highlighted in yellow in the lower pane of the chart. Last year’s seasonal period was essentially text-book perfect. Copper did make a lower low in early-January 2019 compared to December’s low and it rallied to highs in April. Unlike last year, copper appears to have already begun its seasonal rally after bottoming in late-August/early September. A trade deal with China, even a modest improvement such as a Phase 1 deal, could boost confidence and produce a corresponding bump in economic growth. Recent rate cuts by the Fed have translated into lower mortgage rates which could also eventually lead to a better housing market outlook and a corresponding rise in copper.
![[Copper (HG) Bars and Seasonal Pattern Chart (Weekly Data December 2018 – December 12, 2019)]](/UploadedImage/AIN_0120_20191212_HG_Seasonality.jpg)
One option to take advantage of copper’s seasonal move is iPath Series B Bloomberg Copper Sub-Index TR ETN (JJC). As a reminder, ETNs differ from ETFs. An ETN is debt whose current value is based upon the returns of the index it was designed to track. In the case of JJC, it is linked to the Bloomberg Copper Sub-Index Total Return, which represents the potential return of an unleveraged investment in one or more relevant futures contracts plus the rate of interest that could be earned on cash invested in specific Treasury bills. JJC trading volume is quite thin, trading just a few thousand shares per day on average. Volume does pick up when copper begins to move, but we will pass on JJC.
A second option that provides exposure to the copper futures market without having to have a futures trading account, is United States Copper (CPER). This ETF tracks the daily performance of the SummerHaven Dynamic Copper Index Total Return. CPER’s daily volume is also on the light side, but it does appear to be more liquid that JJC. Stochastic, relative strength and MACD technical indicators applied to CPER are all positive now. A position in CPER can be considered on dips below $17.50. If purchased an initial stop loss of $16.45 is suggested. This trade will be tracked in the Almanac Investor Sector Rotation ETF Portfolio.
![[United States Copper (CPER) Daily Bar Chart]](/UploadedImage/AIN_0120_20191212_CPER.jpg)
Another way to gain exposure to copper and its seasonally strong period is through the companies that mine and produce copper. Global X Copper Miners ETF (COPX) holds shares of some of the largest copper miners and producers from across the globe. Its top five holdings as of December 12, 2018 are: Freeport-McMoRan, First Quantum, Southern Copper, Kaz Minerals and Zijin Mining. COPX could be considered on dips below $19.55. If purchased, an initial stop loss of $17.85 is suggested. This trade will also be tracked in the Sector Rotation section of the ETF Portfolio.
![[Global X Copper Miners ETF (COPX) Daily Bar Chart]](/UploadedImage/AIN_0120_20191212_COPX.jpg)
Yet another option to trade seasonal strength in copper is through the use of highly correlated stocks. One common name that fits nicely is Southern Copper (SCCO). It is highly correlated with the price of copper, pays a dividend and has a reasonable valuation. SCCO could be considered on dips below $40.20. If purchased an initial stop loss at $36.75 is suggested. This stock trade will be tracked in the Almanac Investor Stock Portfolio.
|
ETF Trades & Updates: Energy in Season and Still Time to Accumulate
|
|
By:
Christopher Mistal
|
December 05, 2019
|
|
|
|
Tomorrow morning the Bureau of Labor Statistics will release its Employment Situation report for November. Depending upon your preferred source, the consensus estimate is for a gain of approximately 178,000 net new nonfarm jobs. This would be much better than the 67,000 that ADP reported yesterday. Historically, the market has responded favorably to the jobs report released in December. S&P 500, NASDAQ, Russell 1000 and Russell 2000 have all advanced fourteen times in the last nineteen years. DJIA’s record has one more loss. Average gains range from a low of 0.31% by DJIA to 0.66% by Russell 2000. Last year’s rout does drag down historical average performance, but the overall trend spanning the last nineteen years remains bullish.
New December Seasonality
Oil companies typically come into favor in mid-December and remain so until late April or early May in the following year (yellow box in chart below). This trade has averaged 11.1%, 6.2%, and 8.9% gains over the last 15-, 10-, and 5-year periods. This seasonality is not based upon the commodity itself (crude oil or natural gas); rather it is based upon NYSE ARCA Oil & Gas index (XOI). This price-weighted index is composed of major companies that explore for and produce oil and gas.
Crude oil and XOI have been under pressure since late-April and natural gas has been languishing even longer. Slowing growth, domestic and globally, along with improvements in energy efficiency and production have kept prices for energy in check. The end of the driving season in September also contributed to declines and the anticipation of the start of the next driving season in May is what is likely to trigger a rally in the sector soon. Given current fundamentals the rally could be below average, but if the outlook for trade and growth does improve between now and then, oil & gas related shares could enjoy an above average rally.
![[NYSE Arca Oil Index (XOI) Weekly Bars and Seasonal Pattern since 11/9/1984]](/UploadedImage/AIN_0120_20191205_XOI_Seasonality.jpg)
SPDR Energy (XLE) is the top pick to trade this seasonality. A new position in XLE could be established near current levels up to a buy limit of $59.25. Employ a stop loss of $53.33. Take profits at the auto sell of $82.28. Exxon Mobil is the top holding in XLE at 22.46%. The remaining top five holdings of XLE are Chevron, Phillips 66, ConocoPhillips and Schlumberger.
Sector Rotation ETF Portfolio Update
Even though the market has weakened modestly to start off December, the Sector Rotation ETF Portfolio has held up. Vanguard REIT (VNQ) is the sole losing position, down a modest 0.4% since mid-October. iShares NASDAQ Biotech (IBB) is at the other end of the performance spectrum, up 19.5% since mid-October. Overall the entire portfolio is up an average of 6.1%.
With the exception of SPDR Gold (GLD) and iShares DJ US Telecom (IYZ), all other positions can still be considered on dips or at current levels up to their respective buy limits. There is ample time remaining of the Best Months and individual sector seasonalities for these positions to rise further. GLD and IYZ are on Hold as their corresponding sector seasonalities comes to an end in December. Semiconductor strength has also traditionally ended in December, but more recently strength has been lasting longer. Please see table for updated buy limits and stop losses.
Tactical Seasonal Switching Strategy Portfolio Update
Our overall outlook remains bullish for the Best Months. Thus far, despite the occasional setback, this has been the correct view as the average gain in the Tactical Seasonal Switching portfolio is 5.5% since we issued our Seasonal Buy Signal. iShares Russell 2000 (IWM) is still the best performing position, up 7.5%. The laggard so far is SPDR DJIA (DIA) as ongoing trade concerns appear to have the greatest impact on the 30 stocks that comprise the DJIA.
Historically the first half of December has experienced some weakness, but typically around mid-month, or shortly thereafter, the rally has resumed. Any weakness this December could be used to add to existing positions or to establish new positions. All positions in the portfolio can be considered on dips below their respective buy limits.
Please note, these positions are intended to be held until we issue corresponding Seasonal MACD Sell Signals next year after April 1. As a result, no stop loss is suggested on these positions.