|
Market at a Glance
|
|
By:
Christopher Mistal
|
January 31, 2015
|
|
|
1/28/2015: Dow 17191.37 | S&P 2002.16 | NASDAQ 4637.99 | Russell 2K 1175.12 | NYSE 10603.86 | Value Line Arith 4572.69
Psychological: Resilient. Despite frequent and numerous down days this month, Investor’s Intelligence Advisors Sentiment survey is still showing bulls at 53.1%. And why not, for all the volatility the market is still just a handful of percentage points from its all-time highs. Consumers are also in a good mood as falling gasoline prices have lifted confidence which is likely to lead to increased spending.
Fundamental: Solid. December’s employment report showed 252,000 net jobs added in the month while the unemployment rate declined to 5.6% and today weekly jobless claims fell to their lowest level in almost 15 years. Tomorrow we will see how the U.S. economy did in the final quarter of 2014. Expectations are for a mid-3 percent reading. Not quite as nice as the previous quarter’s 5%, but much better than the 2% it was stuck at. According to S&P Capital IQ, corporations are also doing reasonably well with a 74% earnings beat rate with slightly more than 20% of S&P 500 reporting so far.
Technical: Consolidating. For all the concern about volatility and January’s performance, DJIA, S&P 500 and NASDAQ are still consolidating the gains from their respective early-November breakouts. It has not been a textbook process as DJIA, S&P 500 and NASDAQ have all closed below their breakout levels and their 50-day moving averages, but they are attempting to bounce back again today. Should they fail to find support, then the next key level to watch would be the 200-day moving average, DJIA 17000, S&P 500 1975 and NASDAQ 4465.
Monetary: 0-0.25%. Once again the Fed has reminded us that it is taking a “wait and see” approach to normalizing interest rates. The only issue with this is; are they seeing the big picture? They acknowledged inflation is falling, but noted this was a transitory event due primarily to falling energy prices. At last check, the ex-food and energy price gauge was also falling. The Fed also cited improving labor market indicators. Sure, there are many of these, initial weekly claims, the headline unemployment rate, but they seem to overlook the fact that the U.S. labor participation rate is at its lowest level in decades. This would seem to imply far more slack than other metrics. The Fed’s assumption, based upon the data they choose to look at, is economic activity is solid, the labor market is improving and inflation will be on its way which will necessitate raising interest rates. This may not be entirely that accurate.
Seasonal: Tepid. The Best Consecutive Three Month Span, November to January, is coming to an end. February can be the weak link in the Best Six/Eight Months. Since 1950, February performance: DJIA +0.1%, S&P 500 –0.03%, NASDAQ +0.6% (since 1971). Pre-election-year forces do give February a modest boost DJIA +1.0%, S&P 500 +0.8% and NASDAQ +2.4%.
|
Underlying Strength Should Support Market and Lift Higher
|
|
By:
Jeffrey A. Hirsch & Christopher Mistal
|
January 31, 2015
|
|
|
Santa Claus failed to call on Wall Street in 2015. The January Barometer looks likely to be a downer unless the S&P 500 can rally 37 points tomorrow to close positive for the month. This is only about 1.8% and is not inconceivable. However, market action so far this year has been weak and mostly negative. This has been fueled by plummeting oil prices, weakness overseas, confusion about the Fed’s next move and it’s bellowing about low inflation. Our 24/7 business news cycle has certainly fanned the flames.
Yes, Santa’s absence and a down January are bad omens, but they do not guarantee unmitigated market catastrophe. The First Five Days were positive and the Dow’s December closing low has not been breached as of yet. Our antennae are purring and additional caution and prudence is being applied to our portfolios, trades and open positions. While this all sounds horrible and feels painful, if you take a step back things are not really that bad.
Lower oil and energy prices, while a drain on energy companies and the people they employ, puts a lot of money back in the pockets of individuals to put into the economy and the stock market. European quantitative easing funds are likely to find their way into the U.S. stock market where prospective returns are greater. While a host of big names had earnings misses that rocked the major indices, the bulk of companies reporting so far have beaten or met forecasts. The big name misses and index declines are masking underlying strength. Take a look at the expanding new highs in the Pulse of the Market Below. Jobless claims came in today at the lowest since April 2000 and other economic data continue to show healthy expansion.
The market is only down about 5% from the highs and whether or not January ekes out a positive number we expect further moves both higher and lower. Volatility is back and here to stay. Expect more of it moving forward this year and beyond. There is another full-blown bear market lurking in the not too distant future and it may even commence in 2015, but we do not believe it has begun just yet and expect higher prices before the any bear market or major correction.
After this correction that may continue into February, look for another push higher. As we detailed in our Annual Forecast we expect a high most likely in the first half of 2015 around Dow 19000, S&P 2250 and NASDAQ 5000, slightly higher or lower than NASDAQ’s all-time high. The rest of 2015 should see a move sideways to slightly higher with volatility and corrections and an ultimate high near yearend 2015.
Pulse of the Market
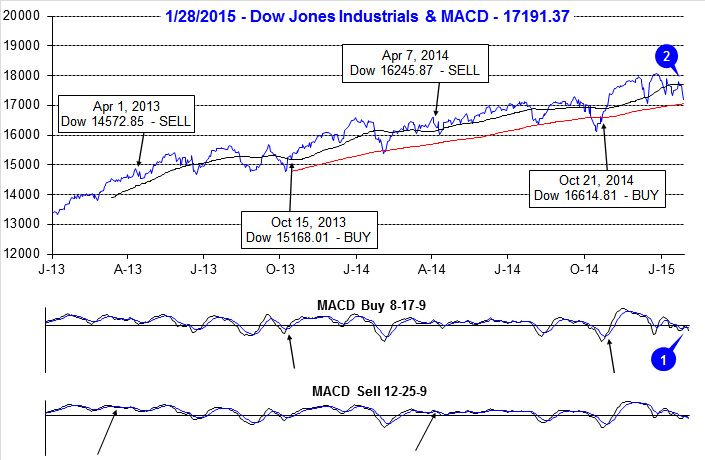
After wrapping up the fourth quarter of 2014, DJIA has struggled in the New Year. Both the faster and slower MACD indicators were positive on the first trading day of the year, but treading lower and on the second trading day, both turned negative (1) and remain so as of yesterday’s close. With the exception of four trading days, DJIA has spent nearly the entire month of January below its 50-day moving average (2). However, it important 200-day moving average has not been breached. This key level is currently at 16,978. A close below this level would also be a close below DJIA’s December closing low which has historically been a cause for heightened caution.
Should DJIA finish the week near current its current level, it will be the fourth losing week (3) out of the last five. At the end of the current streaks second weekly decline, DJIA recorded its first Down Friday/Down Monday (DF/DM) of 2015 (4). The long-term record of DF/DMs was distorted by Fed QE, but now that QE has ended, DJIA appears to be returning to the trend of further weakness following a DF/DM. In previous bull markets since 2003, DJIA recorded an average 3.8% decline over the next 24 calendar days following a DF/DM. A decline of this magnitude would put DJIA just below its current 200-day moving average.
This week’s declines will also extend S&P 500 (5) and NASDAQ (6) losing streaks to four of the last five weeks. The last similar streak began in early-September of last year and ended in mid-October with five declining weeks out of six. The end of that streak coincided closely with our Seasonal MACD Buy signal and proved to be a good opportunity to establish new long positions or add to existing ones.
Last week’s gains were accompanied by a favorable ratio of Weekly NYSE Advancers to Decliners (7). This is not likely to be the case this week. Interestingly, NYSE New Highs continued to expand (8) even as the major indices have struggled. This could indicate that there is more underlying strength in the overall market than the currently struggling indices imply.
Moody’s AAA Corporate Rate (9) is also continuing to decline indicating solid demand for high-rated corporate debt. AAA-rated companies will be able to borrow cheaply keeping stock buybacks and dividend increases on the rise, both of which have generally been bullish for the market.
Click for larger graphic…
|
February Almanac: Not Great After Down January
|
|
By:
Jeffrey A. Hirsch & Christopher Mistal
|
January 31, 2015
|
|
|
February is up only slightly more than half the time since 1950, and depending on the index, up or down marginally on average. However, small cap stocks, benefiting from “January Effect” carry over; tend to outpace large cap stocks in February. The Russell 2000 index of small cap stocks turns in an average gain of 1.1% in February since 1979—just the seventh best month for that benchmark.
In pre-election years, February’s performance generally improves with average returns all turning positive. NASDAQ performs best, gaining an average 2.4% in pre-election-year Februarys since 1971. Russell 2000 is second best, averaging gains of 2.1% since 1979. DJIA, S&P 500 and Russell 1000, the large-cap indices, tend to lag with average advances of around 1.0%.
However, February does not have a solid track record when full-month January was negative. Going back to 1950, DJIA has declined 23 times in January, S&P 500 25 times and NASDAQ (since 1971) 15 times. Regardless of index, the following February was down more often than up and the average performance was solidly negative.
The first trading day is bullish and DJIA, S&P 500 and NASDAQ have traded higher in 10 of the past 12 years. Average gains on the first day over this 12-year period are right around 0.5%. Strength then tends to fade after that until the stronger eighth, ninth and eleventh trading days. Expiration week has a spotty longer-term record, but the week after has a clear negative bias with averages losses across the board over the past 25 years.
Presidents’ Day is the lone holiday that exhibits weakness the day before and after (Stock Trader’s Almanac 2015, page 88). The Friday before this mid-winter three-day break is exceptionally treacherous and average declines persist for three trading days after the holiday going back to 1980.
| February (1950-2014) |
| |
DJI |
SP500 |
NASDAQ |
Russell 1K |
Russell 2K |
| Rank |
|
8 |
|
11 |
|
9 |
|
11 |
|
7 |
| # Up |
|
38 |
|
36 |
|
34 |
|
22 |
|
21 |
| # Down |
|
27 |
|
29 |
|
20 |
|
14 |
|
15 |
| Average % |
|
0.1 |
|
-0.03 |
|
0.6 |
|
0.2 |
|
1.1 |
| 4-Year Presidential Election Cycle Performance by % |
| Post-Election |
|
-1.6 |
|
-1.8 |
|
-3.9 |
|
-1.9 |
|
-2.0 |
| Mid-Term |
|
1.0 |
|
0.7 |
|
1.0 |
|
1.3 |
|
1.9 |
| Pre-Election |
|
1.0 |
|
0.8 |
|
2.4 |
|
1.1 |
|
2.1 |
| Election |
|
-0.1 |
|
0.1 |
|
2.8 |
|
0.3 |
|
2.5 |
| Best & Worst February by % |
| Best |
1986 |
8.8 |
1986 |
7.1 |
2000 |
19.2 |
1986 |
7.2 |
2000 |
16.4 |
| Worst |
2009 |
-11.7 |
2009 |
-11.0 |
2001 |
-22.4 |
2009 |
-10.7 |
2009 |
-12.3 |
| February Weeks by % |
| Best |
2/1/08 |
4.4 |
2/6/09 |
5.2 |
2/4/00 |
9.2 |
2/6/09 |
5.3 |
2/1/91 |
6.6 |
| Worst |
2/20/09 |
-6.2 |
2/20/09 |
-6.9 |
2/9/01 |
-7.1 |
2/20/09 |
-6.9 |
2/20/09 |
-8.3 |
| February Days by % |
| Best |
2/24/09 |
3.3 |
2/24/09 |
4.0 |
2/11/99 |
4.2 |
2/24/09 |
4.1 |
2/24/09 |
4.5 |
| Worst |
2/10/09 |
-4.6 |
2/10/09 |
-4.9 |
2/16/01 |
-5.0 |
2/10/09 |
-4.8 |
2/10/09 |
-4.7 |
| First Trading Day of Expiration Week: 1990-2014 |
| #Up-#Down |
|
15-10 |
|
18-7 |
|
14-11 |
|
18-7 |
|
16-9 |
| Streak |
|
D2 |
|
U1 |
|
U1 |
|
U1 |
|
U1 |
| Avg % |
|
0.3 |
|
0.2 |
|
0.04 |
|
0.2 |
|
0.1 |
| Options Expiration Day: 1990-2014 |
| #Up-#Down |
|
12-13 |
|
10-15 |
|
8-17 |
|
10-15 |
|
10-15 |
| Streak |
|
D1 |
|
D2 |
|
D3 |
|
D2 |
|
U1 |
| Avg % |
|
-0.2 |
|
-0.3 |
|
-0.4 |
|
-0.3 |
|
-0.2 |
| Options Expiration Week: 1990-2014 |
| #Up-#Down |
|
14-11 |
|
13-12 |
|
13-12 |
|
13-12 |
|
16-9 |
| Streak |
|
D2 |
|
D1 |
|
U1 |
|
U5 |
|
U5 |
| Avg % |
|
0.3 |
|
0.01 |
|
-0.1 |
|
0.02 |
|
0.2 |
| Week After Options Expiration: 1990-2014 |
| #Up-#Down |
|
10-15 |
|
11-14 |
|
13-12 |
|
11-14 |
|
12-13 |
| Streak |
|
U3 |
|
U1 |
|
U1 |
|
U1 |
|
U1 |
| Avg % |
|
-0.6 |
|
-0.4 |
|
-0.5 |
|
-0.4 |
|
-0.3 |
| February 2015 Bullish Days: Data 1994-2014 |
| |
2, 12, 17 |
2, 9, 11, 12 |
2, 6, 9, 12 |
2, 6, 9, 11, 12 |
2, 5, 6, 9, 11-13 |
| |
|
17, 23 |
13, 23 |
17, 23 |
18, 23, 26 |
| February 2015 Bearish Days: Data 1994-2014 |
| |
19, 24 |
24 |
20, 27 |
18, 24 |
4, 19, 20, 27 |
| |
|
|
|
|
|
|
February 2015 Strategy Calendar
|
|
By:
Christopher Mistal
|
January 31, 2015
|
|
|
|
Free Lunch & Stock Portfolio Updates: Luke Warm Reception to this Year’s Basket
|
|
By:
Christopher Mistal
|
January 31, 2015
|
|
|
Let’s begin by giving credit where credit is due. Thank you Mario Draghi and all members of the European Central Bank for today’s broad market rally. Your pledge to support the economies of Europe through the purchase of more than $1 trillion euro worth of debt is the most aggressive action taken to date in an effort to stoke inflation and (hopefully) growth. Clearly this announcement has been well-received. After spending most of this month in the red, S&P 500 and NASDAQ are now positive and DJIA is just a few points away.
Today’s surge has also lifted DJIA, S&P 500 and NASDAQ back above their respective 50-day moving averages. Furthermore, stochastic and relative strength indicators have clearly turned up and MACD is confirming the momentum shift with a solid buy signal. Now let’s see if the market can follow through on today’s move in coming days and weeks.
Stock Portfolio Updates
From the last update in mid-December, through yesterday’s close, S&P 500 was 0.3% higher. Russell 2000 edged 0.4% higher over the same period while collectively the three Almanac Investor Stock Portfolios slipped 1.1%. Although the Mid-Cap portfolio was the worst performing, down 2.5%, it was the Small-Cap portfolio that delivered the bulk of the overall portfolio’s loss. This is due to the substantially heavier theoretical cash allocation to small-cap stocks compared to mid- and large-caps.
Much of the Small-cap portfolio’s losses were the result of the addition of 12 Free Lunch stocks. Of the 17-stock basket, 15 had market caps under $1billion at the time of selection. Ambassadors Group (EPAX), Tecumseh Products (TECU) and Tandem Diabetes Care (TNDM) never traded below their respective buy limits during normal trading hours and were not added to the Small-Cap portfolio. Cellcom Israel (CEL), Whiting USA Trust (WHX) and Walter Energy (WLT) turned out to be duds and selling pressure from late last year never abated. CEL, WHX and WLT all closed below their stop losses and have been closed out of the portfolio. Remaining Free Lunch positions (“Presented Date” is listed as 12/21/14, the date the basket was emailed) are on Hold as many are showing nascent uptrends on their charts. Collectively these positions were just barely above breakeven at yesterday’s close. Based upon research in Stock Trader’s Almanac 2015 (pages 106, 110 and 112), these “Free Lunch” stocks have until approximately mid-February to perform. We will remain patient, yet vigilant with the remaining positions.
Per last update, partial profits were taken on JetBlue Airways (JBLU) and United Continental Holdings (UAL). One third of JBLU was sold on December 22 when the gain first reached 40% and one third of UAL was sold using it closing price from December 11. Continue to hold remaining shares. The majority of crude oil’s decline is most likely over, but these airlines are only beginning to realize the benefits of the lower price.
Recent market volatility also hit the Large-Cap portfolio. Icahn Enterprise (IEP), Sunoco Logistic (SXL) and Steel Dynamics (STLD) were stopped out. IEP and SXL were directly impacted by crude oil’s collapse while slowing global growth concerns dragged STLD lower. Crude oil may have reached its bottom on January 13 at $44.20, but the full impact of its 60-plus percent decline is likely not fully factored into oil-related stocks yet. If oil does not briskly rebound, like many expect, oil stocks are likely to resume the move lower that they started last year.
Thus far, 2015 has not been all that favorable to the market. There was no Santa Claus Rally and until today’s gains, most of January has been spent in the red casting a pall on full-year prospects. For this reason, all positions in the portfolio are on Hold.
Click image to view full size…
Disclosure Note: At press time, officers of the Hirsch Organization, or the accounts they control, held positions in ARCO, CCIH, CEL, EPAX, HSOL, IEP, IMGN, OGXI, OXM, SJT, SSYS, STLD, SXI, UNH, WLT and WOR.
|
The Incredible January Barometer: Its Record Isn’t Perfect, But Still An Important Indicator
|
|
By:
Jeffrey A. Hirsch & Christopher Mistal
|
January 31, 2015
|
|
|
Devised by Yale Hirsch in 1972, the January Barometer has registered eight major errors since 1950 for an 87.7% accuracy ratio. This indicator adheres to propensity that as the S&P 500 goes in January, so goes the year. Of the eight major errors Vietnam affected 1966 and 1968. 1982 saw the start of a major bull market in August. Two January rate cuts and 9/11 affected 2001.The market in January 2003 was held down by the anticipation of military action in Iraq. The second worst bear market since 1900 ended in March of 2009 and Federal Reserve intervention influenced 2010 and 2014. Including the eight flat years yields a .754 batting average.
As the opening of the New Year, January is host to many important events, indicators and recurring market patterns. U.S. Presidents are inaugurated and present State of the Union Addresses. New Congresses convene. Financial analysts release annual forecasts. Residents of earth return to work and school en mass after holiday celebrations. On January’s second trading day, the results of the official Santa Claus Rally are known and on the fifth trading day the First Five Days early warning system sounds off, but it is the whole-month gain or loss of the S&P 500 that triggers our January Barometer.
And yet for some reason, every February (or sooner if January starts off poorly) our January Barometer gets raked over the coals and every attempt at disparaging this faithful indicator comes up lame. It never ceases to amaze us how our intelligent and insightful colleagues, that we have the utmost professional respect for and many of whom we consider friends, completely and utterly miss the point and fallaciously argue the shortcomings of the January Barometer. However, this year we are not waiting until this happens again. Instead, here is why the January Barometer is relevant and important.
1933 “Lame Duck” Amendment—Why JB Works
All detractors refuse to accept the fact the January Barometer exists for one reason and for one reason only: the Twentieth “Lame Duck” Amendment to the Constitution. Passage of the Twentieth Amendment in 1933 created the January Barometer. Since then it has essentially been “As January goes, so goes the year.” January’s direction has correctly forecasted the major trend for the market in most of the subsequent years.
Prior to 1934, newly elected Senators and Representatives did not take office until December of the following year, 13 months later (except when new Presidents were inaugurated). Defeated Congressmen stayed in Congress for all of the following session. They were known as “lame ducks.”
Since 1934, Congress convenes in the first week of January and includes those members newly elected the previous November. Inauguration Day was also moved up from March 4 to January 20.
January’s prognostic power is attributed to the host of important events transpiring during the month: new Congresses convene; the President gives the State of the Union message, presents the annual budget and sets national goals and priorities.
These events clearly affect our economy and Wall Street and much of the world. Add to that January’s increased cash inflows, portfolio adjustments and market strategizing and it becomes apparent how prophetic January can be. Switch these events to any other month and chances are the January Barometer would become a memory.
JB vs. All
Over the years there has been much debate regarding the efficacy of our January Barometer. Skeptics never relent and we don’t rest on our laurels. Disbelievers in the January Barometer continue to point to the fact that we include January’s S&P 500 change in the full-year results and that detracts from the January Barometer’s predicative power for the rest of the year. Others attempt to discredit the January Barometer by going further back in time: to 1925 or 1897 or some other arbitrary year.
After the Lame Duck Amendment was ratified in 1934 it took a few years for the Democrat’s heavy congressional margins to even out and for the impact of this tectonic governing shift to take effect. In 1935, 1936 and 1937, the Democrats already had the most lopsided Congressional margins in history, so when these Congresses convened it was anticlimactic. Hence our January Barometer starts in 1938.
In light of all this debate and skepticism we have compared the January Barometer results along with the full year results, the following eleven months results, and the subsequent twelve months results to all other “Monthly Barometers” using the Dow Jones Industrials, the S&P 500 and the NASDAQ Composite.
Here’s what we found going back to 1938. There were only 9 major errors. In addition to the eight major errors detailed on page 16 of the Stock Trader’s Almanac 2015: in 1946 the market dropped sharply after the Employment Act was passed by Congress, overriding Truman’s veto, and Congress authorized $12 billion for the Marshall Plan.
Including these 9 major errors, the accuracy ratio is 88.3% for the 77-year period. Including the 9 flat year errors (less than +/– 5%) the ratio is 76.6% — still effective. For the benefit of the skeptics, the accuracy ratio calculated on the performance of the following 11 months is still solid. Including all errors — major and flat years — the ratio is still a respectable 70.1%.
Now for the even better news: In the 48 up Januarys there were only 3 major errors for a 93.8% accuracy ratio. These years went on to post 16.1% average full-year gains and 11.7% February-to-December gains.
Now let’s compare the January Barometer to all other “Monthly Barometers.” For the accompanying table we went back to 1938 for the S&P 500 and the Dow — the year in which the January Barometer came to life — and back to 1971 for NASDAQ when that index took its current form.
The accuracy ratios listed are based on whether or not the given month’s move — up or down — was followed by a move in the same direction for the whole period. For example, in the 77 years of data for the S&P 500 for the January Barometer, 59 years moved in the same direction for 76.6% accuracy.
The Calendar Year ratio is based on the month’s percent change and the whole year’s percent change; i.e., we compare December 2014’s percent change to the change for 2014 as a whole. By contrast the 11-month ratio compares the month’s move to the move of the following eleven months. February’s change is compared to the change from March to January. The 12-month change compares the month’s change to the following twelve months. February’s change is compared to the change from March to the next February.
Though the January Barometer is based on the S&P 500 we thought it would clear the air to look at the other two major averages as well. You can see for yourself in the table that no other month comes close to January in forecasting prowess over the longer term.
There are a few interesting anomalies to point out though. On a calendar year basis the Dow in January is slightly better than the S&P. 2011 is a perfect example of how the DJIA just edges out for the year while the S&P does not. For NASDAQ April, September and November stick out as well on a calendar year basis, but these months are well into the year, and the point is to know how the year might pan out following January, not April, September or November. And no other month has any basis for being a barometer. January is loaded with reasons.
Being the first month of the year it is the time when people readjust their portfolios, rethink their outlook for the coming year and try to make a fresh start. There is also an increase in cash that flows into the market in January, making market direction even more important. Then there is all the information Wall Street has to digest: The State of the Union Address, FOMC meetings, 4th quarter GDP, earnings and the plethora of other economic and market data.
Myths Dispelled
In recent years new myths and/or areas of confusion have come to light. One of the biggest errors is the notion that the January Barometer is a stand alone indicator that can be used to base all of your investment decisions for the coming year on. This is simply not true and we have never claimed that the January Barometer should or could be used in this manner. The January Barometer is intended to be used in conjunction with all available data deemed relevant to either confirm or call into question your assessment of the market. No single indicator is 100% accurate so no single indicator should ever be considered in a vacuum. The January Barometer is not an exception to this.
Another myth is that the January Barometer is completely useless. Those that believe this like to point out that simply expecting the market to be higher by the end of the year is just as accurate as the January Barometer. Statistically, they are just about right. In the 77-year history examined in this article, there were only 22 full-year declines. So yes, the S&P 500 has posted annual gains 71.4% of the time since 1938. What is missing from this argument is the fact that when January was positive, the full year was also positive 87.5% of the time and when January was down the year was down 58.6% of the time. These are not the near perfect outcomes that true statisticians prefer, but once again, see the previous paragraph.
|
Mid-Month Market Update: Not Rushing to Pass Judgment
|
|
By:
Christopher Mistal
|
January 31, 2015
|
|
|
At the half-way point in January, the market is looking a bit shaky. Since their respective late-December highs, DJIA is down 4.1%, S&P 500 4.7%, NASDAQ 4.9% and Russell 2000 5.3% as of today’s close. This brings January’s decline so far to 2.8% for DJIA on up to 4.2% for Russell 2000 and these indices are now nearing their mid-December lows. All are currently trading below their 50-day moving averages (solid magenta line), but remain above their 200-day moving averages (solid red line) and projected monthly support (green dashed line). Stochastic, MACD and relative strength indicators are all negative and nearing oversold levels.
![[DJIA Daily Bar Chart]](/UploadedImage/AIN_0215_20150115_DJIA.jpg)
![[S&P 500 Daily Bar Chart]](/UploadedImage/AIN_0215_20150115_SPX.jpg)
![[NASDAQ Daily Bar Chart]](/UploadedImage/AIN_0215_20150115_NASDAQ.jpg)
![[Russell 2000 Daily Bar Chart]](/UploadedImage/AIN_0215_20150115_R2K.jpg)
Concurrent with the market’s move lower, the CBOE Volatility Index (VIX) has climbed into the low twenties. As unsettling as this may seem, particularly considering where the VIX has been in recent years (and bull markets), it did spend much of the late-nineties at or above today’s level. It simply implies we should expect daily percentage moves to widen and occur more frequently. Spikes above 30 would be more concerning and indicative of elevated fear.
Bond yields have also plunged to either record lows or close to it in recent days. Moody’s AAA Corporate Rate was 3.54% last week, its lowest level since November 2012 and just above its lowest ever reading of 3.26 touched in July 2012. The 30-year Treasury bond yield appears to have reached a record low today at 2.4%. Low long-term rates have historically been a reliable harbinger of economic trouble ahead as they tended to proceed periods of low economic growth and/or inflation.
From a global perspective, growth and deflation are a present day concern, but we do not need low rates to tell us that. Central banks around the globe have already said as much by lowering interest rates and/or announcing other stimulus measures. In fact, negative interest rates are now rather common outside of the U.S. So while our domestic data remains reasonably solid, our 10-year Treasury yield around 1.8% is rather attractive in Japan and Germany where their equivalent bonds yield less than 0.5%. Factor in a strengthening U.S. dollar and the yield difference only becomes even more attractive. Taking a longer-term view of U.S. interest rates and the stock market, falling rates over the last 33 years certainly have not hindered our stock market. S&P 500 climbed from 120 in 1981 when yields were above 15% to over 2000 today when rates are below 2%. This is a gain of nearly 1600%.
Don’t misinterpret this assessment of volatility and interest rates. I don’t expect the market to sprint immediately higher, but I also don’t expect it to completely unravel. Economic data has been mixed lately. For example, the Commerce Department reported retail sales declined 0.9% in December but the National Retail Federation said holiday sales were up 4.0% from 2013 levels. Cause for the disparity could be the fall in energy prices or the seasonal adjustment factor. Our very own January indicators also painted a mixed picture. There was no Santa Claus Rally this year, but the First Five Days did finish positive.
The bottom line is there is a great deal of noise to contend with at present, but the trend on the charts is still positive, U.S. fundamental data is generally solid and seasonality is also positive. Until a clear breakdown in trend, indicators or data presents itself; our portfolios will remain long orientated.
Today’s “surprise” move by the Swiss Central Bank (SCB), removing the currency peg it put in place over three years ago, is a good example of noise. Does the SCB really know something that the rest of the world’s central banks don’t? What’s the point of cancelling a peg that was pulling your currency lower and lowering interest rates at the same time? Why such a massive response by the rest of global markets? At #20 by GDP, Switzerland is not exactly an economic heavy hitter. They do have a reputation for stability, but honestly, this assumption should probably be reevaluated. Two large scale currency interventions in a little more than three years do not sound all that stable to me.
|
Seasonal Sector Trades: Looking for a Crude Oil Bottom
|
|
By:
Jeffrey A. Hirsch & Christopher Mistal
|
January 31, 2015
|
|
|
Crude oil has a tendency to bottom in mid-February and then rally through July (highlighted in yellow in second chart below). It is that early February low that can give traders an edge by buying ahead of a seasonally strong period. Going long crude oil’s July contract on or about February 13 and holding for approximately 60 days has been a profitable trade 25 times in 31 years for an 80.6% win ratio with a cumulative profit of $91,890 (based upon a single futures contract excluding commissions and taxes).
![[February Long Crude Oil (July) Trade History]](/UploadedImage/AIN_0215_20150113_CL-History.jpg)
Crude oil’s seasonal tendency to move higher in this time period is partly due to continuing demand for heating oil and diesel fuel in the northern states and partly due to the shutdown of refinery operations in order to switch production facilities from producing heating oil to reformulated unleaded gasoline in anticipation of heavy demand for the upcoming summer driving season. This has refiners buying crude oil in order to ramp up production for gasoline. In recent years, crude has been finding a bottom earlier. Last year, crude was weak the first three weeks of the year before rallying from around $90 per barrel to nearly $108 by mid-June.
![[Crude Oil (CL) Weekly Bars (Pit Plus Electronic) and Seasonal Pattern]](/UploadedImage/AIN_0215_20150113_CL-Seasonal.jpg)
In early December, as crude oil’s decline was accelerating, we threw our hat into the “where’s crude headed” ring. The conclusion was a seemingly ridiculous price right around $40/per with some rather basic supporting math to get to this price. As of today, the front-month February crude oil futures contract traded as low as $44.20. The velocity of crude’s decline has caught many off-guard, us included. Although, the current assessment of medium to longer-term supply/demand fundamentals does paint a gloomy outlook for oil bulls, the recent sharp move lower does seem excessive. OPEC has not blinked, nor have U.S. suppliers, but sooner or later someone will and the current excess supply on the global market will be reduced or even vanish.
With an oil-company-related holding SPDR Energy (XLE) already in the Almanac Investor ETF Portfolio, we will look to expand our holdings through the use of a crude oil futures-based ETF. United States Oil (USO) is the largest and most liquid of the futures-backed ETFs. It trades in excess of 15 million shares daily and has net assets exceeding $1 billion. USO is off nearly 60% from its 52-week high reached last year in June. Its stochastic, relative strength and MACD indicators are deeply into oversold territory. USO can be purchased on dips below $17.00. Due to crude oil’s recent trading action, we will look to build a position. This first trade will represent the first third of the total position.
|
First Five Days Early Warning Official Results: Sharp Two-Day Rally Brightens 2015 Prospects
|
|
By:
Christopher Mistal
|
January 31, 2015
|
|
|
Whew! Wow, the snapback rally over the past two and half days has put the S&P 500 positive by two hairs for January’s First Five Days. After failing to deliver a Santa Claus Rally (SCR), the S&P 500 has roared back over the past two days to post a meager 0.2% gain during the First Five Days of January. The last 41 up First Five Days (FFD) were followed by full-year gains 35 times for an 85.4% accuracy ratio and a 14.0% average gain in all 41 years. The six exceptions include flat 1994 and 2011 plus four related to war. Vietnam military spending delayed start of 1966 bear market. Ceasefire imminence early in 1973 raised stocks temporarily. Saddam Hussein turned 1990 into a bear. The war on terrorism, instability in the Mideast and corporate malfeasance shaped 2002 into a tough year.
In pre-presidential election years this indicator has a solid record. In the last 16 pre-presidential election years 12 full years followed the direction of the First Five Days; however, 2007 and 2011 did not. The full-month January Barometer (STA 2015, page 16) has an even better record as 14 of the last 16 full years have followed January’s direction.
A positive FFD has improved the outlook for 2015 following a down SCR. This will be just the fourth time since 1950 that the S&P 500 has recorded this combination. The worst full-year outcome was flat midterm year 1994. We will withhold further judgment until the January Barometer gives its official reading at month’s end. The December Low Indicator (2015 STA, page 44) should also be watched with the line in the sand the Dow’s December Closing Low of 17068.87 on 12/16/14.
|
ETF Trades: Cold Winter Could Heat Up Natural Gas
|
|
By:
Christopher Mistal
|
January 31, 2015
|
|
|
Based upon the NYSE ARCA Natural Gas Index (XNG) there is a seasonal tendency for natural gas companies to enjoy gains from the end of February through the beginning of June. Detailed in the Stock Trader’s Almanac 2015 on page 94, this trade has returned 17.7%, 11.5%, and 9.8% on average over the past 15, 10, and 5 years respectively. Concurrent with this is a featured trade on page 32 of the Commodity Trader’s Almanac 2013 that is based upon natural gas, the commodity.
One of the factors for this seasonal price gain is consumption driven by demand for heating homes and businesses in the northern cold weather areas in the United States. In particular, when December and January are colder than normal, we see depletions in inventories through February. This has a tendency to cause price spikes lasting through mid-April. This was precisely the situation in December 2013 through February 2014 when natural gas rallied from around $3.75/mmBtu to nearly $6.00/mmBtu.
A relatively mild start to winter this year combined with plunging crude oil prices has sent natural gas back below $3/mmBtu this week, even as many parts of the U.S. are unseasonably cold. Inventories are healthier now than a year ago, but are still below the 5-year average for this time of year. This combination of a recent sharp price decline and below average inventories represents an excellent opportunity for new long positions, especially with the coldest winter months still ahead.
First Trust ISE-Revere Natural Gas (FCG) is an excellent choice to gain exposure to the company side of the natural gas sector. FCG can be bought on dips below $10.03. Once purchased, use a stop loss of $9.04 and take profits at the auto sell, $12.99. Top five holdings by weighting as of yesterday’s close are: Talisman Energy, Matador Resources, SM Energy, Comstock Resources and Devon Energy. The net expense ratio is reasonable at 0.6% and the fund has approximately $215 million in assets.
United States Natural Gas (UNG) is suggested to trade the commodity’s seasonality as its assets consist of natural gas futures contracts and is highly liquid with assets of nearly $700 million and average daily trading volume in excess of 10 million shares per day on average over the past three months. Its expense ratio is 1%. UNG could be bought on dips below $14.50. If purchased, set an initial stop loss at $13.12. Profits can be taken at the auto price of $18.77.
Portfolio Updates
Since last update in early December, the market is essentially flat including today’s solid gains. But, recent weakness and early December weakness did have an impact on the ETF Portfolio. PowerShares DB Agriculture (DBA) was stopped out on January 2 when it closed below its stop loss of $24.75. iShares DJ US Telecom (IYZ), iShares PHLX Semiconductor (SOXX) and Direxion Daily 20+ Year Treasury Bear 3x (TMV) were also stopped out in the first half of December. Telecom and Semiconductor seasonally favorable periods ended last month while 30-year Treasury bond weakness typically lasts until late April. Recent mixed signals from the Fed regarding interest rates makes shorting the long bond at this time too risky so no new TMV trade will be taken.
Per last month’s advice, SPDR Gold (GLD) was closed out of the portfolio using the closing price on December 4, for a modest 3.5% gain. This was a short-term trade targeting typical seasonal strength from mid-November to early December. GLD did trade modestly higher since, but is basically flat as of today.
Last month’s Seasonal Sector Trades focused on seasonal strength in copper and corn. iPath DJ-UBS Copper TR Sub-Index ETN (JJC) was added to the portfolio on December 15 and is currently down a little over 4%. Copper’s favorable period usually lasts until late February. JJC is on Hold. Teucrium Corn (CORN) never traded below its buy limit. This trade idea is being cancelled because strength typically fades in mid-January.
Aside from today’s new trade ideas, this balance of the portfolio is on Hold. January has had a spotty record in recent years, S&P 500 has declined in eight of the last fifteen, and February’s longer-term track record makes it’s the weak link of the “Best Six/Eight Months.”
Disclosure Note: At press time, officers of the Hirsch Organization, or accounts they control held positions in IBB, IWM, IYT, QQQ, SPY, UNG, VNQ, XLF, XLI and XLV.
|
December ETF Scoreboard: Crude’s Demise and Biotech’s Endless Rise
|
|
By:
Christopher Mistal
|
January 31, 2015
|
|
|
After a rough start, the market did find support in mid-December and did trade at new highs. But, the typical holiday-fueled yearend rally was cut short and December came to a close in the red due to sizable losses on the final two trading days of the year. For the month, DJIA slipped 0.03%, S&P 500 fell 0.4% and NASDAQ shed 1.2%. After lagging nearly the entire year, Russell 2000 was the overachiever in December, up 2.7%. For the year, DJIA was up 7.5%, S&P 500 11.4%, NASDAQ 13.4% and Russell 2000 3.5%. For a midterm year, the market did do better than average in 2014, but it come up short of past Sixth Years of Presidential terms.
For the year, Biotech/Pharmaceutical and Semiconductor sectors were the best, both advancing more than 30%, on average, in 2014. Healthcare, Real Estate, Utilities and Technology were also strong. Another sector whose performance is of note is Bonds. Early in 2014, Bonds seemingly had only one direction to go, down. However, sluggish growth outside the U.S., compared to relatively solid growth here, kept investor and trader demand strong. As a result, the Bond sector finished the year with an average 6.2% gain. Long-dated Treasury bonds performed the best.
At the opposite end of the spectrum were Energy (off a whopping 19.5%), Natural Resources/Gold (–10.8%), Currency and Foreign related sectors. Aside from Foreign-related ETFs, 2014’s losing sectors will likely remain weak in 2015. There will be tradable rallies, but the decade-plus commodity bull market has ended. The demise of commodities and the rise of biotechnology is possibly an early indication that the beginning of the next secular bull market is nearly here, but there will likely be at least one more substantial market washout before it begins.
December’s poor close resulted in average declines for 21 of 29 sectors tracked. The five worst performing sectors were: Energy (–6.8%), Foreign Market (–4.8%), Foreign Multinational (–4.2%), Telecom (–4.0%) and Leveraged Long (–2.6%). The Energy and Foreign sectors are well represented in the 1-Month Losers list, led by a whopping 30.5% decline by United States Natural Gas (UNG). Crashing crude oil prices also tanked Russia-related ETFs. Market Vectors Russia Trust (RSX) was the worst, off 22.0% in December. Tepid global growth, an abundance of supply and producers reluctant to cut production are all weighing on crude oil’s price. Seasonally, crude oil is likely to remain weak until late-January or early February when refiners begin to prepare for the summer driving season.
Despite a poor overall month, several bright spots were present in December. Aside from the previously mentioned small-cap outperformance, China-related funds continued to perform well in the month. Market Vectors China A-Shares (PEK) was the month’s top performing non-leveraged ETF, gaining a solid 23.5%. Second best, due to the late-month sell off, was ProShares VIX Short-Term Futures (VIXY), up 15.2% in December. SPDR Semiconductors (XSD) and iShares DJ US Broker-Dealers (IAI) also performed well, gaining 5.5% and 5.2% respectively.
New 52-Week Highs climbed slightly higher in December as major indices reached new highs late in the month, but New 52-Week Lows also expanded. Of the 317 New Highs, 168 were recorded on December 29 when the markets closed at the highs of the year. Excluding Energy, Bear/Short and Natural Resources/Gold, New Highs were produced in all other sectors. New Lows were comprised heavily of Energy, Bear/Short funds and Foreign ETFs.
Disclosure Note: At press time, officers of the Hirsch Organization, or accounts they control held a position in UNG.
|
Santa Claus Rally Official Results: Santa Fails to Visit Wall Street
|
|
By:
Jeffrey A. Hirsch & Christopher Mistal
|
January 31, 2015
|
|
|
As defined in the Stock Trader’s Almanac, the Santa Claus Rally (SCR) is the propensity for the S&P 500 to rally the last five trading days of December and the first two of January an average of 1.5% since 1950.
The lack of a rally can be a preliminary indicator of tough times to come. This was certainly the case in 2008 and 2000. A 4.0% decline in 2000 foreshadowed the bursting of the tech bubble and a 2.5% loss in 2008 preceded the second worst bear market in history.
Including this year, Santa has failed to pay Wall Street a visit in just 14 years since 1950. Of the previous 13 occasions, January’s First Five Days (FFD) was down 10 times and the January Barometer (JB) was negative 7 times. When all three indicators were negative, the full year was either flat (+/– 5.0%) or negative with the lone exception being 1982, the year the last secular bull market began.
The lack of a positive SCR is cause for concern, but further clarity will be gained when the January’s First Five Days Early Warning System (page 14, STA 2015) gives its reading later this week and when the January Barometer (page 16, STA 2015) reports at month’s end. A positive First Five Days and January Barometer would certainly improve prospects for full-year 2015. The December Low Indicator (2015 STA, page 44) should also be watched with the line in the sand the Dow’s December Closing Low of 17068.87 on 12/16/14.