|
Market at a Glance - 1/30/2020
|
|
By:
Christopher Mistal
|
January 30, 2020
|
|
|
|
1/30/2020: Dow 28859.44 | S&P 3283.66 | NASDAQ 9298.93 | Russell 2K 1648.22 | NYSE 13861.92 | Value Line Arith 6548.47
Fundamental: Mixed. Advance estimate for 2019-Q4 U.S. GDP was 2.1%. Full-year 2019 GDP was 2.3% compared to 2.9% in 2018. Growth has slowed and could still be slowing. Even though growth has slowed, employment remains solid with 145,000 net new jobs added in December and the unemployment rate is 3.5%. Analysts expect corporate earnings forecasts will improve in 2020, but upward revisions have been lacking as earnings season rolls along. The spread of China’s coronavirus globally is a concern as the potential impacts to growth remain uncertain.
Technical: Consolidating. After a steady rise from early-October through mid-January, DJIA, S&P 500 and NASDAQ appear to be taking a breather. All three indexes logged new all-time highs during the run. The rapid spread of the coronavirus may have triggered the pause and retreat, but key support at 50-day moving averages remains intact.
Monetary: 1.50-1.75%. Rates are still low and are likely to remain low. QE4 or repo market support is now expected to continue through at least April 2020. Based upon the manner in which the repo market suddenly needed support last September, it would not be surprising to see support last beyond April of this year. Fed balance sheet expansion has historically boosted the stock market and it will likely have a similar effect now.
Seasonal: Neutral. Even though February is right in the middle of the Best Six Months, its long-term track record, since 1950, is rather tepid. February ranks no better than sixth and has posted meager average gains except for the Russell 2000. In election years, February’s performance remains bland.
Psychological: Fading. According to
Investor’s Intelligence Advisors Sentiment survey Bullish advisors are at 52.8%. Correction advisors are at 28.3% and Bearish advisors are 18.9%. New all-time highs, bullish yearend seasonality and the holiday season typically cause high levels of bullish sentiment from now until well into the New Year. Just one week ago, in mid-January, bulls were at a high of 59.4%. This easing of bullish sentiment is positive and not unexpected as the market pauses to access the impacts of the coronavirus, valuations, and earnings.
|
February Outlook: Any Market Pause Likely Short-Lived
|
|
By:
Jeffrey A. Hirsch & Christopher Mistal
|
January 30, 2020
|
|
|
|
February is notoriously the weak link in “Best Six Months” so we expect the big run the market has been on since mid-October to at least take a breather in February as it often does to consolidate January gains and the gains over the first half of the “Best Six Months.” The market is also digesting a copious and volatile news flow, still elevated valuations and some consolidating technical readings.
Since our October 11, 2019 “Best Six/Eight Months” buy signal DJIA is up 7.6%, S&P 500 has gained 10.6% and NASDAQ has tacked on an impressive 15.4%. The only thing that seems to have been able to rattle this bull market at all in 2020 has been the spread of China’s coronavirus and the quarantines and travel restrictions associated with it.
However, the market has proved to be resistant, suffering a mere 2.6% drop on the S&P 500 from the January 17 high to the low so far on Monday January 27. All the damage came over two days, creating the first Down Friday/Down Monday of 2020. We examined
how epidemics have impacted the market on the blog and found that historically the market has not been greatly affected by these outbreaks.
In other news, stocks also appear to be immune to presidential impeachment trials and Brexit. This likely has much to do with Fed and the Election Cycle. The Fed is still printing lots of money and they are likely to continue to do so for some time. At the last FOMC meeting the said they had plans to continue adding liquidity to the banking repo market through April. This is basically QE4 and we suspect it the will continue well past April as banks continue to rely on the repo facility and have become accustomed to having it. An expanding Fed balance sheet is something that has been known to fuel bull markets.
In addition to this expanding Fed balance sheet the Trump administration appears to be engaging in some classic Election Year priming of the pump. Government spending has been increasing under President Trump and this massive deficit spending is running at a faster pace than last year. Federal spending for the first quarter of Fiscal 2020 ending December 2019 came in at $1.163 trillion up from $1.090 last year with a deficit for the quarter of $357 billion vs. $319 billion last year. Cleary the current administration is ramping up spending in its reelection year in typical incumbent fashion.
Finally, our flagship
January Barometer indicator is on pace to be positive unless the S&P 500 is down more than 52.88 points (–1.6%) tomorrow on January 31. This bodes well for the market in 2020. When the January Barometer has been positive in Election Years the market has been up for the year 100% of the time for an average gain of 15.6% and gained 10.6% over the remaining 11 months.
We would also hit our
January Indicator Trifecta, as the Santa Claus rally and First Five Days have already posted gains. The previous 31 occurrences of positive January Indicator Trifectas have been followed by full-year S&P 500 gains 28 times with average gains of 17.5% and gains over the next 11 months 27 times averaging 12.3%. This suggests that our base case and best case scenarios in our
2020 Annual Forecast from December 19, 2019 are on track.
Pulse of the Market
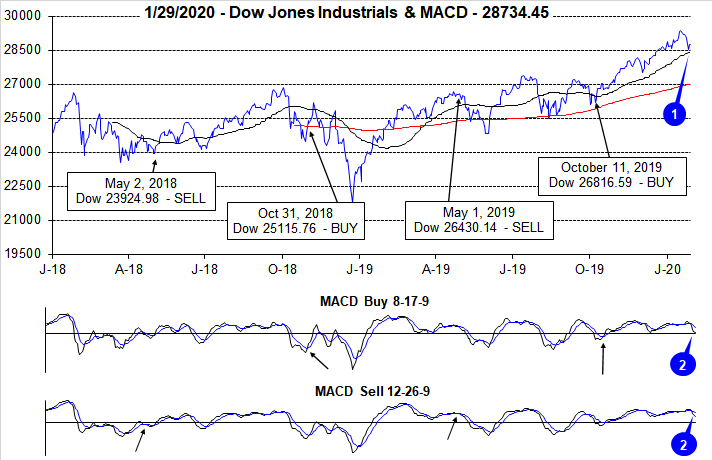
DJIA closed above the 29,000 milestone on January 15. Along the climb higher the Santa Claus Rally and the First Five Days indicator were also positive putting the market on course to complete the historically bullish January Trifecta. The march higher in January did encounter some bumps and dips, but DJIA has held and remained above its 50-day moving average (1) thus far. The global spread of China’s coronavirus is high on the list of concerns as its potential impact on growth and corporate earnings is unknown, but now that it has been officially declared an emergency by WHO, additional funding and a firmer, more aggressive response is likely. Due to the recent retreat by DJIA, both the faster and slower moving MACD indicators (2) are currently negative.
Earlier this week DJIA recorded its first
Down Friday/Down Monday (DF/DM) of the year (3). Given the historical record of DF/DMs since 2000, it would be prudent to remember that the majority of past occurrences were followed by some weakness during the next 90 calendar days. However, if DJIA’s Monday close of 28535.80 holds and DJIA quickly recovers to 29000 and/or above, then the likelihood of a more damaging retreat in the near-term is diminished.
Looking back over the last 20 weeks, S&P 500 (4) has risen in fourteen weeks; NASDAQ (5) has advanced in fifteen weeks. S&P 500 worst weekly decline was a modest 1% last week and in late September. Even NASDAQ’s 2.2% decline in September was not all that damaging. Week after week of modest gains combined with only the occasional modest pullback is evidence of a resilient market with reasonable strong underpinnings.
Market breadth measured by NYSE Weekly Advancers and NYSE Weekly Decliners (6) has remained positive with Weekly Advancers outnumbering Weekly Decliners by respectable amounts in positive weeks. Weeks where Decliners outnumber Advancers and the major indexes post a modest advance would be a concern as this could be an early indication that participation is fading and only a handful of the largest stocks are carrying the market.
Weekly New Highs may have peaked at 631, two weeks ago (7) consistent with new all-time highs by DJIA, S&P 500 and NASDAQ. That was the largest number of New Weekly Highs since December 2016. Weekly New Lows have remained subdued but have been slowly creeping higher over the past four weeks. The market’s next move will determine where these levels go from here.
CBOE Weekly Put/Call Ratio sunk as low as 0.47 last week (8). This was the lowest reading since June 2014. In the week since, the ratio has snapped back to a neutral level. If the ratio were to retreat back below 0.50 again, it would be a concern as it could foreshadow another mild retreat at a minimum.
Click for larger graphic…
|
February Almanac: Can be Challenging in Election Years
|
|
By:
Jeffrey A. Hirsch & Christopher Mistal
|
January 23, 2020
|
|
|
|
Even though February is right in the middle of the Best Six Months, its long-term track record, since 1950, is rather tepid. February ranks no better than sixth and has posted meager average gains except for the Russell 2000. Small cap stocks, benefiting from “January Effect” carry over; tend to outpace large cap stocks in February. The Russell 2000 index of small cap stocks turns in an average gain of 1.2% in February since 1979—just the sixth best month for that benchmark.
A strong February in 2000 boosts NASDAQ and Russell 2000 rankings in election years. Otherwise, February’s performance, compared to other presidential-election-year months, is mediocre at best with no large-cap index ranked better than seventh (DJIA and S&P 500 since 1950, Russell 1000 since 1979).
The first trading day is bullish for DJIA, S&P 500 and NASDAQ. Average gains on the first day over the last 21-year period are right around 0.4%. Strength then tends to fade after that until the stronger sixth, eighth, ninth and eleventh trading days. Expiration week had a spotty longer-term record but has been improving recently. Russell 1000 and Russell 2000 have advanced for 10 straight years during options expiration week. The week after also had a clear negative bias that appears to be fading even though averages losses remain across the board for the past 30 years.
Presidents’ Day is the lone holiday that exhibits weakness the day before and after (Stock Trader’s Almanac 2020, page 100). The Friday before this mid-winter three-day break can be treacherous and average declines persist for three trading days after the holiday going back to 1980.
| February (1950-2019) |
| |
DJI |
SP500 |
NASDAQ |
Russell
1K |
Russell 2K |
| Rank |
|
8 |
|
9 |
|
8 |
|
9 |
|
6 |
| #
Up |
|
42 |
|
39 |
|
27 |
|
25 |
|
24 |
| #
Down |
|
28 |
|
31 |
|
22 |
|
16 |
|
17 |
| Average
% |
|
0.3 |
|
0.1 |
|
0.7 |
|
0.4 |
|
1.2 |
| 4-Year Presidential Election Cycle Performance
by % |
| Post-Election |
|
-1.1 |
|
-1.5 |
|
-3.3 |
|
-1.3 |
|
-1.6 |
| Mid-Term |
|
0.7 |
|
0.5 |
|
0.7 |
|
0.8 |
|
1.4 |
| Pre-Election |
|
1.4 |
|
1.2 |
|
2.8 |
|
1.7 |
|
2.7 |
| Election |
|
-0.1 |
|
0.1 |
|
2.5 |
|
0.3 |
|
2.2 |
| Best & Worst February by % |
| Best |
1986 |
8.8 |
1986 |
7.1 |
2000 |
19.2 |
1986 |
7.2 |
2000 |
16.4 |
| Worst |
2009 |
-11.7 |
2009 |
-11.0 |
2001 |
-22.4 |
2009 |
-10.7 |
2009 |
-12.3 |
| February Weeks by % |
| Best |
2/1/08 |
4.4 |
2/6/09 |
5.2 |
2/4/00 |
9.2 |
2/6/09 |
5.3 |
2/1/91 |
6.6 |
| Worst |
2/20/09 |
-6.2 |
2/20/09 |
-6.9 |
2/9/01 |
-7.1 |
2/20/09 |
-6.9 |
2/20/09 |
-8.3 |
| February Days by % |
| Best |
2/24/09 |
3.3 |
2/24/09 |
4.0 |
2/11/99 |
4.2 |
2/24/09 |
4.1 |
2/24/09 |
4.5 |
| Worst |
2/10/09 |
-4.6 |
2/10/09 |
-4.9 |
2/16/01 |
-5.0 |
2/10/09 |
-4.8 |
2/10/09 |
-4.7 |
| First Trading Day of Expiration Week: 1990-2019 |
| #Up-#Down |
|
19-11 |
|
23-7 |
|
19-11 |
|
23-7 |
|
21-9 |
| Streak |
|
D1 |
|
U6 |
|
U6 |
|
U6 |
|
U6 |
| Avg
% |
|
0.3 |
|
0.3 |
|
0.2 |
|
0.3 |
|
0.2 |
| Options Expiration Day: 1990-2019 |
| #Up-#Down |
|
16-14 |
|
13-14 |
|
12-18 |
|
14-16 |
|
12-15 |
| Streak |
|
U3 |
|
U3 |
|
U1 |
|
U3 |
|
U6 |
| Avg
% |
|
-0.04 |
|
-0.2 |
|
-0.3 |
|
-0.2 |
|
-0.05 |
| Options Expiration Week: 1990-2019 |
| #Up-#Down |
|
19-11 |
|
18-12 |
|
18-12 |
|
18-12 |
|
21-9 |
| Streak |
|
U5 |
|
U5 |
|
U6 |
|
U10 |
|
U10 |
| Avg
% |
|
0.6 |
|
0.4 |
|
0.4 |
|
0.4 |
|
0.6 |
| Week After Options Expiration: 1990-2019 |
| #Up-#Down |
|
14-16 |
|
15-15 |
|
18-12 |
|
15-15 |
|
16-14 |
| Streak |
|
U4 |
|
U4 |
|
U6 |
|
U4 |
|
U2 |
| Avg
% |
|
-0.4 |
|
-0.2 |
|
-0.2 |
|
-0.2 |
|
-0.1 |
| February 2020 Bullish Days: Data 1999-2019 |
| |
3,
13, 18 |
3,
10, 12, 13, 18 |
3,
10, 12-14 |
3,
10, 12, 13, 18 |
3, 6, 12-14, 18 |
| |
|
|
18,
25, 26 |
|
19, 26, 27 |
| February 2020 Bearish Days: Data 1999-2019 |
| |
4,
21, 28 |
21,
28 |
5,
21, 28 |
21,
28 |
5, 28 |
| |
|
|
|
|
|
|
February 2020 Strategy Calendar
|
|
By:
Christopher Mistal
|
January 23, 2020
|
|
|
|
|
ETF Trades & Updates: Looking for a Seasonal Low from Natural Gas
|
|
By:
Christopher Mistal
|
January 16, 2020
|
|
|
|
Based upon the
NYSE ARCA Natural Gas Index (XNG) there is a seasonal tendency for natural gas companies to enjoy gains from the end of February through the beginning of June although the bulk of the move is usually complete in May. Detailed in the
Stock Trader’s Almanac 2020 on page 92, this trade has returned 13.3%, 13.4%, and 16.9% on average over the past 15, 10, and 5 years respectively. This seasonal strength can be seen in the following chart, highlighted in yellow.
One of the factors for this seasonal price gain is consumption driven by demand for heating homes and businesses in the cold weather northern areas in the United States. In particular, when December and January are colder than normal, we see drawdowns in inventories through late March and occasionally into early April. This has a tendency to cause price spikes lasting through mid-April and beyond. Crude oil also has a tendency to rise during this timeframe in anticipation of the summer driving season.
This winter has gotten off to a slow start in the Northeast with relatively mild temperatures thus far, but the forecast appears to be changing with colder temperatures appearing. Natural gas has been falling since a brisk run-up in late-October/early November of last year and is now quickly approaching $2 per MMBtu. Inventories are plush and its price could still go lower yet, but $2 per MMBtu has been a price where past rallies have begun around. The situation appears to be setting up well for a rebound in natural gas and the stocks of companies that supply it.
First Trust Natural Gas (FCG) is an excellent choice to gain exposure to the company side of the natural gas sector. FCG could be bought on dips below $11.55. Once purchased, consider using an initial stop loss of $10.68 and take profits at the auto sell, $14.39. Top five holdings by weighting as of yesterday’s close are: Apache Corp, Concho Resources, Murphy Oil, Devon Energy and Cimarex Energy. The net expense ratio is reasonable at 0.6% and the fund has approximately $90 million in assets.
United States Natural Gas (UNG) could be considered to trade the commodity’s seasonality as its assets consist of natural gas futures contracts and is highly liquid with assets of nearly $500 million and trades millions of shares per day. Its total expense ratio is 1.28%. UNG could be bought on dips below $16.01. If purchased, set an initial stop loss at $14.81.
Sector Rotation ETF Portfolio Update
Broad market strength in December has continued into the New Year and the overall Sector Rotation Portfolio has benefited nicely. Every position in the portfolio is now positive. As is often the situation, the portfolio has its leaders and its laggards. Since October the best performing positions have been technology related. iShares NASDAQ Biotech (IBB) is best, up 20.8% at yesterday’s close. iShares DJ US Tech (IYW), iShares PHLX Semiconductor (SOXX) and SPDR Technology (XLK) are notable standouts, all up over 16.5%. Laggards have been iShares DJ US Telecom (IYZ) and Vanguard REIT (VNQ). Both IYZ and VNQ are somewhat defensive in nature offering above average dividend yields.
Last month’s Seasonal Sector Trades ideas targeting seasonal strength in copper have been added to the portfolio list. United States Copper (CPER) was added in mid-December and is currently up 2.6%. Global X Copper Miners (COPX) has not yet traded below its buy limit. CPER and COPX can still be considered on dips below their respective buy limits.
Last month’s trade aimed at oil stocks, SPDR Energy (XLE) has also been added to the portfolio. For a brief moment it appeared as escalating tensions between the U.S. and Iran were going to kick off crude oil’s seasonally strong period early. However, tensions eased just as quickly as they rose and so did crude’s price and in turn the price of XLE. Energy has a history of volatility and is prone to spikes. XLE can still be considered on dips.
With the exception of recent trade ideas, all other positions in the portfolio are currently on Hold. Many positions have enjoyed solid gains and the broad market is headed toward a seasonally soft patch that can last from mid-January into early February. Please see table for updated buy limits and stop losses.
Tactical Seasonal Switching Strategy Portfolio Update
Even though there is the possibility of some modest seasonal weakness later this month and in February, our overall outlook remains bullish for the Best Months. In the face of a Presidential impeachment trial, an ongoing trade war, seemingly endless Mideast tensions, and an upcoming election, the market and the U.S. economy has proven resilient. A phase one trade deal and an accommodative Fed are certainly helping.
As of yesterday’s close, the Tactical Seasonal Switching Strategy portfolio has an average gain of 11.5% since our Seasonal Buy Signal. Invescos QQQ (QQQ) has reclaimed the top spot, up 15.2%. SPDR DJIA (DIA) is still the laggard. All positions in the portfolio are on Hold.
Please note, positions in the Tactical Switching Strategy portfolio are intended to be held until we issue corresponding Seasonal MACD Sell Signals after April 1. As a result, no stop loss is suggested on these positions.
|
The Incredible January Barometer: Only 11 Major Errors in 82 Years
|
|
By:
Jeffrey A. Hirsch & Christopher Mistal
|
January 09, 2020
|
|
|
|
Devised by Yale Hirsch in 1972, the January Barometer (JB) has registered ten major errors since 1950 for an 85.7% accuracy ratio. This indicator adheres to propensity that as the S&P 500 goes in January, so goes the year. Of the ten major errors Vietnam affected 1966 and 1968. 1982 saw the start of a major bull market in August. Two January rate cuts and 9/11 affected 2001.The market in January 2003 was held down by the anticipation of military action in Iraq. The second worst bear market since 1900 ended in March of 2009 and Federal Reserve intervention influenced 2010 and 2014. In 2016, DJIA slipped into an official Ned Davis bear market in January. Last year, 2018, became the tenth major error overall and the seventh since 2001 as a hawkish Fed, a trade war and slowing global growth concerns resulted in the worst fourth quarter performance by S&P 500 since 2008. Including the eight flat years yields a .743 batting average.
As the opening of the New Year, January is host to many important events, indicators and recurring market patterns. U.S. Presidents are inaugurated and present State of the Union Addresses. New Congresses convene. Financial analysts release annual forecasts. Residents of earth return to work and school en mass after holiday celebrations. On January’s second trading day, the results of the official Santa Claus Rally are known and on the fifth trading day the First Five Days early warning system sounds off, but it is the whole-month gain or loss of the S&P 500 that triggers our January Barometer.
And yet for some reason, every February or sooner if January starts off poorly our January Barometer gets raked over the coals and every attempt at disparaging this faithful indicator comes up lame. It never ceases to amaze us how our intelligent and insightful colleagues, that we have the utmost professional respect for and many of whom we consider friends, completely and utterly miss the point and argue the shortcomings of the January Barometer. However, this year we are not waiting until this happens again. Instead, here is why the January Barometer is still relevant and important.
1933 “Lame Duck” Amendment—Why JB Works
Many detractors refuse to accept the fact the January Barometer exists for one reason and for one reason only: the Twentieth “Lame Duck” Amendment to the Constitution. Passage of the Twentieth Amendment in 1933 created the January Barometer. Since then it has essentially been “As January goes, so goes the year.” January’s direction has correctly forecasted the major trend for the market in many of the subsequent years.
Prior to 1934, newly elected Senators and Representatives did not take office until December of the following year, 13 months later (except when new Presidents were inaugurated). Defeated Congressmen stayed in Congress for all of the following session. They were known as “lame ducks.”
Since 1934, Congress convenes in the first week of January and includes those members newly elected the previous November. Inauguration Day was also moved up from March 4 to January 20.
January’s prognostic power is attributed to the host of important events transpiring during the month: new Congresses convene; the President gives the State of the Union message, presents the annual budget and sets national goals and priorities.
These events clearly affect our economy and Wall Street and much of the world. Add to that January’s increased cash inflows, portfolio adjustments and market strategizing and it becomes apparent how prophetic January can be. Switch these events to any other month and chances are the January Barometer would become a memory.
JB vs. All
Over the years there has been much debate regarding the efficacy of our January Barometer. Skeptics never relent and we don’t rest on our laurels. Disbelievers in the January Barometer continue to point to the fact that we include January’s S&P 500 change in the full-year results and that detracts from the January Barometer’s predicative power for the rest of the year. Others attempt to discredit the January Barometer by going further back in time: to 1925 or 1897 or some other year.
After the Lame Duck Amendment was ratified in 1934 it took a few years for the Democrat’s heavy congressional margins to even out and for the impact of this tectonic governing shift to take effect. In 1935, 1936 and 1937, the Democrats already had the most lopsided Congressional margins in history, so when these Congresses convened it was anticlimactic. Hence our January Barometer starts in 1938.
In light of all this debate and skepticism we have compared the January Barometer results along with the full year results, the following eleven months results, and the subsequent twelve months results to all other “Monthly Barometers” using the Dow Jones Industrials, the S&P 500 and the NASDAQ Composite.
Here’s what we found going back to 1938. There were only 11 major errors. In addition to the ten major errors detailed above: in 1946 the market dropped sharply after the Employment Act was passed by Congress, overriding Truman’s veto, and Congress authorized $12 billion for the Marshall Plan.
Including these 11 major errors, the accuracy ratio is 86.6% for the 82-year period. Including the 9 flat year errors (less than +/– 5%) the ratio is 75.6% — still effective. For the benefit of the skeptics, the accuracy ratio calculated on the performance of the following 11 months is still solid. Including all errors — major and flat years — the ratio is still a respectable 68.3%.
Now for the even better news: In the 51 up Januarys there were only 4 major errors for a 92.2% accuracy ratio. These years went on to post 16.0% average full-year gains and 11.5% February-to-December gains.
Let’s compare the January Barometer to all other “Monthly Barometers.” For the accompanying table we went back to 1938 for the S&P 500 and DJIA — the year in which the January Barometer came to life — and back to 1971 for NASDAQ when that index took its current form.
The accuracy ratios listed are based on whether or not the given month’s move — up or down — was followed by a move in the same direction for the whole period. For example, in the 82 years of data for the S&P 500 for the January Barometer, 62 years moved in the same direction for 75.6% accuracy.
The Calendar Year ratio is based on the month’s percent change and the whole year’s percent change; i.e., we compare December 2019’s percent change to the change for 2019 as a whole. By contrast the 11-month ratio compares the month’s move to the move of the following eleven months. February’s change is compared to the change from March to January. The 12-month change compares the month’s change to the following twelve months. February’s change is compared to the change from March to the next February.
Though the January Barometer is based on the S&P 500 we thought it would clear the air to look at the other two major averages as well. You can see for yourself in the table that no other month comes close to January in forecasting prowess over the longer term.
There are a few interesting anomalies to point out though. On a calendar year basis DJIA in January is slightly better than the S&P. 2011 is a perfect example of how the DJIA just edges out for the year while the S&P does not. For NASDAQ April, September and November stick out as well on a calendar year basis, but these months are well into the year, and the point is to know how the year might pan out following January, not April, September or November. And no other month has any basis for being a barometer. January is loaded with reasons.
Being the first month of the year it is the time when people readjust their portfolios, rethink their outlook for the coming year and try to make a fresh start. There is also an increase in cash that flows into the market in January, making market direction even more important. Then there is all the information Wall Street has to digest: The State of the Union Address, FOMC meeting, 4th quarter GDP, earnings and the plethora of other economic and market data.
Myths Dispelled
In recent years new myths and/or areas of confusion have come to light. One of the biggest errors is the notion that the January Barometer is a stand alone indicator that can be used to base all of your investment decisions for the coming year on. This is simply not true and we have never claimed that the January Barometer should or could be used in this manner. The January Barometer is intended to be used in conjunction with all available data deemed relevant to either confirm or call into question your assessment of the market. No single indicator is 100% accurate so no single indicator should ever be considered in a vacuum. The January Barometer is not an exception to this.
Another myth is that the January Barometer is completely useless. Those that believe this like to point out that simply expecting the market to be higher by the end of the year is just as accurate as the January Barometer. Statistically, they are just about right. In the 82-year history examined in this article, there were only 24 full-year declines. So yes, the S&P 500 has posted annual gains 70.7% of the time since 1938. What is missing from this argument is the fact that when January was positive, the full year was also positive 88.2% of the time and when January was down the year was down 58.1% of the time. These are not the near perfect outcomes that true statisticians prefer, but once again, the January Barometer was not intended to be used in a vacuum.
January Indicator Trifecta
Combining our three January indicators, the Santa Claus Rally (SCR), First Five Days (FFD) and January Barometer (JB), into the January Trifecta has proven to be an especially reliable gauge for future market performance. When all three are positive, as was the case in 2019, the next eleven months have been up 87.1% of the time with an average gain of 12.3% and the full year advanced 90.3% of the time with an average S&P 500 gain of 17.5%. The worst full-year decline in a year with a positive January Trifecta was 13.1% by S&P 500 in 1966.
|
First Five Days Positive: Market on Way to January Trifecta
|
|
By:
Jeffrey A. Hirsch & Christopher Mistal
|
January 08, 2020
|
|
|
|
Solid across the board gains today lifted S&P 500 to a year-to-date gain of 0.7% at today’s close and thus our First Five Day (FFD) early warning system is positive. Combined with last week’s positive Santa Claus Rally (SCR), our January Trifecta is now two for two. The January Trifecta would be satisfied with a positive reading from our January Barometer (JB) at month’s end.
![[S&P 500 January Early Indicator Trifecta Table]](/UploadedImage/AIN_0220_20200108_Trifecta_Table_FFD.jpg)
The best case, most bullish scenario is when all three indicators, SCR, FFD and JB, are positive (in table above). In 31 previous Trifecta occurrences since 1950, S&P 500 advanced 87.1% of the time during the subsequent eleven months and 90.3% of the time for the full year. However, a January Indicator Trifecta does not guarantee the year will be bear or correction free. Of the four losing “Last 11 Mon” years, shaded in grey in the above table, 1966, 1987 and 2011 experienced short duration bear markets (2011, S&P 500 –19.4% peak to trough). In 2018, S&P 500 retreated 19.8% from its September high close to its December low close.
Even if S&P 500 was to suddenly reverse course and finish the full month in the red, the prospects for the next eleven months and the full year remain decent. Of the last 10 times since 1950 that the SCR and FFD were both positive (and the full-month January was negative), the next eleven months advanced 80% of the time and full year advanced 70% of the time with gains of 7.4% and 2.9% respectively.
A positive SCR and FFD are encouraging and further clarity will be gained when the January Barometer (page 16, STA 2020) reports at month’s end. A positive January Barometer would certainly boost prospects for full-year 2020. The December Low Indicator (2020 STA, page 34) should also be watched with the line in the sand at the Dow’s December Closing Low of 27502.81 on 12/3/19.
|
Santa Claus Rally Results: S&P 500 Gains 0.3%
|
|
By:
Jeffrey A. Hirsch & Christopher Mistal
|
January 03, 2020
|
|
|
|
As defined in the Stock Trader’s Almanac, the Santa Claus Rally (SCR) is the propensity for the S&P 500 to rally the last five trading days of December and the first two of January an average of 1.3% since 1950.
The lack of a rally can be a preliminary indicator of tough times to come. This was certainly the case in 2008 and 2000. A 4.0% decline in 2000 foreshadowed the bursting of the tech bubble and a 2.5% loss in 2008 preceded the second worst bear market in history.
Despite a challenging day of trading, S&P 500 did finish the seven-day trading span defined by the Santa Claus Rally with a 0.3% gain. Including this year, Santa has paid Wall Street a visit 56 times since 1950. Of the previous 55 occasions, January’s First Five Days (FFD) and the January Barometer (JB) were both up 31 times. When all three indicators were positive, the full year was positive 28 times (90.3% of the time) with an average gain of 17.5% in all years.
A positive SCR is encouraging, and further clarity will be gained when January’s First Five Days Early Warning System (page 14, STA 2020) gives its reading next week and when the January Barometer (page 16, STA 2020) reports at month’s end. A positive First Five Days and January Barometer would certainly boost prospects for full-year 2020. The December Low Indicator (2020 STA, page 34) should also be watched with the line in the sand at the Dow’s December Closing Low of 27502.81 on 12/3/19.
|
Stock Portfolio & Free Lunch Updates: Holding Through January
|
|
By:
Christopher Mistal
|
January 02, 2020
|
|
|
|
Today major indexes continued their recent trend of
strength on the first trading day of 2020. DJIA, S&P 500, NASDAQ and Russell 2000 have all advanced four times in a row and DJIA has been up ten of the last twelve. S&P 500, NASDAQ and Russell 2000 have recorded gains in nine of the last twelve. Today’s gains put the Santa Claus Rally solidly into positive territory with one trading session remaining. However, over the past 21 years, not all positive January first trading days have translated into full-month gains. S&P 500 posted first trading day gains in 2002, 2003, 2009 and 2010 before reversing and ending January lower. January’s long-term track record of gains going back to 1950 turned noticeable weaker at the start of the century. Since 2000, S&P 500 has declined ten times in January. This recent weakness can be seen in the following January seasonal pattern chart.
![[January Seasonal Pattern Chart]](/UploadedImage/AIN_0220_20200102_Recent_January_Seasonal.jpg)
Over the last 21 years, Only NASDAQ has posted a full-month average gain. DJIA, S&P 500 and Russell 1000 have started January positive, only to surrender early-month gains by the eighth trading day. Greatest weakness has appeared just after mid-month, the eleventh trading day. Mild average losses on or around the eleventh trading day quickly swell to over 2% for DJIA and nearly as much for S&P 500 and Russell 1000.
Barring a reversal tomorrow, our first indicator of 2020, the Santa Claus Rally will turn in a positive reading. Today’s gains also give our First Five Days early warning indicator a comfortable head start towards a positive reading. Both of which do improve the odds of full-year gains, but do not guarantee that the year will not experience a few bumps along the way. Given January’s recent record of volatility, a more cautious stance seems prudent. When the January Barometer gives its reading at the end of the month, we will have additional clarity. Until that time, hold existing positions and limit new buying.
Stock Portfolio Update
In the time since last update through yesterday’s close the Almanac Investor Stock Portfolio climbed 2.8% higher compared to a 4.4% advance by S&P 500 and a 5.0% gain from the Russell 2000. The portfolio’s sizable cash position played a part in capping gains. A slow start for our Free Lunch stocks held overall Small-Cap gains in check, up just 0.4% since last update. The Mid-Cap and Large-Cap portions of the portfolio advanced over 6%.
Our
October Stock Basket, released on October 17, has performed well. As of yesterday’s close, the October Basket was up on average 13.6% (including stopped positions) compared to an average gain of 7.9% by DJIA, S&P 500, NASDAQ and Russell 2000 over the same time period. Of the original 20 positions in the basket, 17 remain in the portfolio.
Taylor Morrison (TMHC) was stopped out in November,
Spirit Aerosys (SPR) was stopped out in mid-December and
Celgene’s acquisition by
Bristol-Myers (BMY) was completed on November 20.
Celgene shareholders received one share of BMY, $50 in cash and a Contingent Value Right (valued at $9.00) for each share of Celgene held. The new shares from this merger have been added to the Large-Cap portfolio using November 20 closing price. The CVR is listed and trades at the NYSE under BMY/R. More complete information about the merger, tax consequences and the CVR can be found here (
https://www.bms.com/investors/shareholder-services/shareholder-faq.html). Pricing information for the CVR can be found at nyse.com (
https://www.nyse.com/quote/XNYS:BMYr).
Although the broad market and many of the positions in our portfolio enjoyed solid gains in December, three positions were stopped out. Enterprise Prod (EPD), Vistra Energy (VST) and Centerpoint Energy (CNP) have all been closed out of the Large-Cap portfolio. EPD and VST were closed out for modest single-digit losses while CNP took a 13.6% hit.
Free Lunch stocks selected from stocks making new 52-week lows on December 20 appear in the portfolio table below. All are shaded light grey for quick identification and all but
Groupon (GRPN) are listed in the Small-Cap portfolio. As of December 31, the basket has gotten off to a slow start. Three positions have been stopped out; AKRX, ELGX and GALT. Three positions never traded within the suggested buy limit range and have run away; LEE, ANIX and ECOR.
Paringa Resources (PNRL) was halted in Australia on December 23 and has not traded since.
PNRL is cancelled. Highlights from the basket include
Theratechnologies (THTX) and
Energous Corp (WATT). THTX quietly climbed over 17% and WATT spiked on above average volume today.
As a reminder, Free Lunch is a short-term strategy for the nimblest of traders. Heed stop losses and don’t hesitate to take profits should a position jump higher. Free Lunch stocks are not long-term holdings and we think you should be out of all of these stocks sometime between mid-January and the middle of February, possibly sooner if they fail to move.
Please see table below for current advice, suggested stop losses and where applicable buy limits.