|
Market at a Glance - 2/25/2021
|
|
By:
Christopher Mistal
|
February 25, 2021
|
|
|
|
2/25/2021: Dow 31402.01 | S&P 3829.34 | NASDAQ 13119.43 | Russell 2K 2200.17 | NYSE 15206.67 | Value Line Arith 8763.25
Fundamental: Improving. Corporate earnings were largely a success (where success was expected). Vaccine production and distribution are on the rise while new cases and deaths have eased. Weekly initial jobless claims were better than expected. Q4 GDP was also revised higher to 4.1%.
Technical: Consolidating. DJIA, S&P 500, NASDAQ and Russell 2000 all broke out to new all-time closing in February. DJIA and S&P 500 are still above their respective 50-day moving averages, NASDAQ has fallen below its. Key support for DJIA and S&P 500 is around January’s lows. NASDAQ could slip lower towards the highs of early last September.
Monetary: 0 – 0.25%. The Fed still has the liquidity spigot wide-open. The new administration is pushing another $1.9 trillion in stimulus spending. Inflation and inflation expectations are creeping higher. All of which is causing Treasury yields to rise. Stocks seem to be overreacting to the recent rise in yields. Yields have historically risen during the “Best Months.”
Seasonal: Bullish. March is normally a decent performing market month however post-election year payments to the Piper can take a toll on March as average historical gains are trimmed noticeably. In post-election years March ranks: #8 DJIA, S&P 500, Russell 1000 and Russell 2000; NASDAQ is 4th worst with an average loss of 0.2%.
Psychological: Retreating. According to
Investor’s Intelligence Advisors Sentiment survey Bullish advisors have slipped down to 56.3%. Correction advisors have increased to 25.2% while Bearish advisors are at 18.5%. Bullish advisors are at their lowest reading since last November. Bearish advisors are only slightly higher which suggests previous Bulls have joined the Correction camp. Historically, bullish sentiment is still rather elevated even after the recent declines in the percentage of Bullish advisors.
|
March Outlook: Frothy Market Succumbs & Looks for Support In March
|
|
By:
Jeffrey A. Hirsch & Christopher Mistal
|
February 25, 2021
|
|
|
|
Unfortunately the February weakness we warned about last issue began to materialize mid-month and accelerated into month-end. The “excuse du jour” is rising bond yields as the 10-Year Treasury climbed above 1.5%. The reaction to the 10-Year yield moving above 1.5 could be a little overblown. It’s barely back to pre-Covid levels. Perhaps it’s more a sign of a healthy economy and rising inflation expectations, which is precisely what the Fed has been trying to foster. We’re not overly concerned about the steepening yield curve.
But the market has been overbought and extended all year and arguably for several months in late-2020. February is the weak link in the “Best Six Months” and even weaker in Post-Election Years. After the big run-up in the first half of February folks have been looking for an excuse to take profits.
Sentiment had become rather exuberant with the Weekly CBOE Equity-Only Put/Call ratio near historic lows around and below 0.40 indicating a dearth of put-buying bears and a plethora of bulls in classic contrary indicator fashion. Our other favorite reverse psychology gauge
Investors Intelligence Advisors Bullish % had been above 60% from Thanksgiving through January with the difference between Bulls and Bears above 40 from mid-November until mid-February. Excessive bullish sentiment has receded a tad, but remains elevated.
March is also softer in Post-Elections and often prone to weakness in the Week After Triple Witching with DJIA down 22 of last 33. Typical March trading comes in like a lion and out like a lamb with strength during the first few trading days followed by choppy to lower trading until mid-month when the market tends to rebound higher. But the last few days often succumb to end of Q1 selling pressure.
As you can see in our One-Year Seasonal Pattern chart of the S&P 500, 2020 in the orange line was a couple of standard deviations above the typical year and even more as compared to historical Post-Election Year patterns. In fact on a relative trend basis this February selloff is par for the course as compared to all Post-Election Years (green line), 1st Year Democratic Presidents (purple line) and Post-Election Years After Incumbent Party Losses (red line).
![[S&P 500 One-Year Seasonal Pattern Since 1949]](/UploadedImage/AIN_0321_20210225_1-Year_S&P_Pattern.jpg)
On the technical front we continue to track the big tech leading NASDAQ 100 Index (NDX). Recent selling has breached support levels at 13,000 and is now looking for support near 12,720 as shown in the blue line in the accompanying NDX chart. NDX 12720 is right at the mid-December/early-January consolidation level as well as December pivot-point resistance (red dotted line) and the January monthly pivot point (blue dotted line). The old September high of 12420 still holds as major support and is just below the 10% correction level from the February 16 high of 13,774.
Bottom line, the market has been overdue for a pullback and has entered a historically weak stretch in the Best Six Months and Post-Election years. Covid vaccine rollout delays continue to be a concern as perfect execution has been baked into stock prices since December and any setbacks are likely to give the market jitters.
The end of Q1 has always been a volatile time for stocks as institutions shore up positions ahead of earnings season. Further consolidation is likely in March, but we expect the market to find support shortly and subsequently challenge the recent highs again in April (the Dow’s best month) as the Best Six Months comes to a close. Additional weakness can also be expected in the Worst Six Months May-October.
Pulse of the Market
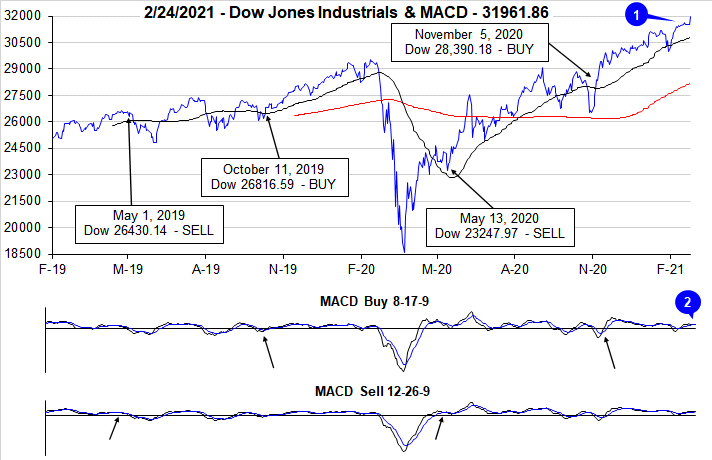
February is still on track for above historical average gains for DJIA and S&P 500 with a single trading session remaining. Even though gains are better this time around than average the pattern of early strength followed by late-month weakness has held up. This adds to the growing list of evidence that seasonality has returned and is encouraging going forward. DJIA reached a new, all-time closing high just shy of 32,000 this week (1), but the majority of gains occurred earlier in the month.
Both the faster and slower MACD indicators were positive as of this Wednesday’s close (2). Should the market continue to exhibit weakness over the next few trading days, both indicators could turn negative as their recent trend has been weak. As a reminder, for our Tactical Seasonal Switching Strategy the earliest date possible to issue our Seasonal MACD Sell signal is April 1 this year.
At three straight weeks, DJIA is enjoying its longest streak of positive Fridays and Mondays since November 2019 (3). We continue to monitor the first and last trading days of each week for early signs of potential weakness. When both Friday and Monday are down, it triggers a Down Friday/Down Monday (DF/DM) warning. Strength on Friday followed by strength on Monday is not exactly the opposite of a DF/DM, but it does signal that confidence was improving and further gains are likely. For DJIA, all three weeks when Friday and Monday were positive produced a weekly gain as well. S&P 500 (4) and NASDAQ (5) also logged solid gains in two of those three weeks.
Market breadth measured by NYSE Weekly Advancers and NYSE Weekly Decliners (6) was positive in two of the last four weeks. During the week ending February 5, Weekly Advancers reached their highest reading since April 10, 2020, when DJIA, S&P 500 and NASDAQ all rallied over 10% in a week. A large number of advancing issues is typically indicative of broad participation in the rally and it is more common to see large readings near the beginning of a bullish move not at its end.
Weekly New Highs (7) had expanded to their highest level since May 2013 two weeks ago. Weekly New Lows have also remained subdued. This is generally a bullish indication as well. If New Lows begin to expand that could be a cause for concern. However, as of today, it does appear the market is consolidating recent gains and digesting the recent improvements in economic data.
The 30-yearTreasury bond yield has been on the rise since record a historic low last August (8). More recently the pace of the rise has accelerated, and the yield curve has steepened. Higher bond yields during the “Best Months” are not unusual, but some are starting to worry that the rapid rise could cause trouble for the Fed and an economy that is still not fully recovered. Stocks could continue to be volatile until Treasury bond yields show signs of stabilizing.
Click for larger graphic…
|
March Almanac & Vital Stats: Softer in Post-Election Years
|
|
By:
Jeffrey A. Hirsch & Christopher Mistal
|
February 18, 2021
|
|
|
|
Tempestuous March markets tend to drive prices up early in the month and batter stocks at month end. Julius Caesar failed to heed the famous warning to “beware the Ides of March” but investors have been served well when they have. Stock prices have a propensity to decline, sometimes rather precipitously, during the latter days of the month. In March 2020, DJIA plunged 4011 points (-17.2%) during the week ending on the 20th.
March packs a rather busy docket. It is the end of the first quarter, which brings with it Triple Witching and an abundance of portfolio maneuvers from The Street. March Triple-Witching Weeks have been quite bullish in recent years. But the week after is the exact opposite, DJIA down 22 of the last 33 years—and frequently down sharply. In 2018, DJIA lost 1413 points (–5.67%) Notable gains during the week after for DJIA of 4.88% in 2000, 3.06% in 2007, 6.84% in 2009, 3.05% in 2011 and 12.8% in 2020 are the rare exceptions to this historically poor performing timeframe.
Normally a decent performing market month, post-election year payments to the Piper take a toll on March as average gains are trimmed noticeably (see Vital Statistics table below). In post-election years March ranks: 5th worst for DJIA, S&P 500, Russell 1000 and Russell 2000; NASDAQ is 4th worst. In 12 post-election years since 1973, NASDAQ has advanced six times, with three in a row 2009, 2013 and 2017.
Saint Patrick’s Day is March’s sole recurring cultural event. Gains on Saint Patrick’s Day have been greater than the day before and the day after. Perhaps it’s the anticipation of the patron saint’s holiday that boosts the market and the distraction from the parade down Fifth Avenue that causes equity markets to languish. Or maybe it’s the fact that Saint Pat’s usually falls in historically bullish Triple-Witching Week.
Whatever the case, since 1950, the S&P 500 posts an average gain of 0.27% on Saint Patrick’s Day (or the next trading day when it falls on a weekend), a gain of 0.05% the day after and the day before averages a 0.07% advance. S&P 500 median values are 0.17% on the day before, 0.23% on Saint Patrick’s Day and 0.03% on the day after. In the nine years when St. Patrick’s Day falls on a Wednesday, like this year, since 1950, the day before (Tuesday) produced an average gain of 0.28%, while Wednesday averaged 0.02% and Thursday averaged 0.34%.
| March (1950-2020) |
| |
DJI |
SP500 |
NASDAQ |
Russell
1K |
Russell 2K |
| Rank |
|
6 |
|
6 |
|
7 |
|
7 |
|
8 |
| #
Up |
|
45 |
|
45 |
|
31 |
|
27 |
|
29 |
| #
Down |
|
26 |
|
26 |
|
19 |
|
15 |
|
13 |
| Average
% |
|
0.8 |
|
1.0 |
|
0.6 |
|
0.8 |
|
0.8 |
| 4-Year Presidential Election Cycle Performance
by % |
| Post-Election |
|
0.3 |
|
0.6 |
|
-0.2 |
|
0.7 |
|
1.1 |
| Mid-Term |
|
1.0 |
|
1.1 |
|
1.3 |
|
1.6 |
|
2.7 |
| Pre-Election |
|
1.8 |
|
1.9 |
|
3.1 |
|
2.0 |
|
2.6 |
| Election |
|
0.2 |
|
0.4 |
|
-1.6 |
|
-1.1 |
|
-3.0 |
| Best & Worst March by % |
| Best |
2000 |
7.8 |
2000 |
9.7 |
2009 |
10.9 |
2000 |
8.9 |
1979 |
9.7 |
| Worst |
2020 |
-13.7 |
2020 |
-12.5 |
1980 |
-17.1 |
2020 |
-13.4 |
2020 |
-21.9 |
| March Weeks by % |
| Best |
3/27/20 |
12.8 |
3/13/09 |
10.7 |
3/13/09 |
10.6 |
3/13/09 |
10.7 |
3/13/09 |
12.0 |
| Worst |
3/20/20 |
-17.3 |
3/20/20 |
-15.0 |
3/20/20 |
-12.6 |
3/20/20 |
-15.3 |
3/13/20 |
-16.5 |
| March Days by % |
| Best |
3/24/20 |
11.4 |
3/24/20 |
9.4 |
3/13/20 |
9.4 |
3/24/20 |
9.5 |
3/24/20 |
9.4 |
| Worst |
3/16/20 |
-12.9 |
3/16/20 |
-12.0 |
3/16/20 |
-12.3 |
3/16/20 |
-12.2 |
3/16/20 |
-14.3 |
| First Trading Day of Expiration Week: 1990-2020 |
| #Up-#Down |
|
21-10 |
|
21-10 |
|
17-14 |
|
19-12 |
|
18-13 |
| Streak |
|
D1 |
|
D1 |
|
D1 |
|
D1 |
|
D1 |
| Avg
% |
|
-0.20 |
|
-0.25 |
|
-0.50 |
|
-0.30 |
|
-0.60 |
| Options Expiration Day: 1990-2020 |
| #Up-#Down |
|
16-15 |
|
19-12 |
|
14-17 |
|
17-14 |
|
13-17 |
| Streak |
|
D1 |
|
D1 |
|
D1 |
|
D1 |
|
D1 |
| Avg
% |
|
0.04 |
|
-0.03 |
|
-0.19 |
|
-0.05 |
|
-0.17 |
| Options Expiration Week: 1990-2020 |
| #Up-#Down |
|
22-9 |
|
22-9 |
|
19-12 |
|
21-10 |
|
17-14 |
| Streak |
|
D1 |
|
D1 |
|
D1 |
|
D1 |
|
D1 |
| Avg
% |
|
0.40 |
|
0.38 |
|
-0.27 |
|
0.30 |
|
-0.19 |
| Week After Options Expiration: 1990-2020 |
| #Up-#Down |
|
11-20 |
|
8-23 |
|
14-17 |
|
8-23 |
|
14-17 |
| Streak |
|
U1 |
|
U1 |
|
U1 |
|
U1 |
|
U1 |
| Avg
% |
|
-0.09 |
|
-0.06 |
|
0.19 |
|
-0.03 |
|
0.15 |
| March 2021 Bullish Days: Data 2000-2020 |
| |
1,
3, 9, 12, 15 |
1,
3, 9, 11, 16, 17 |
1,
3, 11, 16-18 |
1,
3, 9, 11, 16, 17 |
1, 3, 11, 16, 17 |
| |
17,
30 |
|
22,
25, 30 |
|
23, 25, 30, 31 |
| March 2021 Bearish Days: Data 2000-2020 |
| |
2,
19, 24 |
2,
12, 19, 23 |
2,
5, 26 |
2,
19, 23 |
2, 8, 10, 26 |
| |
|
|
|
|
|
|
March 2021 Strategy Calendar
|
|
By:
Christopher Mistal
|
February 18, 2021
|
|
|
|
|
Stock Portfolio Updates: Rally Rolls On, Buy Dips
|
|
By:
Christopher Mistal
|
February 11, 2021
|
|
|
|
Halfway through the month of February, DJIA, S&P 500 and NASDAQ have all managed to avoid typical February weakness. As of today’s close, DJIA is the laggard up 4.8%. S&P 500 is up 5.4% so far in February while NASDAQ has leapt 7.3%. Late January weakness did set the stage for the brisk rebound that quickly reclaimed lost ground. Nonetheless the rally that began in early November of last year continues to charge higher as interest rates remain low, stimulus flows and the Fed QE pumps liquidity into the system.
![[DJIA Daily Bar chart]](/UploadedImage/AIN_0321_20210211_DJIA.jpg)
![[S&P 500 Daily Bar chart]](/UploadedImage/AIN_0321_20210211_SP500.jpg)
![[NASDAQ Daily Bar chart]](/UploadedImage/AIN_0321_20210211_NASDAQ.jpg)
In the above charts of DJIA, S&P 500 and NASDAQ, daily bars, 50- and 200-day moving averages along with monthly projected pivot points are plotted in the top pane with Stochastic, relative strength and MACD indicators plotted in the lower panes. Aside from the recent and brief bout of weakness in late January, the trend has been higher and technical indicators have remained positive, although somewhat extended. Momentum clearly favors the bulls. It is the “Best Months” of the year for stocks, vaccines are being distributed and estimates for earnings and growth are trending favorably.
There are a few areas for concern. New variants of the virus that cause Covid-19 are spreading and current vaccines appear to be less effective against the new variants. Unemployment is still elevated and promised stimulus still has not been delivered. Valuations in some areas of the market are also rather elevated. These headwinds could cause some market weakness, but it is likely to be brief as the force of the tailwinds driving the market now is far greater. Any market weakness in the near-term is likely to be an opportunity to add to existing positions or perhaps pick up some favorites at better prices.
Portfolio Updates
Over the last four weeks since last update through yesterday’s close, S&P 500 climbed 2.6% while Russell 2000 continued to surge higher gaining another 8.1%. During the same time period the entire portfolio climbed a respectable 4.1% higher excluding dividends and any fees. Overall portfolio performance was held in check by a sizable cash position. The stock only portion of the portfolio was up 7%. Our Mid-cap stocks were responsible for a major portion of the overall portfolio’s advance, gaining 8.4%. Small-cap stocks rose 3.6% on average including the sizable cash balance held in that portfolio while our Large-cap portfolio lagged advancing just 1.4%.
Large-cap sluggish performance was primarily the result of weakness in defensive positions held. These positions are shaded grey in the portfolio and are a mix of dividend paying utilities, consumer staples and an MLP (Master Limited Partnership) from the energy sector. Not all of these positions were weak. Abbott Labs (ABT) advanced 11.7% since last update through yesterday’s close. ABT reported strong earnings and more importantly issued guidance for 2021 forecasting earnings per share growth of more than 35%. Brookfield Infrastructure Partners (BIP) is another defensive holding that continues to perform, up 35.9%.
Utility sector-based holdings in the Large-cap and Mid-cap portfolios have been the biggest laggards recently. Higher interest rates and tepid demand have weighed on the sector as a whole, but as we noted just last week,
utilities seasonal strength typically begins in March after a seasonal low in late-February or early March. Like that ETF trade, we are also going to take advantage of recent weakness in utility stocks to add to existing positions ahead of seasonal strength.
BKH, AEE, AEP, CMS, DTE, DUK, EXC and SO can all be considered near current levels or on dips. Please see table below for specific buy limit suggestions. For tracking purposes, we will be adding to these existing positions.
In addition to Utility sector stocks, JinkoSolar Holdings (JKS) is attractive at just below current levels and could be considered up to a buy limit of $64.50. Should JKS trade below its buy limit, we will officially add to the existing position. We have been long-term fans of solar power however, even after decades of development solar’s success still depends heavily on numerous factors outside their control ranging from political to the price of other energy sources. It appears many of these factors are now swinging in favor of solar.
Verizon (VZ) and AT&T (T) are two additional stocks that are attractive near current levels. Dividend yield from either company is quite appealing when compared to most any other interest bearing or dividend paying source. Earnings and revenues at both companies have been uninspiring but expanding 5G coverage and demand for streaming services could provide a lift. For tracking purposes, we will officially add to existing holdings should VZ or T trade below their respective buy limits. T could be considered under $28.95 while VZ could be purchased under $55.65.
Shifting focus to small-cap holdings, KB Home (KBH) and Avid Tech (AVID) both traded above double their original purchase prices during the past four weeks. In accordance with standard trading guidelines (found in the bottom of the portfolio table below), half of each position was closed out and the remaining half position is on Hold. JetBlue Airways (JBLU) is the next closest position to doubling. Should JBLU trade above $17.10, consider taking profits by selling half.
Please see table below for specific buy limits, stop losses and current advice for each position in the portfolio.
|
ETF Trades & Portfolio Updates: Eyes on Utilities & High-Tech
|
|
By:
Christopher Mistal
|
February 04, 2021
|
|
|
|
Featured in the Stock Trader’s Almanac 2021, on page 92, Sector Seasonality, there are two sectors that begin their seasonally favorable periods in March: High-Tech and Utilities. This year we are going to look to take advantage of any seasonal weakness in February to establish new or add to existing positions associated with these sectors.
In the following weekly bar chart of the Utility Sector Index (UTY), seasonal strength (lower pane, shaded in yellow) typically begins following an early or mid-March bottom and usually lasts through early October although the bulk of the move is typically done sometime in late May or early June (blue arrow). Last year’s volatile trading has impacted the seasonal pattern in the lower pane of the chart. Typically the pattern is less choppy as the sector does not typically experience price swings of nearly 40% in a year. Utilities tend to be a defensive sector of the market and historically have seen gains during the “Worst Six Months,” May through October.
![[Utility Sector Index (UTY) Weekly Bars and Seasonal Trend Chart]](/UploadedImage/AIN_0321_20210204_UTY_Seasonal.jpg)
With over $12 billion in assets and ample average daily trading volume, SPDR Utilities (XLU) is a top choice to consider holding during Utilities’ seasonally favorable period. It has a gross expense ratio of just 0.12% and a relatively attractive yield of 3.14%. Top five holdings include: NextEra Energy, Duke Energy, Southern Co, Dominion Resources and Exelon Corp.
XLU could be bought on dips below $61.70. This is around halfway between its projected monthly pivot point (blue-dashed line in daily bar chart below) and monthly support (green-dashed line). Based upon its 15-year average return of 7.7% (excluding dividends and trading fees) during its favorable period mid-March to the beginning of October, set an auto-sell price at $73.10. If purchased an initial stop loss of $55.53 is suggested.
![[SPDR Utilities (XLU) Daily Bar Chart]](/UploadedImage/AIN_0321_20210204_XLU.jpg)
Our favorite ETF to trade High-Tech’s seasonal strength from mid-March through the beginning of July is iShares DJ US Tech (IYW). Our existing position is up 16.8% as of yesterday’s close. Any February weakness could be an opportunity to add to this existing position or to establish a new position. IYW can be considered on dips below $86.30. If purchased an initial stop loss at $75.25 is suggested and should above average gains materialize take profits at the auto-sell price of $101.39. For tracking purposes, we will add to the existing position if IYW does dip below the buy limit.
Sector Rotation ETF Portfolio Update
January started off in typical, long-term historical fashion with gains across the board. But by the time the month came to a close those gains had been reversed and a modest loss was recorded. As of yesterday’s close, most of the decline had been recovered and some sectors were notable higher than last update. Biotech is one standout. iShares NASDAQ Biotech (IBB) is up 22.8% while SPDR S&P Biotech (XBI) was closed out at it auto-sell last month for a total gain of 26.1%.
Early January strength also lifted iShares PHLX Semiconductor (SOXX) and SPDR Financials (XLF) up to and through their respective auto-sell prices. SOXX was closed out for a 19.2% gain and XLF recorded a 22.2% advance. As of today’s close SOXX and XLF are only modestly higher, not much of a reward for another full month of holding time.
So far, the energy sector has held up well as the new administration has taken a more aggressive stance toward global warming. SPDR Energy (XLE) was up 5.1% at yesterday’s close and added over 1% in today’s trading. The long, long-term outlook for fossil fuels may not be so bullish, but in the present and near future we have production cuts, an approaching summer driving season and a vaccine roll out that is likely to lift demand and prices for crude oil which should boost the share of companies in the sector.
The other energy related holding, First Trust Natural Gas (FCG) was added the day after it was presented last month when shares dipped below the buy limit. FCG was volatile in January trading from under $9 to over $11 and then back below $10, but as off yesterday’s close was up 7% since being added. Tougher regulation and fewer lease approvals could pinch supply of natural gas which could lift natural gas and FCG.
With the exception of the new trade ideas, all other positions in the portfolio are currently on Hold. Should typical February weakness occur this year, it could be an opportunity to add to existing positions or establish new positions.
Tactical Seasonal Switching Strategy Portfolio Update
As of yesterday’s close, the Tactical Seasonal Switching Strategy portfolio has an average gain of 14.2% since our Seasonal Buy Signal on November 5. iShares Russell 2000 (IWM), is still the top performing position in the basket, now up a staggering 30.2%. Invescos QQQ (QQQ) has surged to second best, up 11.5% after being the laggard of the group last update. All positions in the portfolio are on Hold.
Please note, positions in the Tactical Switching Strategy portfolio are intended to be held until we issue corresponding Seasonal MACD Sell Signals after April 1 for DJIA and S&P 500 and after June 1 for NASDAQ and Russell 2000. Due to this no stop loss is suggested on these positions.
|
January Barometer 2021 Official Results: January Trifecta Thwarted
|
|
By:
Jeffrey A. Hirsch & Christopher Mistal
|
January 29, 2021
|
|
|
|
Today’s market decline cancelled the bullish January Indicator Trifecta. Regardless of where the blame falls for today’s sell off, the market had gone quite a distance in a relatively brief period of time and valuations and technical readings in many areas of the market were stretched. S&P 500 finished January down 1.1% and thus the January Barometer is negative.
Devised by Yale Hirsch in 1972, the January Barometer has registered eleven major errors since 1950 for an 84.5% accuracy ratio. This indicator adheres to propensity that as the S&P 500 goes in January, so goes the year. Of the eleven major errors Vietnam affected 1966 and 1968. 1982 saw the start of a major bull market in August. Two January rate cuts and 9/11 affected 2001.The market in January 2003 was held down by the anticipation of military action in Iraq. The second worst bear market since 1900 ended in March of 2009 and Federal Reserve intervention influenced 2010 and 2014. In 2016, DJIA slipped into an official Ned Davis bear market in January. The eleventh major error was last year, 2020. Including the eight flat years yields a .732 batting average.
The near-term outlook for the market has diminished as every down January (page 20 Stock Trader’s Almanac 2021) since 1950 was followed by a new or continuing bear market, a 10% correction or a flat year. However, it is challenging to envision a full-blown bear market with the Fed keeping a close eye on the market and the new administration working on additional fiscal stimulus.
This year’s combination of a positive Santa Claus Rally and First Five Days with a full-month January loss has only occurred twelve times (including this year) since 1950. In the previous eleven occurrences S&P 500 was down seven times in February with an average loss of 2.2%. However, over the remaining 11 months of the year, S&P 500 advanced 81.8% of the time with an average gain of 8.2%. Full-year performance was positive 72.7% of the time, but with an average gain of 4.1%.
Because we do not rely solely on a single indicator or pattern, DJIA’s December closing low of 29823.92 is still a key level to be watched. Lacking the backup of other patterns and indicators, today’s last day of January reversal could be entirely due to the less than expected results from J&J’s vaccine. Any developments over the weekend and the market’s response next week will be key as to whether or not recent market weakness manifests into a deeper pullback or correction.