|
Market at a Glance - 2/23/2023
|
|
By:
Christopher Mistal
|
February 23, 2023
|
|
|
|
Please take a moment and register for our member’s only webinar, March 2023 Outlook and Update on Wednesday March 1, 2023, at 2:00 PM EDT here:
Please join us for an Almanac Investor Member’s Only discussion of recent market action with time for Q & A at the end. Jeff and Chris will cover their outlook for March, review the Tactical Seasonal Switching Strategy ETF, Sector Rotation ETF, and Stock Portfolio holdings and trades. We will also share our assessments of the Fed, inflation, recession prospects, as well as relevant updates to seasonals now in play.
If you are unable to attend the live event, please still register. Within a day of completion, we will send out an email with links to access the recording and the slides to everyone that registers.
After registering, you will receive a confirmation email containing information about joining the webinar and a reminder message.
Market at a Glance
2/23/2023: Dow 33153.91 | S&P 4012.32 | NASDAQ 11590.40 | Russell 2K 1908.09 | NYSE 15584.92 | Value Line Arith 9286.65
Seasonal: Bullish. March has been a solid performer, ranking #5 for DJIA and S&P 500 since 1950. In pre-election years March has been even stronger ranking #4 for DJIA, S&P 500 and NASDAQ. Average pre-election year gains range from 1.8% by DJIA to 3.1% from NASDAQ. Week after quarterly options expiration and last three or four trading days have been the weak parts of the month.
Fundamental: Mixed. Previously better than expected Q4 GDP was revised down to 2.7% from 2.9%. Inflation’s trend lower appears to have slowed in January with CPI dipping less than anticipated. January’s PPI was also hotter than forecast. Meanwhile, weekly initial claims remain low and 517k net new jobs were added in January. Estimates for Q1 and Q2 corporate earnings are negative and slipping lower but are expected to recover in the second half of the year.
Technical: Testing Support. DJIA, S&P 500 and NASDAQ are testing support. DJIA has retreated into the space between its 50- and 200-day moving averages and is bouncing around its January lows right around 33000. Just below is DJIA’s December closing low at 32757.54. A close below this level in Q1 would put additional pressure on DJIA. S&P 500 is treading just above its 50-day moving average at 3980. NASDAQ is just above its 200-day moving average around 11,400. Support is anticipated to hold however if it does not the next key levels to watch will be around DJIA 32,500, S&P 500 3,930 and NASDAQ 11,200.
Monetary: 4.50 – 4.75%. Recent economic data is pushing the Fed toward making good on its suggestion that rates may need to go even higher and stay higher for a longer period. According to CME Group’s FedWatch Tool, as of February 23, there is a 100% chance of another Fed rate increase in March. The only question is whether it will be 0.25% or 0.50%. Odds for the larger increase are 27.0%. Odds of the Fed overtightening appear to be rising as well, but economic data still does not suggest a recession is imminent.
Sentiment: Neutral. According to Investor’s
Intelligence Advisors Sentiment survey Bullish advisors stand at 44.4%. Correction advisors are at 29.2% while Bearish advisors numbered 26.4% as of their February 22 release. Compared to a month ago, bulls and bears are modestly lower, those looking for a correction are slightly higher. With the number of advisors (bears plus correction) expecting weakness outnumbering the bulls this reading could be a sign that current weakness is nearing its end.
|
March Outlook: Best Case Scenario Still on Track After Typical Seasonal Weakness
|
|
By:
Jeffrey A. Hirsch & Christopher Mistal
|
February 23, 2023
|
|
|
|
Bears to the left of me. Recession fears to the right. There are a few bulls out there like us, Tom Lee, Ed Yardeni, Larry Williams and Walter Deemer to name a few, as well as the 44.4% of advisors in
Investors Intelligence US Advisors Sentiment indicator. But the airwaves, headlines, mainstream media and social media are teeming with calls from Wall Street strategists and independent traders for a continuing bear market that takes out or at least tests the October intraday lows. And of course, they are all convinced a recession of some magnitude is just around the corner.
Geopolitical concerns related to the war in Ukraine, China and the other usual suspects clearly exist. Investors fear inflation heating up again and the Fed will overtighten and break the economy and in turn the market, but it’s not the Fed’s job to break the economy. So far, the economy has digested the 450 basis-point rate increase rather well.
From our vantage point, this current selloff is rather typical seasonal behavior for February, especially the latter half of the month. In our familiar seasonal pattern chart for 2023 all the relevant trendlines show late February weakness. February is the weak link in the Best Six Months, November-April, and is the second worst month of the year. Plus, on the heels of the massive rally off the October and December lows the market sure needed a bit of a respite.
Hot economic data this year has investors and traders worried that the fed is going to go too far and push us into recession. Many fear inflation will not subside and instead reignite hitting Main Street and Wall Street hard in the pocketbook. Everything is much more expensive than it was just a year ago and interest rates are higher than they’ve been for over 15 years.
Our research suggests that we already had our recession with the two back-to-back negative quarters of growth in GDP in Q1 and Q2 of 2022. The NBER changed their recession rule back in 2020 during the depth of the pandemic to accommodate their agenda. And we’ve had a rolling recession across different sectors at different times throughout the past year.
Crypto and techs were crushed last year with massive, big tech layoffs, but the economy was able to digest that as well. Housing has been in decline since rates began to climb, but the supply of housing in this country is still well below demand.
The labor market remains robust, and the unemployment rate is historically low with 2 jobs for everyone who’s looking for one. And the economy continues to expand with GDP up 3.2% and 2.7% in the Q3 and Q4 of 2022 and the Atlanta Fed’s venerable and accurate GDPNow’s latest estimate for 2.5% GDP growth in 2023 Q1.
Yes, the yield curve is steeply inverted now and has been somewhat inverted for the better part of the past six months or so. And every recession in all of history has been preceded by an inverted yield curve. But what the bond yield inversion is telling us is that: 1. The bond market does not expect long-term growth to be much more than 2-3%. 2. Inflation is still not expected to stay around indefinitely and will return to trend, around 2%. And 3. Inversion = Fed is tight enough now.
Technically speaking, it looks like the S&P 500 has found some support here at the 50-day moving average and the uptrend line off the October low which runs through the December low, which looks like the right shoulder (RS) of an inverted head-and-shoulders bottom that formed late last year.
Our read of the market taking into consideration the five main disciplines (Seasonality, Fundamentals, Technical, Monetary and Sentiment) that drive our outlook is that we had a classic 4-Year Cycle Stock Trader’s Almanac Midterm Election Year bear market last year with a textbook October bottom and that the market is currently in a nascent cyclical bull market poised for gains of at least 15-20% this year.
After some continuing choppy trading in Q1 that we forecasted back in December, look for the rally to resume into Q2 as the fed slows down its pace of tightening, inflation succumbs and the soft landing or no landing scenarios begin to materialize. After some seasonal consolidation and sideways action in the Worst 4 Months July-October, a Q4 rally should push the market to new highs by yearend.
Remember 2023 is a pre-election year, the best year of the 4-year cycle for the market as incumbent presidents prime the pump and do everything in their power to get reelected. S&P 500 is up 16.8% in pre-election years since 1950 vs. less than 8% for all the other years. And this is the Sweet Spot of the 4-year cycle, the three-quarter span from Q4 of the midterm through Q2 of the pre-election where DJIA has gained 19.3% on average, S&P 500 20.0% and NASDAQ up an amazing 29.3% during the period.
Pulse of the Market
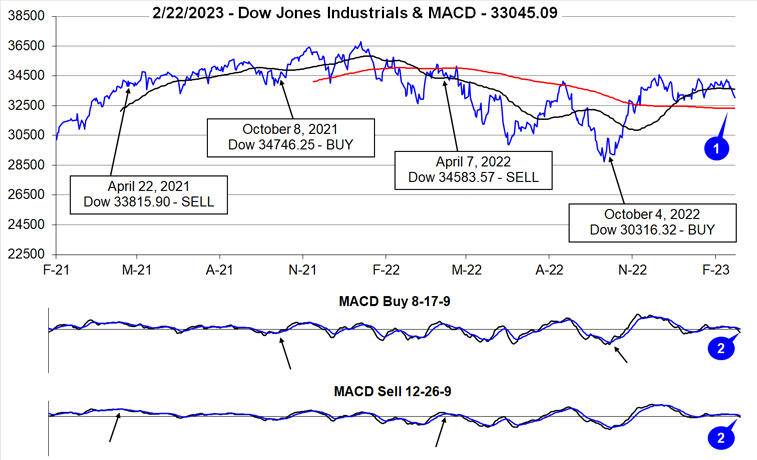
February started off in typical seasonal fashion with January’s strength spilling over. But that strength did not persist and historical second half of February weakness has kicked in. DJIA managed to remain above its 50-day moving average until this week (1) while faster and slower moving MACD indicators confirm the reversal (2). Based upon February’s recent 21-year seasonal pattern weakness could persist through the end of the month. Even the historically more bullish pre-election year February seasonal pattern exhibits second half weakness, just to a lesser degree.
As of the close on February 22, DJIA, S&P 500, NASDAQ and Russell 2000 are down in February however all remained positive year-to-date. In contrast to last year, NASDAQ is still the best performing index this year, up nearly 10%. DJIA is lagging, clinging to a fractional 0.17% gain. Russell 2000 is second best, up 7.58% and S&P 500 is mid-pack with a 3.95%. DJIA’s February struggles began early with a Down Friday/Down Monday (DF/DM) (3) during the first week. In the time since, DJIA and S&P 500 logged two losing weeks and NASDAQ one. This week is on track to add to losses.
Looking at weekly performance we find it closely follows year-to-date performance by DJIA, S&P 500 (4) and NASDAQ (5). DJIA has only advanced during three of the last seven weeks, S&P 500 has four positive weeks while NASDAQ has risen in six weeks. This choppy trading is likely to continue until the market gets a clearer outlook for interest rates from the Fed.
NYSE Weekly Advancers and Weekly Decliners (6) have remained consistent with the market’s weekly moves. Weekly Advancers have outnumbered Weekly Decliners during up weeks while the opposite was true in declining weeks. Absent unusual readings, current weakness appears to be the result of consolidation and not the beginning of a new significant down leg.
Weekly New Highs (7) also peaked in early February as Weekly New Lows bottomed. New Weekly Highs have retreated modestly since while New Weekly Lows have risen. Bullishly, the number of New Weekly Lows has remained low. As long as New Weekly Lows remain subdued, an abrupt end to the current weakness remains likely.
Recent, better than anticipated economic data has revived concerns that the Fed will need to raise interest rates even higher and potentially stay higher for longer. As a result, the 2-year Treasury bond yield (8) is currently at its highest level since August 2007. The 30-year Treasury bond yield has risen as well but remains below its highs above 4% last fall. This yield inversion is due to the Fed and does not appear to be a recessionary signal as long-term rates are rising, not falling.
|
March Almanac & Vital Stats: Stronger in Pre-Election Years
|
|
By:
Jeffrey A. Hirsch & Christopher Mistal
|
February 16, 2023
|
|
|
|
As part of the Best Six/Eight Months, March has historically been a solid performing month with DJIA, S&P 500, NASDAQ, Russell 1000 & 2000 all advancing more than 63% of the time with average gains ranging from 0.7% by NASDAQ to 1.1% by S&P 500. Over the recent 21-year period, March has tended to open well with gains accumulating over its first three trading days. A brief bout of weakness follows before all indexes begin moving modestly higher into mid-month through month’s end.
Julius Caesar failed to heed the famous warning to “beware the Ides of March” but investors have been served well when they have. Stock prices have had a propensity to decline, sometimes rather precipitously, during the latter days of the month. In March 2020, DJIA plunged nearly 4012 points (-17.3%) during the week ending on the 20th. Solid late-March gains in 2009 and again in 2020 have improved average second half of March performance, but most bullish days are still in the first half of the month (see
March 2023 Strategy Calendar).
![[Recent 21-Year March Seasonal Pattern Chart]](/UploadedImage/AIN_0323_20230216_March_2023_Seasonal_Patterns_Chart.jpg)
March packs a rather busy docket. It is the end of the first quarter, which brings with it Triple Witching and an abundance of portfolio maneuvers from The Street. March Triple-Witching Weeks have been quite bullish in recent years. But the week after is the exact opposite, DJIA down 22 of the last 35 years—and frequently down sharply. In 2018, DJIA lost 1413 points (–5.67%) Notable gains during the week after for DJIA of 4.88% in 2000, 3.06% in 2007, 6.84% in 2009, 3.05% in 2011 and a staggering 12.84% in 2020 are the rare exceptions to this historically poor performing timeframe.
Historically a solid performing month, March performs even better in pre-election years (see Vital Statistics table below). In pre-election years March ranks: 4th best for DJIA, S&P 500, NASDAQ, and Russell 1000 (January, April and December are better). Pre-election year Marchs rank #5 for Russell 2000. Pre-election year March has been up 14 out of the last 14 for DJIA. Coming into 2019, the Russell 2000 had a perfect, 10-for-10 winning record, but is now 10 and 1 after falling 2.3% that March.
Saint Patrick’s Day is March’s sole recurring cultural event. Gains on Saint Patrick’s Day have been greater than the day before and the day after. Perhaps it’s the anticipation of the patron saint’s holiday that boosts the market and the distraction from the parade down Fifth Avenue that causes equity markets to languish. Or maybe it’s the fact that Saint Pat’s usually falls in historically bullish Triple-Witching Week.
Whatever the case, since 1950, the S&P 500 posts an average gain of 0.28% on Saint Patrick’s Day (or the next trading day when it falls on a weekend), a gain of 0.05% the day after and the day before averages a 0.10% advance. S&P 500 median values are 0.17% on the day before, 0.23% on Saint Patrick’s Day and 0.03% on the day after. In the ten years when St. Patrick’s Day fell on a Friday, like this year, since 1950, the day before (Thursday) produced an average gain of 0.89%, while Friday averaged –0.01% and the following Monday averaged –0.08%.
|
March 2023 Strategy Calendar
|
|
By:
Christopher Mistal
|
February 16, 2023
|
|
|
|
|
Stock Portfolio Updates: Markets Have Stumbled After Golden Cross
|
|
By:
Christopher Mistal
|
February 09, 2023
|
|
|
|
One week ago, today a Golden Cross occurred on S&P 500’s chart. A Golden Cross happens whenever the 50-day moving average crosses back above the 200-day moving average. Historically, Golden Crosses have been viewed as bullish as they typically only occur after a period of sustained positive momentum. The current S&P 500 Golden Cross occurred after it had rallied 16.8% from its October closing low to its February 2, close.
Based upon the last week of trading there are likely a few questions about Golden Crosses and just how bullish they really have been. To answer these questions, we dug into our database of S&P 500 data that has been extended back to 1930. We found 52 prior Golden Crosses and can confirm they are in fact bullish, but with a few caveats.
![[S&P 500 Golden Cross Table]](/UploadedImage/AIN_0323_20230209_SP500_Gold-Cross_Table.jpg)
From 1930 to about 1950, when many of the years were plagued with economic depression and war, Golden Crosses were not all that reliable as bullish signals or confirmation of a bullish move. Many were followed by losses in the next week or 2, or some time over the next 3 months. From 1950 through 2020, Golden Crosses were generally followed by substantially above average gains and frequency when compared to all rolling periods. 3-months after a Golden Cross since 1950 proved to be the most bullish period with an average gain of 4.24% and advances occurring 75.0% of the time compared to all rolling 3-month periods of 1.80% and advances occurring 62.6% of the time.
The current Golden Cross combined with other indicators, seasonals and trends does strengthen the bullish case and improve the odds of continued gains for the remainder of the Best Months and the Sweet Spot of the 4-year cycle. But we still expect some chop and occasional volatility along the way as the market digests news headlines and incoming economic data.
Free Lunch Update
Of the original 38 stocks selected for our annual
Free Lunch basket back in December, 8 survived the volatility of late-December through the beginning of the year. As of the close on February 8, only two positions remained,
Intrepid Potash (IPI) and
Allot (ALLT). The other six were stopped out when they closed below their respective 8% trailing stops (closing prices). We will continue to hold IPI and ALLT with the same suggested 8% trailing stop.
As a reminder, Free Lunch stocks are not intended to be held for long. Should a sizable profit present itself, do not hesitate to lock it in. Also, small-cap outperformance has historically begun to wane in February (page 114, 2023 STA) as the bulk of the move from around mid-December has already occurred.
Stock Portfolio Updates
Over the last four weeks since last update through yesterday’s close (February 8), S&P 500 advanced 3.7% while Russell 2000 climbed 5.3%. Over the same period the entire portfolio advanced 1.6%, excluding dividends and any fees. Lagging healthcare and energy related positions combined with a sizable cash balance in the portfolio held overall performance in check compared to the major indexes. We are not targeting a specific level of cash in the portfolio, and we will be presenting additional new stock ideas in coming weeks.
Weakness in healthcare positions appears to be a combination of waning pandemic spending and rotation out of last year’s winners back into higher growth tech names. This could continue for a while longer, but it will end. Demand for and spending on all things healthcare related continues to climb and despite all the talk about lowering prices for services in this sector, it rarely if ever seems to happen. CCRN, ELV and UNH can all be considered at or near current levels.
Generally mild winter weather and recession fears have kept energy demand and its prices subdued since they spiked to multi-year highs last year. If $70-80 per barrel is the low range for crude oil, then it could easily see a surge higher as spring and the summer driving season get underway in several weeks. Historically, crude oil and natural gas prices tend to make seasonal bottoms in February and rise until June or July. Both natural gas and crude appear to be in the process of bottoming. This suggests the next move for energy related positions will likely be higher. EPSN, SOI, MUR, and EOG can all be considered at or near current levels.
Outside of energy and healthcare, Digi International (DGII) and Fabrinet (FN) have also been struggling this year. Both were positive last year, significantly outperforming the broader indexes and are likely experiencing some profit taking this year. DGII did report better than anticipated earnings and revenues for its most recent quarter. FN also reported solid quarterly results that included profit margin expansion. DGII and FN can both be considered at or near current levels.
Except for Free Lunch positions, MGPI and T, all other positions in the portfolio can be considered on dips. Please see the table below for updated stop losses and buy limits. Buy limits are based upon closing prices from today, February 9. Positions that say “Buy Dips” can be considered at any price better than (lower) today’s close. Positions with “Buy Current” can be considered at up to 3% above today’s close.
Disclosure note: Officers of Hirsch Holdings Inc hold positions in EPSN, MUR & PR in personal accounts.
|
ETF Trades & Portfolio Updates: Gains Continue to Accumulate
|
|
By:
Christopher Mistal
|
February 02, 2023
|
|
|
|
Whenever we are discussing our January Indicator Trifecta, without fail there is always a question such as, “what about years when the Fed was tightening?” or “this time is different” comes up. It came up in yesterday’s Member’s Only webinar and today we will attempt to answer it with some additional data. If you missed the webinar, you can watch the video and download a copy of the slides
here.
In the following table we have taken our January Indicator Trifecta table after a bear market in the previous year and added the closing high and low for the Trifecta year, the largest drawdown of the year along with what the Fed’s key interest rate was at the start of the year and at the end of the year. All S&P 500 data back to 1950 is closing price. There are some interesting similarities as well as differences across the Trifecta years following bear markets. The first striking similarity was for the annual low to be early in the year, most frequently in January. The annual high was nearly as frequently in December. Basically, the textbook perfect, steady rise higher from beginning of the year to its end.
A second similarity shared across all 13 previous Trifecta years following a bear was a below average drawdown during the year. Using all years since 1950, excluding these 13 Trifecta years, S&P 500 endured an average drawdown of 14.9% compared to just 8.4% for the Trifecta years. Astute observers may notice the 1971 drawdown was a mild bear market as noted on page 134 of the 2023 Almanac. In August of 1971, President Nixon stopped the convertibility of gold and enacted wage and price controls eventually leading to U.S. dollar devaluation. Looking back to 2017, it is nearly unbelievable that the worst drawdown was just 2.8% during the entire year. Nonetheless, 8 of 13 Trifecta years had just single-digit drawdowns. Most of the worst drawdowns in each year started and finished in the “Worst Six Months,” May to October.
Shifting focus to interest rates is where we see the first notable differences appear. Although most of the Trifecta years occurred with Fed Funds somewhere between 2% and 5.5%, they also occurred in rising years, falling years, unchanged years, near zero years and even twice with rates over 10%. Of the two over 10% years, one was rising, and the other was falling. Today’s Fed Funds rate and its currently projected peak would appear to land right in the heart of the range that many past Trifecta years had.
When looking at other significant economic data such as inflation and GDP, past Trifecta years appear to have experienced it all. It would seem no matter how we slice and dice past Trifecta years following bear markets, this year’s Trifecta remains a highly significant and bullish indicator for 2023. It does not guarantee a great year, but it sure does improve the prospects for another solid pre-election year with average to above average gains.
New Sector Seasonalities
There are two sectors that begin their seasonally favorable periods in March: High-Tech and Utilities. As we detail in the 2023 Almanac, on page 94 “Sector Seasonality”, we typically present the trade setups in advance of when the seasonality begins. This year we are going to look to take advantage of any seasonal weakness in February to establish new positions associated with these sectors. As you can see above, even in Trifecta years following bear markets, February has experienced weakness during four of the previous 13 years.
In the following weekly bar chart of the Utility Sector Index (UTY), seasonal strength (lower pane, shaded in yellow) typically begins following an early or mid-March bottom and usually lasts through early October although the bulk of the move is typically done sometime in late May or early June (blue arrow). Recent volatile trading has impacted the seasonal pattern in the lower pane of the chart. Typically the pattern is less choppy as the sector does not usually experience major price swings in a year. Utilities tend to be a defensive sector of the market and historically have seen gains during the “Worst Six Months,” May through October. Declining long-dated Treasury bond yields are also likely to lift utility shares as their dividend becomes increasingly attractive.
![[Utility Sector Index (UTY) Weekly Bars and Seasonal Trend Chart]](/UploadedImage/AIN_0323_20230202_UTY_Seasonal_Chart.jpg)
With nearly $16 billion in assets and ample average daily trading volume, SPDR Utilities (XLU) is our top choice once again to consider holding during Utilities’ seasonally favorable period. It has a gross expense ratio of just 0.10% and a relatively attractive yield approaching 3%. Top five holdings include: NextEra Energy, Duke Energy, Southern Co, Dominion Resources and Sempra Energy.
XLU could be considered on dips with a buy limit of $67.35. This is right around its projected monthly pivot support level (green-dashed line in daily bar chart below). XLU has been drifting sideways to lower since mid-December and could find its seasonal bottom soon. Based upon its 25-year average return of 9.8% (excluding dividends and trading fees) during its favorable period mid-March to the beginning of October, set an auto-sell price at $88.74. If purchased an initial stop loss of $62.06 is suggested.
Our favorite ETF to trade Infotech’s seasonal strength from mid-March through the beginning of July is iShares DJ US Tech (IYW). Our existing position was up 12.7% as of the close on Feb 1. Any February weakness could be an opportunity to consider establishing a new position or add to an existing position. IYW can be considered on dips.
Sector Rotation ETF Portfolio Update
January’s nearly across-the-board strength translated into solid gains across most of the portfolio. As of the close on February 1, the portfolios Open Position Average Return was 12.6%, up from 6.2% at the start of January. Nine positions have double-digits gains lead by SPDR Materials (XLB) at 21.9%. SPDR Industrials (XLI) are second best, up 20.1% since our Seasonal MACD Buy signal back in early October.
Per last month’s update, iShares DJ US Telecom (IYZ) was closed out of the portfolio on January 6 for a 9.8%. Typically, seasonal strength has come to an end in late December, but broad market strength appears to have extended IYZ’s run into February this year. In hindsight, a tighter trailing stop would have worked better than an outright sell. Nonetheless, the nearly 10% gain, excluding dividends and trading fees, is above the long-term average for the sector.
Healthcare and Energy did not participate in January’s rally. SPDR Healthcare (XLV) slipped modestly over the month but is still 8.7% higher since addition last October. XLV is likely suffering from some rotation out of this somewhat defensive sector and back into higher growth tech stocks. Current weakness in XLV looks like a good opportunity to either establish a new position or add to an existing position. XLV’s current sideways trading range does appear to resemble its sideways range back in mid-2015 through early 2017.
SPDR Energy (XLE) did improve modestly however it is still in the red since its addition to the portfolio in early December. XLE can be considered at current levels. If recession fears and the largest drawdown of the Strategic Petroleum Reserve (SPR) only pushed crude oil down into the $70-80 per barrel range, it could easily rocket higher if no recession materializes when the summer driving season arrives.
Last month’s new trade idea, First Trust Natural Gas (FCG), has not yet traded below its buy limit. FCG can still be considered on dips. Natural gas price has retreated substantially on warmer than average winter weather and FCG is beginning to feel the pressure. With seasonal strength in natural gas companies historically beginning in February, this trade appears to be setting up nicely.
All other positions in the Sector Rotation portfolio can also be considered on dips. Any weakness in February is likely to be brief as the bullish case for all of 2023 continues to build.
Tactical Seasonal Switching Strategy Portfolio Update
As of yesterday’s close, the Tactical Seasonal Switching Strategy portfolio had an average gain of 10.6% since our Seasonal Buy Signal. SPDR DJIA (DIA) is the best performing position up 13.0%. iShares Russell 2000 (IWM), is the second-best performing position in the basket, up 12.2%. Surging Invesco QQQ (QQQ) is pulling SPDR S&P 500 (SPY) higher and appears to be on track to take over the top spot in the portfolio. For the same reasons mentioned above, all positions in the portfolio can be considered on dips.
As a reminder, positions in the Tactical Switching Strategy portfolio are intended to be held until we issue corresponding Seasonal MACD Sell Signals after April 1 for DJIA and S&P 500 and after June 1 for NASDAQ and Russell 2000. For this reason, there are no stop losses associated with these positions. There is also a switching strategy outline on page 64 of the 2023 Almanac that holds these positions throughout pre-election and election years.
|
Positive January Barometer Completes Bullish January Indicator Trifecta
|
|
By:
Jeffrey A. Hirsch & Christopher Mistal
|
January 31, 2023
|
|
|
|
In stark contrast to last year, 2023 is off to a bullish start. S&P 500 finished the month strong with a 6.2% gain and thus our January Barometer is positive. This is the best S&P January since 2019 which was also the last year the S&P 500 completed our bullish January Indicator Trifecta.
Devised by Yale Hirsch in 1972, the January Barometer has registered 12 major errors since 1950 for an 83.6% accuracy ratio. This indicator adheres to propensity that as the S&P 500 goes in January, so goes the year. Of the 12 major errors Vietnam affected 1966 and 1968. 1982 saw the start of a major bull market in August. Two January rate cuts and 9/11 affected 2001.The market in January 2003 was held down by the anticipation of military action in Iraq. The second worst bear market since 1900 ended in March of 2009 and Federal Reserve intervention influenced 2010 and 2014. In 2016, DJIA slipped into an
official Ned Davis bear market in February. 2018 was the tenth major error overall as a hawkish Fed, a trade war and slowing global growth concerns resulted in the worst fourth quarter performance by S&P 500 since 2008. Covid-19 impacted 2020 & 2021. Of the 12 major errors, nine have occurred since 2001. Including the eight flat years yields a .726 batting average.
Our January Indicator Trifecta combines the Santa Claus Rally, the First Five Days Early Warning System and our full-month January Barometer. The predicative power of the three is considerably greater than any of them alone; we have been rather impressed by its forecasting prowess. This is the 32nd time since 1949 that all three January Indicators have been positive and the twelfth time (previous 12 times highlighted in grey in table below) this has occurred in a pre-election year.
As you can see in the table above, the long-term track record of the Trifecta is impressive, posting full-year gains in 28 of the 31 prior years with an average gain for the S&P 500 of 17.5%. When the
January Indicator Trifecta was preceded by a bear market in the year prior the results are even more striking, next 11-months and full-year performance was always positive with average gains of 16.8% and 22.1% respectively.
With the Fed nearing the end of its interest rate hike cycle, inflation trending lower, and corporate earnings forecast to trough in the first half of 2023 we are affirming our shift in our
2023 outlook to our Best-Case Scenario for above average pre-election-year gains of at least 15-20%.