We just lost a great market analyst, market timer and champion of investors. We found out today that Sy Harding, editor of the
Street Smart Report passed away this week. We wish the Harding family our deepest sympathies. Sy was frequently ranked as “Top Ten Market Timer” and helped investors make money for more than 26 years.
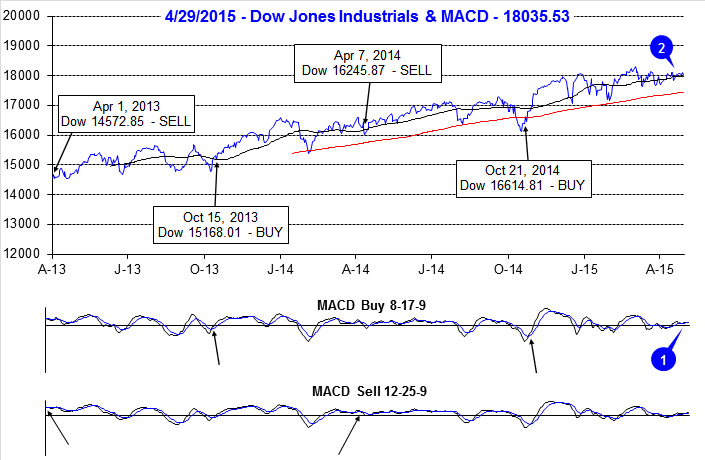
Perhaps his most famous contribution to market analysis and investment strategies was when he enhanced our “Best Six Months Switching Strategy” with Gerald Appel’s MACD indicators, dubbing it the “best mechanical system ever.” His “Seasonal Timing System” was made famous in his critically acclaimed book Riding the Bear (Adams Media, 1999).
As we enter the Worst Six Months May-October, it is important not to get hung up on the infamous phrase: “Sell in May and go away.” We do not suggest purely going away in May. We do however, suggest changing your investment posture from aggressive to defensive and taking some action, especially with the market looking like it’s on shaky ground and ready to breakdown.
We generally, limit new long positions (unless it is in a
good Worst Six Months sector), sell losers or underperformers we have lost confidence in, tighten stops and begin to put on defensive positions in bonds and shorts. With the market now in the red for 2015 and quite weak in usually strong April, negative implications are building. GDP disappointed, while jobs and housing languish. Greece is likely to remain in the Euro, but it’s going to be expensive and a drag on the European economy, while the Eurozone and the big Asian economies are already struggling.
May has been weaker lately and especially so in pre-election years. Also our favorite
sentiment survey,
Investors Intelligence % Advisors Bullish and Bearish has gotten more complacent. The new market highs coincided with a hefty rise in Bulls to 57.4%, up from 52.5% and 50.5% the previous two weeks. Bears dropped to 13.9% from 15.2% and those expecting a correction fell to 28.7& from 15.2%. It’s not quite extreme yet, but it’s close.
Vegas Baby!
- Tuesday, May 12, 2015 3:15 PM - 3:45 PM Stage Presentations in the Exhibit Hall - What's Next for the Stock Market?
- Thursday, May 14, 2015 8:00 AM - 8:45 AM Educational Presentation - Learning the Discipline and Strategies to Become a Successful Trader
- Thursday, May 14, 2015 11:10 AM - 11:55 AM Investment Masters Symposium Presentation - Tactical Sector Rotation Strategies
On Thursday, May 14, 2015 join Jeff & Joe Childrey, Probabilities Fund Management Founder & CIO for a special
ADVISORS ONLY Happy Hour! - RSVP
Jeff.Hirsch@hirschorg.com
Official Seasonal MACD Sell Signal Triggers
It is rather ironic that on the day we hear of Sy’s passing we issue our Best Six Months Seasonal MACD Sell Signal. As of today’s close, both the slower and faster moving MACD indicators applied to DJIA and S&P 500 are negative. At this time, we are issuing our official MACD Seasonal Sell signal for DJIA and S&P 500. NASDAQ’s “Best Eight Months” last until June.
Current technical, fundamental, seasonal, sentiment and monetary policy outlooks are aligning to signal increasing odds of a volatile ‘Worst Six Months” this year. Year-to-date gains, in a pre-election year, are well below average which is also worrisome. Although the odds of an outright 20% bear market remain low, the odds of a 10-19.9% correction in late Q2 or Q3 are rising.
Sell SPDR DJIA (DIA), SPDR S&P 500 (SPY), SPDR Retail (XRT), iShares DJ Transports (IYT), SPDR Financial (XLF), SPDR Industrial (XLI) and SPDR Materials (XLB).
Continue to Hold technology and small cap related ETFs as NASDAQ’s “Best Eight Months” ends in June.
We will also continue to Hold healthcare and consumer staples related ETFs as both sectors have track records of outperforming during the “Worst Six Months.”
Buy AdvisorShares Ranger Equity Bear (HDGE) on dips with a Buy Limit of 10.78, iShares 20+ Year Treasury (TLT) on dips with a Buy Limit of 125.73 and iShares Core US Aggregate Bond (TLT) on dips with a Buy Limit of 110.86.
Traders/investors following the Best 6 + 4-Year Cycle switching strategy detailed on page 62 of the Stock Trader’s Almanac 2015 can ignore this signal, but should strongly considering tightening stop losses and adding some downside protection.
Pulse of the Market
As we write this sentence, the faster and slower moving MACD indicators applied to DJIA (1) and S&P 500 are flirting with turning negative. When MACD Sell indicators applied to both DJIA and S&P 500 turn negative, the Worst Six Months will officially begin. A DJIA close below 17970.13 and S&P 500 below 2095.80 today is what is would take. Beyond DJIA’s MACD indicator, its loss of positive momentum is rather clear as it continues to struggle with its 50-day moving average (2). Should DJIA fail to hold its 50-day average, it next key support level, the 200-day moving average is currently at 17377.
Absent catalyst, the market has traded essentially sideways since mid-December. Over the past 20 weeks DJIA (3) has been up 10 and down 10 with a net gain of just 121.35 points. The seesaw battle between bulls and bears has really heated up on Fridays and Mondays with rather large DJIA point moves in both directions (4). Thus far the battle has been a draw. Should the bears get the upper hand on Fridays and Mondays, the market will likely take a turn toward the downside. S&P 500 (5) and NASDAQ (6) have the same weekly record over the past 20 weeks, although they have broken out to modestly higher new all-time highs.
One bright spot for the market is that the ratio of Weekly NYSE Advancers to Decliners remains reasonably healthy. The number of NYSE Weekly New Highs (7) has been constrained in recent weeks, which is a reason for concern, but Weekly New Lows remain subdued. Should New Lows begin to swell, then the market will be in trouble. For now, it is meandering with an upward bias.
After hitting its lowest reading since June 2014, six weeks ago, the weekly CBOE Put/Call ratio (8) has returned to a neutral level of 0.61. At this level, it provides little insight into the market’s next move. A reading above 0.70 accompanied by market weakness would suggest the worst could be over while a reading under 0.50 would suggest traders and investors are “all in” and further gains are likely to be limited and short-lived.
Click for larger graphic…
Disclosure Note: At press time, officers of the Hirsch Organization, or accounts they control held positions in UNG, USO, XLU and XLV.
|
May Almanac: A Tough Month for Large Caps in Pre-Election Years
|
|
By:
Jeffrey A. Hirsch & Christopher Mistal
|
April 28, 2015
|
|
|
|
May officially marks the beginning of the “Worst Six Months” for the DJIA and S&P. To wit: “Sell in May and go away.” Our “Best Six Months Switching Strategy,” created in 1986, proves that there is merit to this old trader’s tale. A hypothetical $10,000 investment in the DJIA compounded to $816,984 for November-April in 64 years compared to $221 loss for May-October. The same hypothetical $10,000 investment in the S&P 500 compounded to $607,883 for November-April in 65 years compared to a gain of just $8,090 for May-October.
May has been a tricky month over the years, a well-deserved reputation following the May 6, 2010 “flash crash”. It used to be part of what we called the “May/June disaster area.” From 1965 to 1984 the S&P 500 was down during May fifteen out of twenty times. Then from 1985 through 1997 May was the best month, gaining ground every single year (13 straight gains) on the S&P, up 3.3% on average with the DJIA falling once and two NASDAQ losses.
In the years since 1997, DJIA’s May performance has been abysmal, up only seven times in the past seventeen years (three of the years had gains in excess of 4%). NASDAQ suffered five May losses in a row from 1998-2002, down – 11.9% in 2000, followed by seven sizable gains in excess of 3% and four losses, the worst of which was 8.3% in 2010. Since 1950, pre-election-year Mays rank poorly, #10 DJIA and S&P 500, #7 NASDAQ and #5 Russell 2000.
Based upon the S&P 500, Monday before May option expiration is much stronger than expiration day itself albeit weaker for small caps. Big caps have registered six losses in the last twenty-five years. Expiration day is a loser across the board. The full week had a bullish bias that has faded in recent years and down four straight, 2009-2012. Since 1998, the week after options expiration week is bearish. DJIA has fallen in ten of the last sixteen weeks after.
On Friday before Mother’s Day the DJIA has gained ground thirteen of the last twenty years and on the Monday after (the first day of options expiration this year), the blue-chip average has risen in fifteen of those years.
The first two days of May trade higher frequently and the S&P 500 has been up 17 of the last 25 first trading days. A bout of weakness often appears on the third, fourth, fifth and fifteenth trading days for large cap stocks but the middle of the month tends to be better.
| May (1950-2014) |
| |
DJI |
SP500 |
NASDAQ |
Russell
1K |
Russell 2K |
| Rank |
|
9 |
|
8 |
|
5 |
|
6 |
|
5 |
| #
Up |
|
33 |
|
37 |
|
26 |
|
24 |
|
23 |
| #
Down |
|
32 |
|
28 |
|
18 |
|
12 |
|
13 |
| Average
% |
|
-0.04 |
|
0.2 |
|
0.8 |
|
0.9 |
|
1.3 |
| 4-Year Presidential Election Cycle Performance
by % |
| Post-Election |
|
1.3 |
|
1.7 |
|
3.4 |
|
3.2 |
|
4.6 |
| Mid-Term |
|
-0.7 |
|
-0.9 |
|
-1.2 |
|
-0.1 |
|
-1.9 |
| Pre-Election |
|
0.03 |
|
0.2 |
|
1.8 |
|
1.2 |
|
2.7 |
| Election |
|
-0.8 |
|
-0.2 |
|
-0.7 |
|
-0.5 |
|
-0.2 |
| Best & Worst May by % |
| Best |
1990 |
8.3 |
1990 |
9.2 |
1997 |
11.1 |
1990 |
8.9 |
1997 |
11.0 |
| Worst |
2010 |
-7.9 |
1962 |
-8.6 |
2000 |
-11.9 |
2010 |
-8.1 |
2010 |
-7.7 |
| May Weeks by % |
| Best |
5/29/70 |
5.8 |
5/2/97 |
6.2 |
5/17/02 |
8.8 |
5/2/97 |
6.4 |
5/14/10 |
6.3 |
| Worst |
5/25/62 |
-6.0 |
5/25/62 |
-6.8 |
5/7/2010 |
-8.0 |
5/7/10 |
-6.6 |
5/7/10 |
-8.9 |
| May Days by % |
| Best |
5/27/70 |
5.1 |
5/27/70 |
5.0 |
5/30/00 |
7.9 |
5/10/10 |
4.4 |
5/10/10 |
5.6 |
| Worst |
5/28/62 |
-5.7 |
5/28/62 |
-6.7 |
5/23/00 |
-5.9 |
50/20/10 |
-3.9 |
5/20/10 |
-5.1 |
| First Trading Day of Expiration Week: 1990-2014 |
| #Up-#Down |
|
19-6 |
|
19-6 |
|
16-9 |
|
18-7 |
|
13-12 |
| Streak |
|
U1 |
|
U2 |
|
U2 |
|
U1 |
|
U1 |
| Avg
% |
|
0.4 |
|
0.4 |
|
0.4 |
|
0.4 |
|
0.1 |
| Options Expiration Day: 1990-2014 |
| #Up-#Down |
|
11-14 |
|
12-13 |
|
12-13 |
|
12-13 |
|
11-14 |
| Streak |
|
U2 |
|
U2 |
|
U2 |
|
U2 |
|
U2 |
| Avg
% |
|
-0.1 |
|
-0.2 |
|
-0.2 |
|
-0.2 |
|
-0.1 |
| Options Expiration Week: 1990-2014 |
| #Up-#Down |
|
14-11 |
|
13-12 |
|
14-11 |
|
12-13 |
|
14-11 |
| Streak |
|
D1 |
|
D1 |
|
U2 |
|
D1 |
|
D1 |
| Avg
% |
|
0.3 |
|
0.2 |
|
0.3 |
|
0.2 |
|
-0.2 |
| Week After Options Expiration: 1990-2014 |
| #Up-#Down |
|
14-11 |
|
15-10 |
|
16-9 |
|
15-10 |
|
19-6 |
| Streak |
|
U1 |
|
U1 |
|
U1 |
|
U1 |
|
U1 |
| Avg
% |
|
-0.2 |
|
0.1 |
|
0.2 |
|
0.1 |
|
0.4 |
| May 2015 Bullish Days: Data 1994-2014 |
| |
1,
4, 8, 12, 28 |
1,
12, 28 |
1,
8, 19, 28 |
1,
12, 28, 29 |
1, 4, 12, 27, 28 |
| |
|
|
|
|
|
| May 2015 Bearish Days: Data 1994-2014 |
| |
5,
6, 21 |
5,
6, 7 |
7,
20 |
5,
6, 7 |
7, 14 |
| |
|
|
|
|
|
|
May 2015 Strategy Calendar
|
|
By:
Christopher Mistal
|
April 28, 2015
|
|
|
|
|
New All-Time NASDAQ High & ETF Portfolio Updates
|
|
By:
Christopher Mistal
|
April 23, 2015
|
|
|
|
It has been a long 15 years plus, but today NASDAQ finally eclipsed its previous all-time closing high of 5048.62 set on March 10, 2000. This is a significant accomplishment for NASDAQ that will undoubtedly draw attention to today’s tech valuations. Granted, many companies do look rich today compared to standard valuation metrics, but today’s NASDAQ and the companies that comprise the index are far different than 15 years ago. Many of today’s tech companies are aggressively growing revenues and earnings which helps justify their valuation premium. 15 years ago, the valuation premium was largely based on pure speculation as many of the dot-com companies then did not have anywhere near the revenue or earnings growth that exists today.
The next hurdle for NASDAQ, which keeps going higher with every monthly inflation reading, is to clear its real all-time high. Inflation adjusting NASDAQ for the last 15 years produces a real all-time high of just under 7000. From today’s close NASDAQ needs to climb an additional 38.5% to be at a real all-time high.
ETF Portfolio Updates
With the market on the verge of fresh new highs, the Almanac Investor ETF Portfolio “Open Position Average % Return” has swelled to 10.1%. Current leaders include: iShares DJ US Medical Devices (IHI) up 20.7%, SPDR Healthcare (XLV) up 18.8% and First Trust ISE-Revere Natural Gas (FCG) up 16.1% at yesterday’s close. Strength from health care related concerns is not surprising given the returns the sector has produced in recent years however FCG’s solid advance is somewhat confusing considering recent weakness by natural gas. As a result of ample supply and tempered demand, United States Natural Gas (UNG) was stopped out on April 9 for a 10.8% loss. Short-term outlook for natural gas is not all that bright so no new trade idea is being presented at this time.
Due to recent market strength, defensive trade ideas, AdvisorShares Ranger Equity Bear (HDGE), iShares 20+ Year Treasury Bond (TLT) and iShares Core US Aggregate Bond (AGG), for the upcoming “Worst Six Months” have come under pressure, but thus far have not traded under their respective buy limits. Buy limits are unchanged as we will remain patient. Should the market continue to rally they may become cheaper and if the rally falters our Seasonal MACD Sell Signal could be used to establish new long positions in these defensive trade ideas.
With the exception for HDGE, TLT and AGG, the balance of the portfolio is on Hold. The “Best Six Month” for DJIA and S&P 500 end soon and many other sector seasonalities come to an end in May. Please note Stop Losses in table below. Recent gains by several positions have resulted in higher stop losses.
Disclosure Note: At press time, officers of the Hirsch Organization, or accounts they control held positions in UNG, USO, XLU and XLV.
|
Seasonal MACD Switching Strategy Update & Bullish Days of Week
|
|
By:
Christopher Mistal
|
April 21, 2015
|
|
|
|
For nearly five decades the annual Stock Trader’s Almanac has studied and analyzed the importance of Mondays (or first trading day of the week) and Fridays (or the last trading day of the week). Friday is the day for squaring positions. Long exposure is trimmed and/or short positions are covered before traders take off for the weekend. This is done to reduce headline risk over the weekend. Mondays are significant because this is the day that weekend news and developments are digested along with any early Monday morning research and strategy comments.
No matter how you slice it, Friday and Monday are important days. Last Friday, the market sold off in excess of 1% on concerns of Chinese growth and possible new market regulation there along with renewed worries about Greece. But, when these concerns failed to materialize over the weekend, the market rallied on Monday to gain better than 1%.
In the following charts the percentage of times DJIA, S&P 500 and NASDAQ have closed higher on each day of the week are presented. The baseline chart is of the S&P 500 using data from March 9, 2009 through the end of 2014. Year-to-date charts then follow. Over the entire bull market’s life gains have been fairly equally spread over each day of the week. Over the course of the entire bull market, Thursday has been the most consistently positive day, posting a gain 58.1% of the time.
However in 2015, Monday (or the first trading day of the week) has been best for DJIA and S&P 500, positive 62.5% of the time. Friday (or last trading day of the week) has been 50/50 for DJIA and a net loser for S&P 500. As of yesterday’s close, only Monday and Thursday have winning records and currently account for all of the market’s meager gains this year. Presently the best strategy appears to be buying weakness on Fridays and Wednesdays ahead of solid gains on Mondays and Thursdays.
MACD Update
As of the close yesterday, both the faster moving MACD “Buy” and slower moving MACD “Sell” indicators (at bottom of following charts) applied to DJIA and S&P 500 were positive. Damage done to the indicators on Friday was largely undone by Monday’s gains. Today’s down trading has moved the “Sell” indicator closer to triggering. A 0.3% DJIA decline and a 0.9% S&P 500 decline on Wednesday would turn respective MACD negative.
Continue to hold long positions associated with DJIA’s and S&P 500’s “Best Six Months.” We will continue to monitor the fundamental and technical outlook and issue our Seasonal MACD Sell signal when corresponding MACD Sell indicators applied to DJIA and S&P 500 both crossover to sell.
|
Mid-Month Update: Fed Rate Cycle Review & Seasonal MACD Switching Strategy Update
|
|
By:
Christopher Mistal
|
April 16, 2015
|
|
|
|
One headwind that exists for the market is the first Fed funds rate increase since June 2006. That 0.25% rate hike nudged the target rate to 5.25% and marked the last move in a major tightening cycle that began in June 2004. Including this cycle, there have been five major Fed cycles (up and down) since 1973. A major Fed cycle is defined as the overarching Federal Reserve policy with respect to the Fed funds rate. During major Fed tightening phases, tweaking of the rate towards an easing bias may have occurred, but the Federal Reserve returned to a tightening bias after the decrease. Major tightening phases appear in the table below. From the Fed Funds rate current value of 0-0.25%, it is clear there are really only two options available: the rate either goes up or remains roughly where it presently is even longer.
The period between tightening and easing periods, we dub Fed Transition Periods. This is the time period when the Fed was generally satisfied that rates were appropriate for economic conditions. During the tail end of Transition Periods, the Fed tends to shift wording in its statements in an attempt to ready Wall Street and prepare traders and investors for a rate change. We are currently in the tail end of a transition period with the Fed, rather timidly, attempting to signal when it will move to raise its target rate.
On average, the year prior to a major Fed Funds rate tightening cycle has been positive. However, one month after a major shift in policy towards tightening, the market has never been up, and averaged a loss of 2.7%. Three months later has been even more negative with an average loss of 4.8%. From six months to one year later, the averages are still negative, but a few modest gains have occurred. Also notable are that the last two times that tightening occurred with DJIA at or near all-time highs (1973 and 1999) the result was clearly negative.
Unlike these past five major rate hike cycles, today’s Fed will not be moving to fight inflation or cool economic growth. Inflation is running below their target and current U.S. GDP readings are not exactly red hot. What the Fed wants (or needs) to do is raise the target rate in order to have ammunition for the next time our economy stumbles. A well-telegraphed series of small rate increases could allow the Fed to “reload” while having only a minimal to modest impact on overall economic activity. It would be another spectacular tight rope act for the Fed to pull off, but their recent track record suggests it is something possible. One certainty that exists is the fact that the Fed will do no harm to the market or the economy, especially with the next presidential election cycle beginning already.
MACD Update
As of the close yesterday, both the faster moving MACD “Buy” and slower moving MACD “Sell” indicators (at bottom of following charts) applied to DJIA and S&P 500 were positive and trending higher. At the start of month, we
anticipated April’s historical prowess for gains would eventually lift the market. Thus far, the market has lived up to expectations.
Since April 2, DJIA and S&P 500 have moved decisively higher to reclaim their respective 50-day moving averages (solid magenta line). Stochastic and relative strength indicators have responded to the move with positive readings. About the only cause for concern is DJIA and S&P 500 have run into projected monthly resistance (red dashed line) and appear to be stalling. If they can break through resistance, they will likely move to new all-time highs again.
Continue to hold long positions associated with DJIA’s and S&P 500’s “Best Six Months.” We will continue to monitor the fundamental and technical outlook and issue our Seasonal MACD Sell signal when corresponding MACD Sell indicators applied to DJIA and S&P 500 both crossover to sell again.
|
Seasonal Sector Trades: Long Bond & S&P 500 Late April Rallies
|
|
By:
Christopher Mistal & Jeffrey A. Hirsch
|
April 14, 2015
|
|
|
|
As featured in Commodity Trader’s Almanac 2013 (a 2016 edition is under consideration), there exists an inverse relationship between bond yield and price. When yield or interest rates go up, bond prices go down and vice versa. When investors feel threatened with a potential decline in the stock market, they allocate more money into bonds. This is often referred to as the “flight to safety” trade. Investors will also allocate more money to bonds when they believe the yield is more attractive than other shorter-term investment options.
There is no doubt that both of those conditions were met in late 2008 through early 2009. However, even in that unprecedented time, 30-year bond price action did respect a seasonal supply-demand cycle. By going long, the September 30-year bond on or about April 27, and exiting the position on or about August 22, we discovered in the last 37 years a solid 70.3% success rate. This trade has a history of 26 wins with only 11 losses; the largest win was $20,250 in 2011, and the largest loss was $17,031 in 2013. In recent years, 30-year Bond strength has lasted even longer, until yearend and even into January.
The 2009 stock rally off the bottom of the worst bear market since the Depression drove bonds lower. However, if one waited and used timing tools then we would have seen substantial gains. In 2013, this trade was a bust as the Federal Reserve began telegraphing a reduction in QE and stocks were having their best year in over a decade driving demand and prices for the 30-year bond lower. Although the specter of Fed interest rate hikes looms large, this trade will likely still perform this year as our bond yields remain attractive to foreign buyers. Our 30-year Treasury bond yielding 2.5% does compare quite favorable to Germany’s 0.58% or Japan’s 1.35%.
Stock traders may consider the exchange-traded fund, iShares 20+ Year Bond (TLT), as a replacement for the futures contract. TLT has in excess of $6.4 billion in assets, typically trades more than 9 million shares per day and has a reasonably deep and liquid options chain available.
Stochastic, MACD and relative strength indicators applied to TLT have been negative since the second half of March, but are beginning to show signs of improvement. Despite fears of the Fed possibly raising rates later this year, TLT has held up well. It has remained above its 200-day moving average since last February and any dips below its 50-day moving average have ultimately proven to be a good entry point for new long positions. This trade overlaps nicely with last week’s trade idea of adding TLT to the Almanac Investor ETF Portfolio on dips below $124.88. This trade will be tracked in the ETF Portfolio.
Late April Long S&P 500 Trade
The best six months for owning stocks can begin in October or early November and typically lasts until April for DJIA and S&P 500. However, seasonal strength for technology stocks, measured by NASDAQ, tends to last until June (“Best Eight Months”, see page 60 Stock Trader’s Almanac 2015). Due to its substantial weighting in technology, the S&P 500 also demonstrates a tendency to rally from late April until early June.
Although this trade has been profitable 66.7% of the time over the longer-term, its recent track record has been rough, declining six times in the last nine years. However, going long the September futures contract on or about April 27 and holding until on or about June 7 has worked 22 times in 33 years. The key to this trade is overall market trend and proper trade management as numerous sizable losses and gains have occurred over trade’s history. This is a shorter-term trade, for nimble traders, and is not related to our Seasonal Switching Strategy.
There are several ways to take advantage of this Spring rally. One is through the futures markets traded at the CME. Stock traders may wish to explore trading SPDR S&P 500 (SPY), which allows one to use options. The length of time this seasonality is in play makes leveraged ETFs like ProShares Ultra S&P500 (SSO) worth consideration as well. Any weakness toward month’s end could make a possible entry point to this trade.
|
Stock Portfolio Updates: Large-Caps still Lagging
|
|
By:
Christopher Mistal
|
April 09, 2015
|
|
|
|
One question that seems to come up rather frequently is, “when will the current bull market most likely come to an end?” Now in its
seventh year, the current bull market is DJIA’s fourth longest using the standard bear market definition of a 20% decline, but it is only the fifth best by gain. Well, absent a fully functioning time machine, no one really knows. All that can really be done is compare the ends of past bull markets with present day conditions in an effort to identify some early warning signs.
One sign that has appeared this year is the outperformance of small-cap stocks when compared to large-cap stocks. An easy comparison can be represented by simply taking the Russell 2000 and dividing it by the Russell 1000 as found on the bottom of page 110 of the Stock Trader’s Almanac 2015. A similar chart appears next.
![[R2K/R1K Monthly Chart]](/UploadedImage/AIN_0515_20150409_R2K-R1K.jpg)
In the above chart, small-caps are outperforming large-caps when the line is increasing and lagging when the line is falling. Small caps spiked in late 1999 and early 2000 and reached a peak in early 2006, as the four year old bull entered its final year. They reached a peak in early 2011 just before the mini-bear that year wiped 19.4% out of the S&P 500. Small-caps last peaked at the start of 2014 and the current spike is somewhat reminiscent of previous spikes that occurred near the end of some past bull markets. The current spike by small-caps could be a warning sign that large-cap stock valuations are stretched and the current bull market has entered its twilight year. But this chart alone is not enough to forecast the end of the current bull market; it is only a warning sign worthy of continued observation.
Stock Portfolio Updates
Over the past three and a half weeks since last update, through the market’s close on April 8, S&P 500 gained a meager 0.03%. However, Russell 2000 continued to climb higher by 1.8% over the same time period while collectively the three Almanac Investor Stock Portfolios advanced 0.7%. Our Mid-Cap portfolio performed best, adding 1.7%. The Small-Cap portfolio was runner up with a 0.9% gain (limited by its currently substantial cash position) while our Large-Cap stocks stumbled and shed 1.7%.
United Continental Holdings (UAL) and Polaris Industries (PII) were the largest drags on the Large-Cap portfolio. UAL dropped 10.9% since last update. It was dragged down by broad market weakness in late March and then even lower this month when it reported domestic traffic fell in March. Recent oil strength has also weighed on airlines. PII’s decline was more likely the result of the broader market and its chart pattern. It has been stuck in a broad range between about $140 and a little less than $160 since last summer. This type of range will bring buyers near the bottom and sellers near the top. It was near the top of the range in late February and has slowly been falling since. However, it is up nearly 3% today. Longer-term prospects for UAL and PII remain bright, both are on Hold.
Large-cap, Gildan Activewear (GIL) split two for one on March 30. As a result, its “Presented Price” has been adjusted by dividing it by two. Headquartered in Canada you may or may not be all that familiar with their brands, but you have likely heard of Under Armor and New Balance, two brands that GIL manufactures for under licensing arrangements. Continue to Hold shares of GIL.
Moving on to the Mid-Cap portfolio, only Group 1 Automotive (GPI) has had a challenging time in 2015, but still remains 37% higher than when presented. Amerco Inc (UHAL), Jetblue Airways (JBLU) and Lithia Motors (LAD) have enjoyed solid moves higher and new 52-week highs. LAD was at a new high as recently as today. Such strength normally begets more gains as momentum traders rush in to catch the next move higher. GPI, UHAL, JBLU and LAD are on Hold as well.
Omnicell (OMCL), Chipmos Technologies (IMOS), Standex Intl Co (SXI) and Park-Ohio Holdings (PKOH) were the top performers in the Small-Cap portfolio this time around. Last update’s leader, Newtek Bus Services (NEWT) just missed triggering our sell-half-on-a-double rule on March 25 when it traded to a high of $19.95. It has since pulled back, but its chart remains bullish and technical indicators are beginning to turn positive again.
With the end of the “Best Six Months” for DJIA and S&P 500 imminent, all positions in the Stock Portfolio are on Hold.
See table below for updated Stop Losses.
Disclosure Note: At press time, officers of the Hirsch Organization, or the accounts they control, held a position in UNH.
|
ETF Portfolio & Seasonal Switching Strategy Updates: Defensive Trades for Worst Six Months
|
|
By:
Christopher Mistal
|
April 07, 2015
|
|
|
|
Last Thursday, I stated our case for not pulling the plug on DJIA’s and S&P 500’s “Best Six Months” early. Thus far this decision has proven timely as DJIA and S&P 500 nearly posted on gain on every day since. Today’s late day selloff ended the streak at just two days. However, broad market gains have lifted the Almanac Investor ETF Portfolio “Open Position Average % Return” from 5.3% on April 1 to 6.8% at yesterday’s close with some additional gain today.
Perhaps the biggest development since last Thursday happened on Good Friday when the market was closed. This was when March’s jobs report was released by the Bureau of Labor Statistics. It showed a net jobs increase of just 126,000 jobs in March and the unemployment rate held steady at 5.5%. The number of jobs was well below consensus and was the first reading less than 200,000 since January 2014. The report was also accompanied by downward revisions to February and January. As a result of this report and other somewhat tepid economic data lately, the hope that the Fed will wait a little longer to raise interest rates has been renewed. Based upon 30 Day Federal Funds Futures, a hike is not a real possibility until early in the fourth quarter.
![[DJIA Daily Bar Chart]](/UploadedImage/AIN_0515_20150407_DJIA.jpg)
![[S&P 500 Daily Bar Chart]](/UploadedImage/AIN_0515_20150407_SP500.jpg)
After a stumbling start to Q2, DJIA and S&P 500 nearly posted gains on three straight days and both have climbed back above their respective 50-day moving averages (solid magenta line in each chart). Stochastic and relative strength indicators have also turned positive while the faster moving MACD indicator is confirming the shift in momentum by turning positive today (blue arrows point to crossover). This crossover is additional support for maintaining long positions that correspond with DJIA’s and S&P 500’s “Best Six Months.”
Worst Months Defensive Trade Ideas
Due to the Fed’s zero interest rate policy (ZIRP), most money market accounts (and similar places to park cash during the “Worst Six Months”) pay literally nothing. This leaves few alternatives aside from the relative safety of Treasury bonds. The problem here is longer-dated maturities offer the best yield, but also tend to be the most volatile. So any benefit of a higher yield can be quickly erased by a drop in bond price. To lessen volatility shorter duration bonds are best, but here again due to ZIRP they also offer next to no yield.
The best approach would be to own Treasury bonds across the entire duration spectrum. By doing so, yield is likely to be more attractive and volatility could be trimmed. iShares Core Total US Bond Market (AGG) nicely does just this. It holds Treasuries of multiple durations, yields right around 2% and exhibits more price stability than other longer-dated Treasury bond ETFs. AGG has more than $24 billion in assets, trades more than 1 million shares a day on average and, best of all, its expense ratio is just 0.08%. AGG can be bought on dips below $110.12.
![[iShares Core Total US Bond Market (AGG) Daily Bar Chart]](/UploadedImage/AIN_0515_20150407_AGG.jpg)
Our next ETF to consider trading during the “Worst Six Months” is iShares 20+ Year Treasury Bond (TLT). This funds name says it all. Its holdings are all long duration Treasury bonds. Its current yield is right around 2.5%, has assets in excess of $6 billion and an expense ratio of 0.15%. Average daily trading volume over the past three months is nearly 10 million shares per day. TLT’s more volatile nature can be seen in the chart below. From its high of $137.95 on the last day of January this year it quickly sank to a low of $122.97 (-10.9%) in early March before rebounding. TLT offers a modest yield advantage over AGG however; price movement is its real advantage (or disadvantage). Should the market unravel in a meaningful manner later this year, TLT could enjoy a rather robust rather. TLT’s two biggest downside risks are a solid economy and market that prompts the Fed to boost rates sooner rather than later. TLT can be considered on dips below $124.88.
![[iShares 20+ Year Treasury Bond (TLT) Daily Bar Chart]](/UploadedImage/AIN_0515_20150407_TLT.jpg)
AdvisorShares Ranger Equity Bear (HDGE) is the most aggressive “Worst Six Months” defense to consider. HDGE is an actively managed ETF that establishes short positions in individual stocks. As of the end of February it had the most exposure to the Consumer Discretionary and Information Technology sectors. These two sectors combined represented 59% of the ETFs total exposure. For HDGE to be a homerun, the market needs to suffer a substantial breakdown in the “Worst Six Months.” Even if the market moves sideways, HDGE’s rather lofty 2.92% net expense ratio is going to be a drag. More than half of this fee is the cost of active management while short interest expense adds another 1.22%. Assets total nearly $125 million and average daily volume is around 100,000 shares per day. Both assets and trading activity have a tendency to swell during periods of market weakness. HDGE can be considered on dips below $10.95.
ETF Portfolio Updates
With the end of the “Best Six Months” rapidly drawing near, the majority of the ETF Portfolio is on Hold. Today’s new ideas can be considered on dips. United States Natural Gas (UNG) could be bought at current levels as natural gas is seasonally strong through June. SPDR Utilities (XLU) could also be considered at current levels as its seasonally favorable period typically runs until early October.
Disclosure Note: At press time, officers of the Hirsch Organization, or accounts they control held positions in UNG, USO, XLU and XLV.
|
Seasonal MACD Switching Strategy Update: Let’s Not Jump the Gun
|
|
By:
Christopher Mistal
|
April 02, 2015
|
|
|
|
If you are reading this, then there is little doubt that you are reasonably familiar with our “Best Months” Switching strategies based upon DJIA’s and S&P 500’s “Best Six Months” November to April and NASDAQ’s “Best Eight Months” from November to June. You also know that now is the time we begin looking for an MACD Sell signal for DJIA and S&P 500 accompanied by corresponding early warning signs of market weakness. We are NOT issuing our Seasonal MACD Sell Signal today. Continue to hold long positions associated with DJIA’s and S&P 500’s “Best Six Months.”
In the past, we have issued a sell signal as early as the close of trading on the
first day of April (2002, 2005, 2006, 2012 and 2013). In those previous years, MACD was already negative even before the calendar indicated it was April. Out of these five early signals, only 2002 proved substantially timely as the “Worst Six Months” were down over 20% that year. In 2005, the market did decline in April, but came roaring back in May. In 2006 the market peaked in early May before declining. Holding until the end of April 2012 would have been a better exit and in 2013 the market also continued higher through April into May.
![[DJIA Daily Bar Chart]](/UploadedImage/AIN_0515_20150402_DJIA.jpg)
![[S&P 500 Daily Bar Chart]](/UploadedImage/AIN_0515_20150402_SP500.jpg)
As you can see in the charts above, this April also began with MACD negative. With the exception of three trading days in March, it has been negative since March 4 for S&P 500. DJIA has been negative since March 5 with just two brief days positive. The MACD signals that occurred on the fourth and fifth of March, just a few days after DJIA and S&P 500 closed at all-time highs, highlight the importance of MACD crossovers. Since then, DJIA and S&P 500 have been trading in an increasingly narrow range on either side of their respective 50-day moving averages while Stochastic, MACD and relative strength indicators have drifted lower toward oversold levels. Selling with indicators near oversold levels is not the best exit.
Furthermore, although the market has been weak recently it has been so during a typically seasonally weak time period. We repeatedly pointed out the markets tendency to decline after mid-March and into the end of the first quarter on end-of-quarter portfolio restructuring. Even the market’s poor performance on the usually strong first trading day of April is most likely the result of the confluence of Passover and Easter this week and all the vacations that often occur as a result of school breaks.
April’s prowess for gains, in all years, and especially pre-election years like 2015 is yet another reason to stick around a bit longer. DJIA has been up nine years in a row in April with an average gain of 3.1%. April is also DJIA’s best month of the year and S&P 500’s third best since 1950. Even in years when March was negative, the odds of a solid advance in April remain respectably high. Going back to 1950, both DJIA and S&P 500 have declined 22 times in March. Following that decline, DJIA and S&P 500 advanced 14 times in April with average gains exceeding 1%.
![[DJIA Down March since 1950]](/UploadedImage/AIN_0515_20150402_DJIA-Down_March.jpg)
![[S&P 500 Down March since 1950]](/UploadedImage/AIN_0515_20150402_SP500-Down_March.jpg)
Historically the anticipation of Q1 earnings has frequently driven the market higher in April. First quarter earnings estimates have been revised significantly lower, but this only improves the odds for more companies to beat the lower bar. Without a doubt, the strong U.S. dollar will prove to be a drag on revenues for some companies, but continued productivity improvements, cost cutting and stock buybacks are going to boost the bottom line.
Recent resilience by tech and small-cap indices is also encouraging. NASDAQ and Russell 2000 also broke out to new highs this year, but unlike DJIA and S&P 500, they remain above their old trading ranges from late last year. This tech and small-cap strength bodes well for DJIA and S&P 500 especially now that tech enjoys a greater weighting in both indices. As of yesterday’s close information technology made up nearly 20% of the S&P 500 while Apple’s addition to DJIA increases tech exposure there.
Taking all of this into consideration along with the fact that NASDAQ and Small-caps typically enjoy a “Best Eight Months” that lasts until the end of June, we will continue to hold long positions associated with DJIA’s and S&P 500’s “Best Six Months.” We will issue our Seasonal MACD Sell signal
when corresponding MACD Sell indicators crossover to sell again or sooner if NASDAQ and Russell 2000 show signs of breaking down. In the meantime, continue to heed all stop losses in the
Almanac Investor Stock and ETF
portfolios.
Disclosure Note: At press time, officers of the Hirsch Organization, or accounts they control held positions in UNG, USO, XLU and XLV.