|
Market at a Glance - 4/29/2021
|
|
By:
Christopher Mistal
|
April 29, 2021
|
|
|
|
4/29/2021: Dow 34060.36 | S&P 4211.47 | NASDAQ 14082.55 | Russell 2K 2295.46 | NYSE 16376.00 | Value Line Arith 9542.52
Fundamental: Supportive. Monetary policy and fiscal policy are aligned and highly supportive. Economic activity is expanding, and unemployment is improving. Corporate earnings have been solid, and forecasts remain generally positive. Some concerns include inflation and longer-term interest rates along with ongoing Covid-19 hotspots.
Technical: Topping? DJIA, S&P 500 and NASDAQ closed at new all-time highs in April, but Russell 2000 has not. Our Seasonal Sell Signal has triggered for DJIA and S&P 500. Weekly Advancers have dwindled while Weekly Decliners have been rising. New 52-week Highs appear to have peaked in March and New 52-week Lows have been expanding.
Monetary: 0 – 0.25%. The Fed appears to be focused on ensuring it does not repeat its mistakes of the recent past. By mistakes I mean having to leave rates at zero for nearly a decade and having to use multiple rounds of QE to support the economy following the financial crisis of 2008-2009. This time around the Fed appears determined to get the economy back on track as quickly as possible. The current “at any cost” approach is even willing to tolerate above target levels of inflation in the near-term. Thus far, this approach has worked.
Seasonal: Neutral. May is the first month of DJIA and S&P 500 “Worst Six Months.” However, NASDAQ and Russell 2000 strength historically lasts through June. In post-election years, May has been a solid month. DJIA and S&P 500 have both advanced in May for nine straight post-election years.
Psychological: Fading. According to
Investor’s Intelligence Advisors Sentiment survey Bullish advisors have slipped to 59.2% from 63.7%. Correction advisors have climbed to 24.3% while Bearish advisors are at 16.7%. Sentiment has been elevated for a lengthy period and for valid reason, the market was continuing to rise. Now that the market has paused, and the likelihood of another massive move higher fades so is bullish sentiment.
|
May Outlook: Muted Market Action Anticipated Over Worst Six Months
|
|
By:
Jeffrey A. Hirsch & Christopher Mistal
|
April 29, 2021
|
|
|
|
Seasonality remains back to normal and it appears from all our observations that it will continue to track historical patterns for the remainder of the year. April’s solid returns across the board led by S&P 500 (up 6.0%) and NASDAQ (up 6.3%) and new highs for DJIA, S&P 500 and NASDAQ capped off a banner Best Six Months. DJIA is up 28.5%, S&P 500 is up 28.8%, NASDAQ is up 29.1% and the Russell 2000 is up an amazing 49.2% since the close of October through today’s close.
We issued our
Best Six Months MACD Seasonal Sell Signal last week on the close of April 22. From our
November 5 Buy Signal DJIA gained 19.1% and S&P advanced 17.8%. The Sell Signal looks rather timely with the MACD crossover or negative histogram occurring well above the zero line. NASDAQ’s Best Eight Months ends June 1 so the running gains so far are 18.4% for NASDAQ and 38.3% for Russell 2000 as of today’s close. June 1 is the earliest NASDAQ’s Seasonal Sell can trigger.
Our portfolios are shifting to a more neutral stance until we get that NASDAQ Seasonal Sell Signal. SPDR DJIA (DIA) and SPDR S&P 500 (SPY) positions were closed out of the portfolio using their respective average prices on April 23. Invesco QQQ (QQQ) and iShares Russell 2000 (IWM) remain on HOLD until we get NASDAQ’s Seasonal Sell.
As you likely know, we don’t “Sell in May and go away.” We do sell some things, and we do buy some things for the Worst Six Months. Instead of selling in May, we prefer to “Reposition in May.” For the beginning of our Worst Six Months repositioning we’ve suggested establishing half positions in iShares Core US Aggregate Bond (AGG) with a Buy Limit of $115.00 and Vanguard Total Bond Market (BND) with a Buy Limit of $85.65.
We also sold SPDR Materials (XLB) and Vanguard REIT (VNQ) as these sectors’ bullish seasonalities end in May. Over the next several weeks in upcoming email Alerts we will be reevaluating all current stock and ETF holdings. Weak or underperforming positions may be closed out, stop losses may be raised, new buying may be limited and we will evaluate the timing of adding positions in sectors that perform well in the Worst Six Months and presenting you with a new basket of defensive stocks.
In case you missed it, we covered much of our Worst Six Months outlook and strategy in our April 28 webinar: “Sell in May But Don't Go Away! Tactical Seasonal Sector Rotation & Stock Trading Strategies.” You can watch the replay if you register at this link
https://register.gotowebinar.com/register/5753287365631356685.
Seasonal Patterns Endure
Year to date the S&P 500 is up 12.1%. This is way above the historical averages and a rather encouraging sign that supports our outlook for a muted Worst Six Months manifesting in mostly sideways market action with limited shallow pullbacks and no major corrections. We had a superb question come up on the webinar about market behavior following first four months up more than 10%. We posted our findings on the blog and found that the previous 17 times since 1950 that the
S&P 500 was up over 10% for the first four months preceded flat market performance from May to late-October.
The chart here of the S&P 500 Seasonal Pattern overlaid with the years January-April were up more than 10% also highlights how well the market continues to track seasonals in 2021. The magnitude of gains is well above historic norms, but weakness in late February and late March as well as solid April strength are emblematic of typical seasonal market behavior.
The market is ripe for a pause and pullback following the extended up move we’ve had. Technically the charts of the indexes look toppy. The chart here of the NASDAQ 100 (NDX) we have been tracking shows the NDX stalling around our 13,900 resistance line. As discussed in the Pulse of the Market below market internals also appear to be rolling over.
As the market’s prospects over the next several months look rather tame with little upside we will stick with the system and begin repositioning for the Worst Six Months and shift to a more neutral stance until we get our NASDAQ Sell Signal. But our outlook remains bullish for the year as a whole.
The Fed continues to reaffirm its unrelenting support for the economy and its commitment to remain super accommodative. The market seems to be reacting well to President Biden’s first 100 days, his agenda and the plans he laid out in his speech last night. Despite several concerning global hotspots the Covid-19 pandemic does not appear to be impacting the market much anymore.
Now that folks in many countries are returning to normal they will likely be returning to more normal seasonal behaviors and taking time away from the market in the summer months. This should help facilitate the usual summer market doldrums of lighter volume and the usual tepid sideways action with minor pullbacks during the Worst Six Months May-October. This is the perfect time for some spring portfolio cleaning, reevaluating positions and some repositioning.
Pulse of the Market
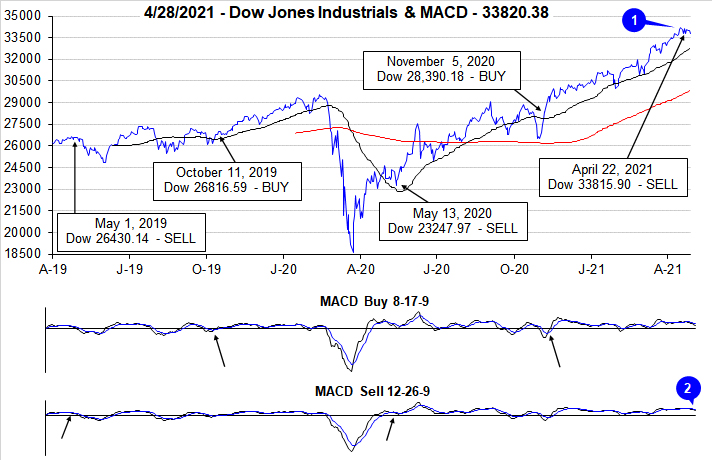
April has lived up to its historical reputation of being the best month of the year for DJIA since 1950 once again this year. Following a string of new all-time highs early in the month (1), DJIA closed above 34,000 for the first time ever on April 15. But momentum quickly faded and on the close of trading on April 22, the slower moving MACD “Sell” indicator applied to DJIA (2) and S&P 500 was negative triggering our Seasonal Sell for DJIA and S&P 500. From our Seasonal Buy on November 5, 2020, through April 22, DJIA gained 19.1%, well above historical average of 8.8%.
Prior to our Seasonal Sell, DJIA (3) and S&P 500 (4) logged gains in four consecutive weeks. NASDAQ (5) was only modestly weaker with gains for three straight weeks. All three indexes were down last week and could finish this week in the red. If this occurs it would be the first back-to-back weekly declines by all three indexes since last October. DJIA’s recent streak of gains on the last trading day of the week could also be at risk of ending.
Market breadth measured by NYSE Weekly Advancers and NYSE Weekly Decliners (6) was positive in four of the last five weeks. Weekly Decliners have been slowly creeping higher while market gains have slowed. Coupled with MACD turning negative this is additional confirmation that the market’s rally has faded.
Weekly New Highs (7) have wandered all over the place since peaking at 951 during the second week of March. Weekly New Lows have also increased. This suggests the market is running out of steam and much of the recent positive news has already been priced in. If New Highs continue to dwindle and New Lows expand then the market could be headed towards a pullback or a mild correction.
The Treasury yield curve had flattened out modestly over the past five weeks as 90-day Treasury yields held steady just above 0% and the 30-Year Treasury yield retreated from its mid-March peak of 2.41 (8). Talk of more Federal spending this week has rates moving higher this week. Rates could make a move higher, but any move higher is likely to be capped by significantly lower rates in other major developed markets like Europe and Japan.
Click for larger graphic…
|
Tactical Seasonal Switching Strategy Update
|
|
By:
Jeffrey A. Hirsch & Christopher Mistal
|
April 22, 2021
|
|
|
|
As of today’s close, both the slower moving MACD indicators applied to DJIA and S&P 500 are negative (arrows in the charts below point to a crossover or negative histogram on the slower moving MACD used by our Seasonal Switching Strategy to issue a sell signal). At this time, we are issuing our Best Six Months MACD Seasonal Sell signal for DJIA and S&P 500. NASDAQ’s “Best Eight Months” last until June.
Almanac Investor Tactical Seasonal Switching ETF Portfolio Trades
SELL SPDR DJIA (DIA) and SPDR S&P 500 (SPY) positions. For tracking purposes these positions will be closed out of the portfolio using their respective average prices on April 23.
Continue to HOLD Invesco QQQ (QQQ) and iShares Russell 2000 (IWM) as NASDAQ’s “Best Eight Months” ends in June.
Consider establishing a half position in iShares Core US Aggregate Bond (AGG) with a Buy Limit of $115.00.
Also consider establishing a half position in Vanguard Total Bond Market (BND) with a Buy Limit of $85.65.
Traders/investors following the Best 6 + 4-Year Cycle switching strategy detailed on page 62 of the Stock Trader’s Almanac 2021 should heed this signal.
Almanac Investor Sector Rotation ETF Portfolio Trades
Sell SPDR Materials (XLB) and Vanguard REIT (VNQ) as correlating seasonalities end in May. For tracking purposes these positions will be closed out of the portfolio using their respective average prices on April 23.
Today’s Seasonal MACD Sell Signal for DJIA and S&P 500 marks the early beginning of the “Worst Six Months.” We do not simply sell and go away instead today’s trades are the start of tactical adjustments that will be made in the portfolios. From now until NASDAQ’s Seasonal MACD Sell (earliest it can trigger is on June 1), the portfolios will be shifted toward a neutral stance. Positions that have historically performed well during the “Worst Months” will be held along with positions that correlate to NASDAQ and Russell 2000.
All current stock and ETF holdings will be reevaluated in upcoming email Alerts. Weak or underperforming positions may be closed out, stop losses may be raised, new buying may be limited and we will evaluate the timing of adding positions in sectors that perform well in the Worst Six Months and presenting you with a new basket of defensive stocks.
|
May Almanac & Vital Stats: Stronger in Post-Election Years
|
|
By:
Jeffrey A. Hirsch & Christopher Mistal
|
April 22, 2021
|
|
|
|
May officially marks the beginning of the “Worst Six Months” for the DJIA and S&P. To wit: “Sell in May and go away.” Our “Best Six Months Switching Strategy,” created in 1986, proves that there is merit to this old trader’s tale. A hypothetical $10,000 investment in the DJIA compounded to a gain of $960,943 for November-April in 70 years compared to just $1,656 for May-October. The same hypothetical $10,000 investment in the S&P 500 compounded to $788,997 for November-April in 70 years compared to a gain of just $10,145 for May-October.
May has been a tricky month over the years, a well-deserved reputation following the May 6, 2010 “flash crash”. It used to be part of what we once called the “May/June disaster area.” From 1965 to 1984 the S&P 500 was down during May fifteen out of twenty times. Then from 1985 through 1997 May was the best month, gaining ground every single year (13 straight gains) on the S&P, up 3.3% on average with the DJIA falling once and two NASDAQ losses.
In the years since 1997, May’s performance has been erratic; DJIA up twelve times in the past twenty-three years (four of the years had gains in excess of 4%). NASDAQ suffered five May losses in a row from 1998-2001, down – 11.9% in 2000, followed by thirteen sizable gains in excess of 2.5% and five losses, the worst of which was 8.3% in 2010.
Post-election Year Mays rank near the top, registering average gains on DJIA and S&P 500 of 1.3% and 1.7% respectively. DJIA and S&P 500 have advanced in every post-election year May beginning in 1985. Russell 1000 has been up ten years straight in post-election year Mays.
The first two days of May trade higher frequently and the S&P 500 has been up 21 of the last 31 first trading days of May. A bout of weakness often appears around or on the third, ninth, thirteenth and fourteenth trading days for large cap stocks. Generally, the first half of the month is better than the second half in post-election years since 1950 (pages 40 & 42 STA 2021).
Monday before May monthly option expiration is much stronger than monthly expiration day itself albeit weaker for small caps. S&P 500 has registered only eight losses in the last thirty-one years on Monday. Monthly expiration day is a loser nearly across the board except for Russell 2000 with a slight average gain. The full week had a bullish bias that is fading in recent years. The week after options expiration week now favors tech and small caps. DJIA has fallen in twelve of the last twenty-two weeks after.
| May (1950-2020) |
| |
DJI |
SP500 |
NASDAQ |
Russell
1K |
Russell 2K |
| Rank |
|
9 |
|
8 |
|
5 |
|
6 |
|
5 |
| #
Up |
|
38 |
|
42 |
|
31 |
|
29 |
|
27 |
| #
Down |
|
33 |
|
29 |
|
19 |
|
13 |
|
15 |
| Average
% |
|
-0.04 |
|
0.2 |
|
1.0 |
|
0.9 |
|
1.3 |
| 4-Year Presidential Election Cycle Performance
by % |
| Post-Election |
|
1.3 |
|
1.7 |
|
3.4 |
|
3.0 |
|
3.9 |
| Mid-Term |
|
-0.6 |
|
-0.7 |
|
-0.7 |
|
0.1 |
|
-1.1 |
| Pre-Election |
|
-0.3 |
|
-0.2 |
|
1.1 |
|
0.5 |
|
1.7 |
| Election |
|
-0.4 |
|
0.1 |
|
0.2 |
|
0.2 |
|
0.6 |
| Best & Worst May by % |
| Best |
1990 |
8.3 |
1990 |
9.2 |
1997 |
11.1 |
1990 |
8.9 |
1997 |
11.0 |
| Worst |
2010 |
-7.9 |
1962 |
-8.6 |
2000 |
-11.9 |
2010 |
-8.1 |
2019 |
-7.9 |
| May Weeks by % |
| Best |
5/29/70 |
5.8 |
5/2/97 |
6.2 |
5/17/02 |
8.8 |
5/2/97 |
6.4 |
5/22/20 |
7.8 |
| Worst |
5/25/62 |
-6.0 |
5/25/62 |
-6.8 |
5/7/2010 |
-8.0 |
5/7/10 |
-6.6 |
5/7/10 |
-8.9 |
| May Days by % |
| Best |
5/27/70 |
5.1 |
5/27/70 |
5.0 |
5/30/00 |
7.9 |
5/10/10 |
4.4 |
5/18/20 |
6.1 |
| Worst |
5/28/62 |
-5.7 |
5/28/62 |
-6.7 |
5/23/00 |
-5.9 |
5/20/10 |
-3.9 |
5/20/10 |
-5.1 |
| First Trading Day of Expiration Week: 1990-2020 |
| #Up-#Down |
|
22-9 |
|
23-8 |
|
20-11 |
|
22-9 |
|
16-15 |
| Streak |
|
D2 |
|
U1 |
|
U1 |
|
U1 |
|
D3 |
| Avg
% |
|
0.26 |
|
0.25 |
|
0.25 |
|
0.23 |
|
0.04 |
| Options Expiration Day: 1990-2020 |
| #Up-#Down |
|
16-15 |
|
16-15 |
|
15-16 |
|
16-15 |
|
15-16 |
| Streak |
|
U1 |
|
U1 |
|
U1 |
|
U1 |
|
U1 |
| Avg
% |
|
-0.08 |
|
-0.10 |
|
-0.12 |
|
-0.08 |
|
0.03 |
| Options Expiration Week: 1990-2020 |
| #Up-#Down |
|
15-16 |
|
15-16 |
|
16-15 |
|
14-17 |
|
17-14 |
| Streak |
|
D5 |
|
D4 |
|
D4 |
|
D4 |
|
D2 |
| Avg
% |
|
0.12 |
|
0.07 |
|
0.21 |
|
0.14 |
|
-0.32 |
| Week After Options Expiration: 1990-2020 |
| #Up-#Down |
|
18-13 |
|
20-11 |
|
21-10 |
|
20-11 |
|
24-7 |
| Streak |
|
U1 |
|
U1 |
|
U1 |
|
U1 |
|
U1 |
| Avg
% |
|
0.04 |
|
0.28 |
|
0.45 |
|
0.32 |
|
0.68 |
| May 2021 Bullish Days: Data 2000-2020 |
| |
4,
7, 10, 12 |
3,
17, 18, 25, 27 |
3,
10, 18, 25, 27 |
3,
17, 18, 25, 27 |
3, 4, 27 |
| |
17,
27 |
|
|
|
|
| May 2021 Bearish Days: Data 2000-2020 |
| |
5,
6, 11, 13 |
5,
13, 19, 20 |
5,
20 |
5,
13, 19, 20 |
5, 13, 14, 19, 28 |
| |
19,
20, 28 |
|
|
|
|
|
May 2021 Strategy Calendar
|
|
By:
Christopher Mistal
|
April 22, 2021
|
|
|
|
|
Mid-Month & Seasonal MACD Update: Seasonals and Mixed Signals Suggest Flat Worst Six Months
|
|
By:
Jeffrey A. Hirsch & Christopher Mistal
|
April 15, 2021
|
|
|
|
Thus far, April has lived up to its historic reputation of delivering market gains. DJIA is up 3.2% this April as of today’s close and S&P 500 is up 5.0%. From our Seasonal MACD Buy Signal last November, DJIA is up 19.9% and S&P 500 18.8%. NASDAQ, which has a “Best Eight Months” lasting until June is currently up 18.1% since our Seasonal Buy Signal. These are solid gains from our Tactical Seasonal Switching Strategy and further reinforces our declaration that seasonality is back.
Here again we present daily bar charts of DJIA and S&P 500 with the current status of MACD displayed. The current rally appears to be picking up steam as both MACD indicators remain positive and are trending higher (indicated by the blue arrow and today’s higher bar). As of today, DJIA would need to decline 352.87 points (1.04%) and S&P 500 would need to drop 174.80 points (4.19%) in a single day to turn both MACD indicators negative.
Continue to hold long positions associated with DJIA’s and S&P 500’s “Best Six Months.” We will issue our Seasonal MACD Sell signal when corresponding MACD Sell indicators applied to DJIA and S&P 500 both crossover and issue a new sell signal.
Post-Election-Year Worst Months
The long-term track record of our Seasonal Switching Strategy, which is based upon the “Best Six Months” in conjunction with our MACD Technical Buy and Sell Signal signals, has a solid long-term track record of outperformance with potentially less risk compared to a buy and hold approach. Since 1950, DJIA’s average annual gain has been 8.5%. Over the same time period, DJIA has lost an average 0.7% during the “Worst Six Months,” May through October, and gained an average 8.8% during the “Best Six Months,” November through April.
Detractors are quick to point out that there have been positive “bad” months and negative “good” months. This is absolutely true as there is no trading or investment strategy that works 100% of the time (even the best will report a trading loss every once and a while). In post-election years, the historically worst performing year of the four-year cycle (page 130, STA 2021), the “Worst Months” have not been all that bad with more positive periods than negative, but average gains over the six or four month period are still paltry. It is also worth noting that the one election year with a double-digit “Worst Months” S&P 500 gain, 1980, was followed by a tough “Worst Months” in 1981 (shaded in light grey in table).
Click image to view full size in a new window…
Mixed Signals
The trend of the market is predominantly higher as DJIA, S&P 500 and NASDAQ 100 (NDX) have made new all-time highs this month. However, there are mixed signals. NASDAQ Composite has not logged a new high since mid-February and Russell 2000 has not made a new high since mid-March and both have been moving mostly sideways since late-January.
The market’s dominant uptrend is evident in the chart here of the NDX. NDX logged another W-123 Swing Bottom in March and is trending higher from the higher low at point 3 in late March. There is some overhead resistance around 13900 at the February high, though NDX is testing that presently closing at 14026 today.
We remain constructively bullish on the market overall, but seasonals remain on track and the Worst Six Months (May-October) is nearly upon us. So as we anticipate our pending Best Six Months Seasonal MACD Sell Signal, we suspect the market will most likely pause and move sideways with some minor pullbacks over the Worst Six Months and not suffer any major correction.
As you can see in the seasonal chart here, April 2021, the last month of the Best Six and #1 DJIA and S&P 500 month and #2 NASDAQ month, is putting on a rather stellar performance. This is encouraging and bullish as gains tend to beget gains and suggests more typical sideways market action over the Worst Six Months.
Our
mean reversion study we posted on the blog last month suggest the gains we have experienced the last 12 months are not likely to be as massive over the next 12 months, though they are likely to be more in line with the historical average 1-year rolling returns of about 9%.
So we are not going to be running for the exits when our Best Six Months Seasonal MACD Sell Signal triggers, but with the market extended, valuations high and a few political/geopolitical bumps potentially ahead on the horizon, we will prudently reposition into a slightly more defensive posture as we usually do around this time of the year as we detailed in the
April Outlook when we get the MACD Sell Signal.
|
Stock Portfolio & Seasonal MACD Updates: Strong April Start Keeps Best Months Going
|
|
By:
Christopher Mistal
|
April 08, 2021
|
|
|
|
As of today’s close, MACD indicators applied to DJIA and S&P 500 are positive. S&P 500 is positive by the widest margin and expanding (see blue arrow in second chart below). DJIA’s MACD indicator reflects the way DJIA has traded over the last four sessions: flat. Based upon today’s closes it would take a one-day S&P 500 decline of 215.02 points (5.25%) to turn its MACD indicator negative. DJIA’s one-day decline is much smaller at just 0.64% (213.92).
Continue to hold long positions associated with DJIA’s and S&P 500’s “Best Six Months.” We will issue our Seasonal MACD Sell signal
when corresponding MACD Sell indicators applied to DJIA
and S&P 500 both crossover and issue a new sell signal. We are
not issuing the signal at this time. Refer to the
April Outlook for a primer and refresher on the system.
Portfolio Updates
Over the last four weeks since last update through yesterday’s close, S&P 500 climbed 4.6% higher while Russell 2000 slide 2.7% lower. During the same time period the entire portfolio climbed a respectable 1.5% higher excluding dividends and any fees. Overall portfolio performance was held in check by a still sizable cash position and weakness in some small-cap positions. The majority of the portfolio’s gains came from our Large-cap stocks which advanced 5.9% due to strength in energy and utilities. Mid-cap stocks inched 0.8% higher on average while our Small-cap portfolio lagged, declining 0.6%.
Due to broad market small-cap weakness and the stabilization of 10-year Treasury yields, just three of the nine Small-cap portfolio holdings advanced over the last four weeks. Avid Tech Inc (AVID), KB Home (KBH) and Lemaitre Vascular (LMAT) enjoyed a gain since last update. The housing market has been making record price headlines on tight supply and strong demand which continues to aid homebuilders like KBH. Financials paused as the yield curve steepening that took place earlier in the year appears to have taken a breather.
Mid-caps were relatively quiet over the period with some positions enjoying modest gains while others were slightly lower. Taylor Morrison (TMHC) and Werner Enterprises (WERN) racked up most of the Mid-cap portfolio gains through yesterday’s close. TMHC is also a homebuilder while WERN is in the transportation sector. Both have been hot but are exhibiting some weakness today. JetBlue Airways (JBLU) has surged back to the price it was at before the pandemic effectively shut down most air travel over a year ago. From here any additional gains are likely to be slower as the industry continues to slowly recover.
With the exception of Amdocs (DOX), every position advanced over the last four weeks since last update. Success in the Large-cap portfolio was primarily the result of energy and utility related positions rebounding nicely in March. Utilities had sold off rather briskly as rates rose. This weakness appears to have been the typical seasonal low and the sector is off to a strong start for the remainder of its seasonally favorable period.
DOX was on track for a gain but got knocked down by a short seller’s report released on March 31. Management responded in a brief statement the following day and shares of DOX have remained above its stop loss and the low of $70.05 from March 31 has not been breached. DOX has been slowly recovering the losses. We will officially continue to Hold DOX as the short-sellers report appears to not be having a major and/or lasting effect on the company.
Kansas City Southern (KSU) has agreed to merge with Canadian Pacific (CP) in a stock and cash deal that was announced on March 21. Full details can be found on KSU’s website. KSU shareholders would receive $90 per share in cash and 0.489 shares of CP for each KSU share held. Thus far the response has been positive, and the combined companies would effectively connect all of North America. Hold KSU.
Please see table below for specific stop losses and current advice for each position in the portfolio. All other positions not already mentioned are on Hold. As a reminder, dividend paying and/or generally defensive positions held in the portfolio are shaded in light grey.
|
ETF Portfolios & Seasonal MACD Updates: On Hold & Prepping to Switch
|
|
By:
Christopher Mistal
|
April 01, 2021
|
|
|
|
Seasonality is back and it appears to be increasingly asserting itself. We began seeing signs of seasonalities reemergence last September and they have only continued to increase in frequency. Today, the first day of April and the day before Good Friday, have historically been bullish and that certainly was the situation today. DJIA extended its bullish first trading day streak to 19 of the last 27 while NASDAQ’s day before Good Friday advance streak is now 20 of the last 21 years.
With seasonalities’ return, it would seem that this year’s “Worst Six Months” are increasingly likely to be seasonal. Last year’s big “Worst Months” gains are not likely to be repeated this year. Compared to one year ago, there is much to be bullish about now, but there is also plenty to be concerned with that could trip up or at least stall out the market. Valuations for one suggest that much of the good news has been factored into the market. The Fed is still highly accommodative, but as economic activity picks up it will begin to pull back on liquidity. Yet another potential major headwind is an increase in corporate tax rates.
Our Seasonal MACD Sell signal, not being issued today, could prove to be especially timely this year. In the following chart we have plotted DJIA and S&P 500 with MACD in the lower pane. As of today, both MACD indicators are positive (blue arrows). DJIA’s MACD is positive by the smallest margin, but we require DJIA and S&P 500 to both agree. Currently it would take a one-day decline of 114.13 S&P 500 points (–2.84%) and a DJIA decline of 8.70 points (–0.03%) to turn both MACD indicators negative.
Continue to hold long positions associated with DJIA’s and S&P 500’s “Best Six Months.” We will issue our Seasonal MACD Sell signal when corresponding MACD Sell indicators applied to DJIA and S&P 500 both crossover and issue a new sell signal.
Sector Rotation ETF Portfolio Update
Early March weakness was quickly reversed as Treasury yields calmed and another round of stimulus flowed from the federal government. There was a bout of seasonal weakness following quarterly options expiration. But overall, March was a solid month for the market with above average gains from the major indexes and many of the sectors represented in the table below.
At yesterday’s close, the overall Sector Rotation portfolio average return was 12.2% versus 11.5% for last update. During March, two positions traded at and above their respective Auto-Sell prices: iShares DJ Transports (IYT) and SPDR Industrials (XLI). IYT was sold on March 29 for a 25.5% gain. XLI was sold the next day for a gain of 21.9%. IYT and XLI are both fractionally higher now, but their momentum does appear to be fading as both are lagging the overall market today. Seasonal strength in both historically comes to an end in May and gains logged this time are well above average (STA page 92).
The next position that could soon be closed out with an above average gain is iShares DJ US Telecom (IYZ). On March 29, IYZ traded within $0.09 of its Auto-Sell price of $32.81. Although telecom’s seasonally favorable typically ends in December, IYZ was held longer this year as it continued to advance.
For all the inflation concern swirling about, precious metals have failed to advance. In fact quite the opposite has been happening as Treasury yields climbed higher gold and silver have slipped lower. SPDR Gold (GLD) is the oldest holding in the portfolio and it is still showing a gain and there is a Stop Loss in place to preserve some of that gain. iShares Silver (SLV) is the only losing position in the portfolio. SLV appears to be attempting a modest rebound after declining throughout March. Hold SLV with a Stop Loss at $22.25.
SPDR Utilities (XLU) has rebounded nearly on perfect seasonal cue with late-February/early-March low. Historically, XLU has been a good position to weather the “Worst Six Months,” May through October for DJIA and S&P 500. XLU can still be considered on dips below its buy limit.
All other positions are currently on Hold. Please see table for current stop losses.
Tactical Seasonal Switching Strategy Portfolio Update
As of yesterday’s close, the Tactical Seasonal Switching Strategy portfolio had an average gain of 18.3% since our Seasonal Buy Signal on November 5. iShares Russell 2000 (IWM), is still the top performing position in the basket, up 34.3%. Invescos QQQ (QQQ) remains the laggard, up 9.1%. SPDR DJIA (DIA) and SPDR S&P 500 (SPY) were mid-pack up 16.6% and 13.4% respectively. When the Seasonal MACD Sell triggers we will close out DIA and SPY.
With the calendar turning into April and in anticipation of our Seasonal MACD Sell Signal, suggested stop losses have been added to the table for QQQ and IWM. NASDAQ’s seasonal “Best Eight Months” lasts until the end of June and Russell 2000 runs concurrently. Should these positions falter early, the suggested stop losses could preserve some of the existing gains.
We have also added iShares Core U.S. Aggregate Bond (AGG) and Vanguard Total Bond Market (BND) to the table. AGG and BND take a tiered approach holding multiple duration bonds. They are still susceptible to declines but offer a fair balance between yield and rate sensitivity. AGG and BND can be considered on dips or when the Seasonal MACD Sell triggers.