|
Market at a Glance - 4/28/2022
|
|
By:
Christopher Mistal
|
April 28, 2022
|
|
|
|
4/28/2022: Dow 33916.39 | S&P 4287.50 | NASDAQ 12871.53 | Russell 2K 1917.94 | NYSE 16032.68 | Value Line Arith 9101.06
Seasonal: Neutral. Our Seasonal MACD Sell Signal for DJIA and S&P 500 has triggered. May is the first month of DJIA & S&P 500 “Worst Six Months,” but NASDAQ’s “Best Eight Months” lasts through June. Average May gains; DJIA –0.01%, S&P 500 500 0.2% (since 1950), NASDAQ 1.0% (since 1971). In past midterm years average performance has been negative. May is the second worst month for S&P 500 in midterm years since 1950. However, DJIA and S&P 500 have advanced in 8 of the last 9 Mays.
Fundamental: Murky. Russia and Ukraine are still at war. Inflation is still running at multi-decade highs. Supply chain disruptions persist as China battles Covid-19 resurgences with lockdowns. The advance estimate of Q1 GDP was –1.4% annual rate. Post-pandemic growth has slowed, and the Fed is raising interest rates. Positively, inside the negative Q1 GDP, personal consumption expenditures, nonresidential and residential investments increased. Employment data also remains firm with claims data hovering around multi-decade lows and the unemployment rate was 3.6%.
Technical: Bouncing? For the majority of April DJIA, S&P 500 and NASDAQ have been under pressure. All three have fallen back below their respective 50- and 200-day moving averages. February 24 intraday lows have held for DJIA and S&P 500. NASDAQ did sink below its February and mid-March low but is snapping back. Resistance looms above at the declining 50-day moving average and then the 200-day moving average for all three indexes.
Monetary: 0.25 – 0.50%. Recent Fed comments have shifted market expectations toward a 0.50% increase in the Fed Funds Rate at its upcoming meeting scheduled for next week. Full-year expectations have also become more aggressive and currently point to rates being around 3% within one year. Rates are going up and have been in anticipation of the Fed. In addition to rates, further clarity surrounding the Fed’s massive balance sheet is needed. Supply chain issues also remain that could hamper the Fed’s efforts to tame inflation.
Psychological: Neutral. According to
Investor’s Intelligence Advisors Sentiment survey Bullish advisors have inched up to 34.2%. Correction advisors stood at 32.9% while Bearish advisors numbered 32.9% as of their April 27 release. A modest decrease in bears appears consistent with the markets trading action and the timing of the survey. Overall sentiment is likely to remain essentially neutral as the February intraday lows have not been broken by DJIA and S&P 500 while the outright bullish case remains challenged.
|
May Outlook: Midterm Bottom on the Horizon
|
|
By:
Jeffrey A. Hirsch & Christopher Mistal
|
April 28, 2022
|
|
|
|
It is a pleasure for Jeff to be reporting on our monthly outlook from the
49th Annual CMT Symposium. And it is a privilege and honor for him to be presenting to this venerable body of market technicians on Friday, April 29, 2022. “
The Chartered Market Technician® (CMT) designation marks the highest education within the discipline and is the preeminent designation for practitioners of technical analysis worldwide.” Perhaps it’s coincidence or perhaps it’s kismet that his presentation to the CMT Association 2022 Symposium occurs on the last day of the Best Six Months of the year November-April.
The Worst Six Months of the year (May-October) for 2022 commences on the heels of the worst start for the market since 1950. As of the close on Tuesday April 26, S&P 500 was down 12.4% for the year. The second worst start to the year was 1970, down 11.5% at the same point on the fourth to last trading day of the month – more on 1970 in a moment. As of the close on April 27, April is down 4.0% for DJIA, 7.6% for S&P 500 and 12.2% for NASDAQ. April being the best month of the year this is not a great sign.
As we noted on the
blog, when the S&P 500 is down year-to-date and down in April, it preceded a yearly loss 69.2% of the time with an average loss of 7.3%. With just two trading days remaining, April will not likely live up to its historically bullish reputation this year. S&P 500’s decline in April as of April 27 is 7.6%, the second worst April since 1950 and sixth worst since 1930.
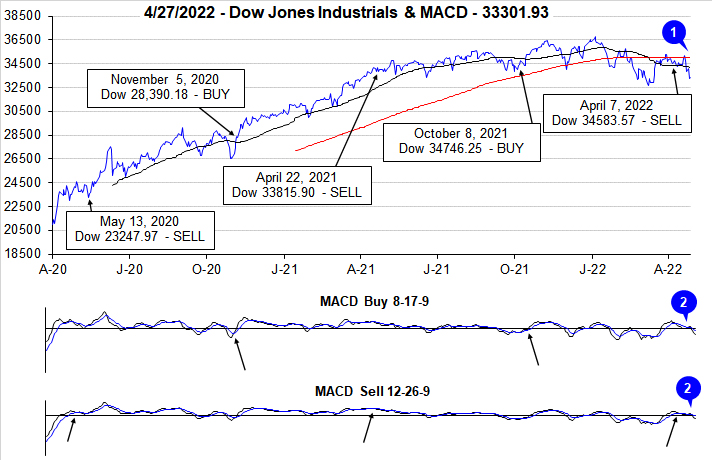
To top off the ominous seasonality readings, the current Best Six Months from the close of October are off 7.0% for DJIA and -9.2% for S&P 500. From our MACD Buy Signal on October 8 to our recent Sell Signal on April 7 the results improve to -0.5% for DJIA and positive 2.5% for S&P. NASDAQ’s Best 8 Months ends in June but so far, it’s down 19.4% from the end of October and -12.2% from the Buy Signal.
In the words of the late, great market analyst Edson Gould (Findings & Forecasts, 1902-1987): “If the market does not rally, as it should during bullish seasonal periods, it is a sign that other forces are stronger and that when the seasonal period ends those forces will really have their say.”
Welcome To the Weak Spot of the 4-Year Cycle
Not only are we on the cusp of the Worst Six Months, we also about to enter the Weak Spot of the 4-Year Presidential Election Cycle. We created the bar chart here to highlight this critical juncture of 4-Year Cycle we have been discussing all year. The second and third quarter of the midterm year has been the weakest period of the entire 4-year pattern averaging losses over the 2-quarter period of -1.2% DJIA, -1.5% S&P and -5.0% NASDAQ. But thankfully, this sets up the even more important Sweet Spot of the cycle where DJIA gains 19.3%, S&P 20.0% and NASDAQ 29.3% over the three quarters from midterm year Q4 to pre-election year Q2.
![[Weak/Sweet Spot Chart]](/UploadedImage/AIN_0522_20220428_Weak_Sweet_Spots.jpg)
Our updated S&P 500 Midterm Year Seasonal Pattern reinforces this quadrennial buying opportunity as the market tends to find a midterm bottom over the next six months. The graph shows the “average” year, but it is important to note that these midterm bottoms have occurred at different times in individual midterm years and many of them came toward the beginning of the Weak Spot. The May 26, 1970 bear market low is a prime example.
1960, 1970 & 2022
As you can see here in our graphic comparison of the years 1960 and 1970 to this year, 2022 is tracking eerily close to those two bear market years. Both 1960 and 1970 hosted recessions and rate increases in the prior year. Inflation in 1970 was closer to current conditions with the CPI (Consumer Price Index) peaking around 6.5% year-over-year. It would be nice if 2022 played out more like 1960 with milder losses. Unfortunately, present circumstances are more akin to 1970. 1960 was also an election year, while1970 was a midterm year like 2022.
This time is a little different due to covid-disrupted supply chains and the fallout from Russia’s invasion of Ukraine with soaring energy and commodity prices. We are not implying the 36% bear market losses of 1970 are in the cards, but we suspect that we have not found bottom just yet. Though it is becoming increasingly possible we get a bottom sooner rather than later as we did in May 1970 with the Fed expected to raise rates 50 basis points at the May meeting and Russia looking to chalk up a victory on WWII Victory Day celebrated on May 9 in Russia.
Technical Support Being Tested
The support we have been keen on for the last two months at the intraday lows on February 24, the day Russia invaded Ukraine have held on DJIA and S&P 500 but are being tested on NASDAQ and our favorite benchmark these days NASDAQ 100 Index (NDX), which is tracked by the Invesco QQQ Trust (QQQ). NDX has been leading the market in both directions for several years.
After failing to find support at the 200- and 50-day moving averages in March and April NDX closed below the February 24 and March 14 intraday and closing lows two days in a row on April 26 and 27, closing just above the big round 13000 number. A breach of this level would likely signal a test of the March 2021 lows around 12250. This would be equivalent to about 31000 DJIA and 3750 S&P 500. The NASDAQ Composite has already tested and slightly breached the March 2021 support levels around 12500, which brings the old October 2020 support levels around 10500 into play.
![[NDX Chart]](/UploadedImage/AIN_0522_20220428_NDX.jpg)
In short, the market currently faces a plethora of headwinds. Preliminary readings for 2022 Q1 GDP (Gross Domestic Product) were a major disappointment today registering a 1.4% loss versus expectations of a 1%increase of. It was a complicated report with big inflation numbers and a large trade deficit that likely subtracted about 3 percentage points from the GDP number. By the time the final Q1 GDP number comes in in June it is likely to be revised higher.
We might get an early midterm bottom like 1970 or a milder more drawn-out bottoming process like 1960 and the average midterm year. Either way, fasten your seatbelts volatility is probably here for the next several months as the market searches for bottom. Stay cautious, be patient and wait for the fatter pitch later in the Worst Six Months or for our next Best Six Months Buy Signal sometime on or after October 1. Today’s rally is encouraging, but let’s not get ahead of ourselves as we expect continued heightened volatility in the face of midterm year and seasonal pressures, supply chain issues, inflation, and rate hikes.
Pulse of the Market
On the market’s close of April 7, the slower moving MACD Sell Indicator applied to DJIA and S&P 500 turned negative and we issued our Seasonal MACD Sell Signal for DJIA and S&P 500. For a brief period following the Sell Signal the market did provide an opportunity to unwind long positions associated with DJIA and S&P 500. However, uncertainty and volatility have remained elevated. From the April 7 close through yesterday’s close, DJIA is down 3.71% while S&P 500 declined 7.03%. DJIA has fallen back below both its 50- and 200-day moving averages (1). Both the slower and faster moving MACD indicators applied to DJIA (2) have continued to trend lower (2).
In the first four months of the year DJIA has recorded six Down Friday/Down Monday (DF/DM) occurrences. The most recent was completed just after mid-April (3). Initially it was shaken off with gains on the following Tuesday and Wednesday (April 19 & 20), but those gains did not hold as DJIA dropped nearly 1350 points on Thursday and Friday. At the current pace of six DF/DMs in four months DJIA is appears on track to record 18 for the full year. The last time that happened was in 2002 (STA22 page 78).
DJIA was on track for another weekly loss this week. Should today’s gains fade, DJIA could record five straight weekly losses (4) and would be down in 13 of 17 weeks this year. S&P 500 (5) and NASDAQ (6) were also on track for another weekly loss prior to today. If the gains do not hold then their current streaks would extend to four straight and would bring S&P 500 and NASDAQ to 11 weekly losses in 17 weeks this year. The previous weekly losing streak was followed by a brisk multi-week snapback rally in the second half of March. Perhaps next week’s Fed meeting will be the catalyst for a similar bounce in May.
NYSE Weekly Advancers and Weekly Decliners (7) have been consistent with the market’s overall move. Decliners have outnumbered Advancers during losing weeks while the opposite occurred in advancing weeks. In two of the three last weeks, Weekly Decliners outnumbered Weekly Advancers by over two to one. If the opposite were to transpire it would improve the likelihood of a more sustainable market reversal and rally.
Weekly New Highs (8) have actually ticked slightly higher, but so have Weekly New Lows. The trend of New Lows is consistent with the market’s weakness. The modest increase in New Highs is likely due to defensive and/or bearish positions. The peak in New Lows has been steadily falling since the end of January. This is potentially an early sign that broad selling pressure is beginning to abate. Those that wanted out have likely gotten out. A peak below the early March high of 939 during the current week would be somewhat encouraging.
As the Fed’s hawkish tone has increased so have the 90-day and 30-year Treasury bond yields (9). 30-year Treasury yields hovering around 3% with recent inflation metrics running at multi-decade highs seems to suggest that the bond market does view the surge in inflation as transitory. Considering the time period of 30 years, it does seem highly plausible. Current rates are off of their respective lows, but remain low especially when compared to where they were the last time inflation was as high as it is today.
|
May Almanac: A Challenging Month in Midterm Election Years
|
|
By:
Jeffrey A. Hirsch & Christopher Mistal
|
April 21, 2022
|
|
|
|
May officially marks the beginning of the “Worst Six Months” for the DJIA and S&P. To wit: “Sell in May and go away.” Our “Best Six Months Switching Strategy,” created in 1986, proves that there is merit to this old trader’s tale. A hypothetical $10,000 investment in the DJIA compounded to a gain of $1,230,865 for November-April in 71 years compared to just $2,693 for May-October (STA 2022, page 54). The same hypothetical $10,000 investment in the S&P 500 compounded to $1,011,918 for November-April in 71 years compared to a gain of just $12,623 for May-October.
May has been a tricky month over the years, a well-deserved reputation following the May 6, 2010 “flash crash”. It used to be part of what we once called the “May/June disaster area.” From 1965 to 1984 the S&P 500 was down during May fifteen out of twenty times. Then from 1985 through 1997 May was the best month, gaining ground every single year (13 straight gains) on the S&P, up 3.3% on average with the DJIA falling once and two NASDAQ losses.
In the years since 1997, May’s performance has been erratic; DJIA up thirteen times in the past twenty-four years (four of the years had gains in excess of 4%). NASDAQ suffered five May losses in a row from 1998-2001, down –11.9% in 2000, followed by thirteen sizable gains in excess of 2.5% and six losses, the worst of which was 8.3% in 2010 followed by another sizable loss of 7.9% in 2019.
Since 1950, midterm-year Mays rank poorly, #10 DJIA, #11 S&P 500, #8 NASDAQ, #6 Russell 1000 and #9 Russell 2000. Performance ranges from a best of +0.1% by Russell 1000 to a worst of –1.1% for Russell 2000. Not one of these indexes has been positive more than 50% of the time in midterm years.
The first two days of May have historically traded higher, and the S&P 500 has been up 17 of the last 24 first trading days of May. Bouts of weakness often appears around or on the third, sixth, and twelfth trading days of the month while the last four or five trading days have generally enjoyed respectable gains on average. In midterm years it has generally been better to lighten up on long positions early in May as the entire month tends to be weak (pages 42 and 44 STA 2022).
Monday before May monthly option expiration is much stronger than monthly expiration day itself albeit weaker for small caps. S&P 500 has registered only nine losses in the last thirty-two years on Monday. Monthly expiration day is a loser nearly across the board except for Russell 2000 with a slight average gain (+0.04%). The full week had a bullish bias that is fading in recent years with DJIA down six weeks in a row and S&P 500 down five in a row. The week after options expiration week now favors tech and small caps. NASDAQ has advanced in 22 of the last 32 weeks while Russell 2000 has risen in 25 of the last 32 with an average weekly gain of 0.73%.
|
May 2022 Strategy Calendar
|
|
By:
Christopher Mistal
|
April 21, 2022
|
|
|
|
|
ETF & Stock Portfolio Updates: Seasonal Shift to Neutral Underway
|
|
By:
Christopher Mistal
|
April 14, 2022
|
|
|
|
One week ago our Seasonal MACD
Sell Signal for DJIA and S&P 500 triggered. Over the past five trading sessions DJIA is essentially flat, down around 130 points from than last Thursday’s close. S&P 500 has been weaker, off around 108 points or about 2.3% lower. NASDAQ’s Best Eight Months last until June, but its recent weakness is concerning, down around 2% today alone. Looking at our familiar chart of various S&P 500 1-Year Seasonal Patterns currently in play below, it appears as if the market may be starting its typical midterm-year May/June retreat early.
Based upon the above chart the average spring retreat has been around 4 to 7%. From current levels that magnitude could put S&P 500 back near its March closing lows. Due to this historical tendency and the
level of uncertainty that currently exists, a more cautious position is warranted at this time.
Tactical Seasonal Switching Strategy ETF Portfolio Update
Per last week’s Seasonal MACD Sell Signal, positions in SPDR DJIA (DIA) and SPDR S&P 500 (SPY) have been closed out of the portfolio using their respective average daily prices on April 8. Excluding any dividends and trading fees, SPY was closed out for a 2.5% gain while DIA was closed at a 0.1% loss. This is well below historical average performance for the Best Months and only further underscores the uncertainty that exists in the future direction of the economy.
Proceeds from the sale of DIA and SPY were used to establish partial positions in three bond ETFs, TLT, AGG and BND. All three dipped below their respective buy limits on Friday April 8. Treasury yields have already made sizable moves in advance of the Fed actually raising rates, but there is still price risk of varying degrees involved in owning TLT, AGG and BND. If the risk is deemed unsuitable, cash or a money market fund are options to consider. Depending upon your trading platform, your brokerage account provider could have cash sweep options that could soon be paying some reasonable rate once the Fed steps up interest rate increases.
Invescos QQQ (QQQ) and iShares Russell 2000 (IWM) are on Hold as NASDAQ’s Best Months last until June. From now until that time the Tactical Seasonal Switching Portfolio is going to effectively be market neutral with a mix of partial positions in bonds and cash along with long tech and small-cap positions.
Stock Portfolio Updates
Over the last five weeks since last update through yesterday’s close, S&P 500 advanced 3.9% while Russell 2000 crept 0.4% higher. Over the same time period the entire stock portfolio advanced 1.3%, excluding dividends and any fees. Overall performance was held in check by a sizable cash position. This cash has also been a buffer against this year’s market weakness. Large-cap positions were the best, up 6.3% compared to last update. Mid-cap stocks also fared well, advancing 3.4%. Small caps were the laggard in the portfolio, down 4.0%.
Weakness in the Small-cap portfolio was largely due to continued pressure on banks stocks. Atlantic Union Bankshares Corp (AUB) declined 7.2% over the last five weeks through yesterday’s close. WSFS Financial Corp (WSFS) suffered an even greater decline that resulted in it being closed out of the portfolio on April 8 when it closed below its stop loss. WSFS had previously doubled and was sold for a total position gain of 79.1%. A small-cap bright spot was Mgp Ingredients (MGPI) which surged 17.2% higher.
Werner Enterprises (WERN) managed to hang on until the last day of Q1 when it closed below its stop loss. Surging fuel costs and supply chain disruptions have hit the transportation sector. Fuel costs may be finding some stability, but they are still substantially higher than they were last year at this time. The other two remaining mid-cap positions, BKH and PCRX, actually had a fairly decent last five weeks as both climbed nicely higher. BKH and PCRX are on Hold.
Our Large-cap portfolio is filled with generally defensive positions in utilities, and it has paid off recently. The only position in the red is AT&T (T). Earlier this week T completely its spin off and for each share of T held, 0.24 shares of Warner Bros. Discovery (WBD) were received. The new position in WBD has been added to the portfolio and T’s “Presented Price” has been adjusted for the spinoff. Both T and WBD are on Hold. Interest in both “new” companies appears to be picking up. T is still paying a respectable dividend while both companies logged gains today.
All other positions are on Hold. Please see the table below for updated stop losses and current advice for positions not covered above.
|
Tactical Seasonal Switching Strategy Update: Choppy April Start
|
|
By:
Jeffrey A. Hirsch & Christopher Mistal
|
April 07, 2022
|
|
|
|
As of today’s close, both the slower moving MACD indicators applied to DJIA and S&P 500 are negative (arrows in the charts below point to a crossover or negative histogram on the slower moving MACD used by our Seasonal Switching Strategy to issue a sell signal). At this time, we are issuing our Best Six Months MACD Seasonal Sell signal for DJIA and S&P 500. NASDAQ’s “Best Eight Months” last until June.
Almanac Investor Tactical Seasonal Switching ETF Portfolio Trades
SELL SPDR DJIA (DIA) and SPDR S&P 500 (SPY) positions. For tracking purposes these positions will be closed out of the portfolio using their respective average prices on April 8.
Continue to HOLD Invesco QQQ (QQQ) and iShares Russell 2000 (IWM) as NASDAQ’s “Best Eight Months” ends in June.
For this “Worst Months” period we are going to offer a few options where to put cash from the positions that are being closed out ranging from relatively low-risk/low-reward to high-risk/potentially higher reward. Consider your individual risk tolerance and investment objectives.
Consider establishing a partial position in Vanguard Total Bond Market (BND) with a Buy Limit of $77.62.
Consider establishing a partial position in iShares Core US Aggregate Bond (AGG) with a Buy Limit of $104.75.
BND & AGG can be considered moderate-risk/moderate-reward.
Due to the increasingly hawkish comments by members of the Fed, a partial position in iShares 20+ Year Treasury Bond (TLT) can be considered on dips below a Buy Limit of $124.91. TLT is likely the riskiest bond ETF to consider for the “Worst Months,” but there is the possibility that the Fed is overly aggressive with monetary policy and slows inflation and economic growth too much resulting in a full-blown recession. If that were to transpire, TLT could see a sizable reversal and upside appreciation. This TLT trade idea is best for aggressive traders with a higher risk tolerance as it appears to have the greatest risk.
At the opposite end of the risk spectrum is a position in cash and/or a money market fund. If the Fed is aggressively raising rates, then the interest paid on cash should also begin increasing. An allocation to cash or a money market fund will likely be the least nerve-racking position should market volatility spike during the “Worst Months.” It also has the potential advantage of making the summer months all that much more enjoyable.
Traders/investors following the Best 6 + 4-Year Cycle switching strategy detailed on page 64 of the Stock Trader’s Almanac 2022 should heed this signal.
Almanac Investor Sector Rotation ETF Portfolio Trades
Sell Vanguard REIT (VNQ) as correlating seasonalities end in May. For tracking purposes VNQ will be closed out of the portfolio using its average price on April 8.
iShares DJ Transports (IYT) was stopped out yesterday, April 6, when it closed below its stop loss. IYT has been closed out of the Sector Rotation ETF Portfolio. SPDR Materials (XLB) was also stopped out. XLB was closed out of the portfolio on March 8. IYT and XLB both recorded modest losses excluding any dividends paid and trading costs.
All remaining holdings in the Sector Rotation Portfolio are on Hold.
Today’s Seasonal MACD Sell Signal for DJIA and S&P 500 marks the early beginning of the “Worst Six Months.” We do not simply sell and go away. Instead, today’s trades are the start of tactical adjustments that will be made in the portfolios. From now until when NASDAQ’s Seasonal MACD Sell Signal triggers (earliest it can trigger is on June 1), the portfolios will be shifted toward a neutral stance. Positions that have historically performed well during the “Worst Months” will be held along with positions that correlate to NASDAQ and Russell 2000.
All current stock and ETF holdings will be reevaluated in upcoming email Alerts. Weak or underperforming positions may be closed out, stop losses may be raised, new buying may be limited, and we will evaluate the timing of adding positions in sectors that perform well in the Worst Six Months and presenting you with a new basket of defensive stocks.
The shear volume of seemingly never-ending negative news would make it easy to be outright bearish at this time. Russia has invaded Ukraine, energy prices surged, inflation is persistently high, monetary policy is tightening, parts of the yield curve inverted and on and on. However, we must not loose sight of all the government spending that is still ongoing, strength in the employment market and the fact that the market did hold its intraday lows from February 24 the day Russia first invaded Ukraine in March. This upcoming “Worst Months” is likely to produce little to no gains with plenty of volatility, but eventually the next great buying opportunity will come along, most likely in late Q3 or early Q4 later this year.