|
Market at a Glance - 5/30/2019
|
|
By:
Christopher Mistal
|
May 30, 2019
|
|
|
|
5/30/2019: Dow 25169.88 | S&P 2788.86 | NASDAQ 7567.72 | Russell 2K 1485.53 | NYSE 12393.66 | Value Line Arith 5888.85
Psychological: Slipping. According to
Investor’s Intelligence Advisors Sentiment survey bulls are at 49.0%. Correction advisors are at 33.7% and Bearish advisors are 17.3%. Bullish advisors exceeded 50% for thirteen weeks straight peaking at 56.4 at the end of April and have been below 50% for the past two readings. This decline in bullish sentiment is likely being driven by recent market declines and the start of the “Worst Six Months.” Declining bullish sentiment is a positive, but it has not yet reached levels typically associated with new buying opportunities.
Fundamental: Reasonably firm. Even though first quarter U.S. GDP was revised down to 3.1% earlier today, it is still above 3% and past estimates. This suggests that there is a reasonable chance that current Q2 estimates are also low. Q1 corporate earnings were also better than widely anticipated. Yes earnings compared to year ago figures were not spectacular, but they are still growing and expected to accelerate later this year and next. Unemployment is also consistently low and stable while wages and productivity are improving. The “sugar high” from tax cuts has ended, but the overall outlook is still looking fair.
Technical: Consolidating? DJIA, S&P 500 and NASDAQ all had great runs from the December lows. S&P 500 and NASDAQ even traded at new all-time highs, DJIA did not. The current pullback could be blamed on a myriad of things, valuations, earnings, trade, geopolitics, “Sell(ing) in May,” etc. Or perhaps it is just a typical May pullback like many of our charts and patterns suggested prior. Nonetheless, early March lows have not been violated by all three indices and selling appears to be abating.
Monetary: 2.25-2.50%. Partial yield curve inversion, slowing growth estimates and below target inflation metrics. That single sentence alone is probably adequate support for a rate cut or two by the Fed. Likely that is exactly what the Fed will do next. The only hurdle is the lingering belief that rates should be higher because they used to be higher in the past.
Seasonal: Neutral. June is the second month of DJIA and S&P 500 “Worst Six Months,” it also is the last month of NASDAQ “Best Eight Months.” Historically a tepid month, June has recorded respectable gains in pre-election years and following down Mays in years with strong starts.
|
June Outlook: May’s Selloffs Yield June Boons
|
|
By:
Jeffrey A. Hirsch & Christopher Mistal
|
May 30, 2019
|
|
|
|
On the heels of one of the strongest starts to year for the first four months May was destined for weakness. But this bodes well for June. May is notoriously weaker in pre-election years, like 2019, and after big starts to the year. The first four months of 2019 were up 17.5% for the S&P 500, the third best since 1950. Following the previous top 20 starts May was down 9 times for an average gain of 0.2%. June is more bullish in general during pre-election years and even more so after weak Mays. After big starts, 7 of the 9 subsequent
May declines were followed by big gains in June.
Bonds yields have been falling and an inverted yield curve is not a great sign, but our research finds that it really isn’t until the
Effective Fed Funds Rate is higher than the entire yield curve, including the long end, that you get an indication that a recession is imminent. Even still the two complete inversions back in December 1985 and December 1986 were years before Gulf War 1 fueled the July 1990 to March 1991 recession. Point being these short-middle end yield curve inversions are not especially indicative of an impending recession anytime soon. The Fed projected slowing growth and they can fix the inverted yield curve in a single action.
Plus this is right in line with bond seasonality. Falling yields are typical this time of year during the worst six months. Our Sector Rotation and Tactical Seasonal Switching Strategies have been adding some bond positions since mid-April and more on our Best Six Months MACD Seasonal Sell signal for DJIA and S&P 500 on May 1st.
We did sell a few things on our Sell Signal, but we did not and have not gone away. We “repositioned” in May and our timing was fortuitous. Over the next two months, June and July, we will be evaluating and preparing another basket of Defensive Stocks for the summer market doldrums. Last year’s Defensive Stock Basket did quite well and helped us weather the correction last fall. This is all part of our methodology that utilizes a combination of historical-proven seasonal patterns in conjunction with fundamental and technical analysis as well as market sentiment and macro geopolitical trends.
As illustrated in the accompanying chart overall the market is tracking the seasonal patterns quite closely, especially for a pre-election year – albeit with a bit more magnitude than average.
Technically the market is under pressure and looking for support here at S&P 2775, which sits right at the 200 DMA, but also runs through several gaps, consolidations and resistance levels over the past year and a half. It tested 2775 yesterday and bounced off it again today. 2725 is the next level of support near the March lows – a 7.5% correction. The next level of support is 2650, at the top of the December V-drop and end of January breakout – a 10% Correction. Then 2580 at the February/April 2018 lows – 12.4% correction.
President Trump and the Fed are highly sensitive to market action. Last fall was a case in point. The Fed did a 180 and ceased the rate tightening cycle and Trump delayed the tariffs. If the stuff hits the fan and the market nears bear territory both will likely act quickly. Mr. Trump is a business and market cycle watcher and knows he needs a bull market for reelection. He has hung his hat on it. Expect a deal with China after the summer or sooner if the market drops further so that Trump can point to new highs as we head into the election year.
The recent decline in market sentiment is not a bad sign. Market sentiment is generally a contrary indicator. Markets climb walls of worry because folks on the sideline slowly feel left out and creep back in. Market Sentiment was elevated recently but not extreme. Besides it’s the worst six months and markets struggle at this time of year. Add in the China trade battle and domestic political squabbles and folks are prone to shift their attention away from Wall Street head for the beach.
We are not expecting a bear market to emerge in the near-term, but a correction or pullback like the market experienced in Q4 of last year is now in the cards. After the market’s stellar four-month run, at a bare minimum a period of backing and filling in the near-term is likely. While we do not anticipate much upside over the next 5 months or so, June is set up for a boon.
Pulse of the Market
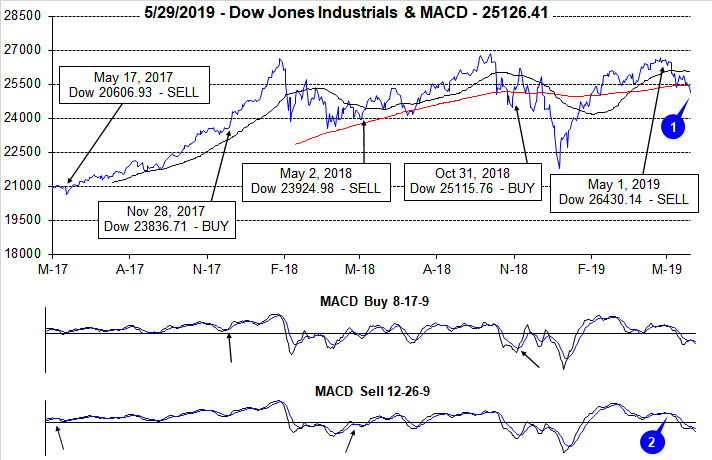
On the close of trading on May 1, we issued our Seasonal MACD Sell Alert for DJIA and S&P 500. Immediately following the Alert, the market was kind and offered a few trading sessions to unwind associated positions and add some defensive positions before succumbing to the weight of geopolitics and trade concerns. Through yesterday’s close (May 29), DJIA has shed over 1300 points and slipped below its 50- and 200-day moving averages (1). S&P 500 and NASDAQ have also weakened and retreated from their respective highs traded nearly one month ago.
Improvement in DJIA’s faster and slower MACD indicators just prior to our Seasonal Sell has been completed erased and both indicators are currently negative, below the zero line and trending lower still (2). Our research covering strong starts and down Mays suggests the market could bounce and produce respectable gains in June despite June’s long-standing reputation for being a tepid month at best. Should a rebound ensue in June, a corresponding improvement in MACD indicators is anticipated.
Early year strength that produced week after week of gains for DJIA, S&P 500 and NASDAQ has vanished. DJIA has declined five weeks straight (3) and nine of the last thirteen. During DJIA’s recent losing streak, it recorded its third Down Friday/Down Monday (DF/DM) warning of 2019 (4). Historically, past occurrences were frequently followed by further declines sometime during the next 90 days. The current occurrence was followed immediately by losses. The recent DF/DM also ended DJIA’s streak of winning Fridays. Traders and investors hesitant to hold positions over the weekend is a signal that confidence and sentiment have shifted and not in a good way.
After resisting DJIA’s weakness for two weeks, S&P 500 (5) and NASDAQ (6) gave up and joined DJIA with their own losing streaks. S&P 500 and NASDAQ have been down three straight and all three indexes are on course to extend their losing streaks another week.
Market breadth measured by NYSE Weekly Advancers and NYSE Weekly Decliners (7) remained positive through the first week ending in May. Since then Weekly NYSE Decliners have easily outnumbered Weekly NYSE Advancers. Thus far, clear indications that the decline is at or near its end have been absent as Weekly Decliners have not spiked like they did back in December.
Weekly New Highs appear to have peaked during the first week of trading ending in May (8) as they have been slipping lower since. There has also been a corresponding increase in Weekly New Lows. This is exactly what is expected during a market decline. Here again, absent a spike in Weekly New Lows, the trend of declines appears it could persist in the near-term.
Weeks of market declines have driven up demand for safe havens and this demand is reflected in the 30-year Treasury bond yield (9) falling back below 3%. Last week, it stood at 2.8% which is still above Fed funds, so the yield curve is not fully inverted. Should the curve fully invert, then the risk of recession would rise significantly.
Click for larger graphic…
|
June Almanac: Better in Pre-Election Years
|
|
By:
Jeffrey A. Hirsch & Christopher Mistal
|
May 23, 2019
|
|
|
|
June has shone brighter on NASDAQ stocks over the last 48 years as a rule ranking eighth with a 0.6% average gain, up 26 of 48 years. This contributes to NASDAQ’s “Best Eight Months” which ends in June. June ranks near the bottom on the Dow Jones Industrials just above September since 1950 with an average loss of 0.3%. S&P 500 performs similarly poorly, ranking tenth, but essentially flat (–0.02% average). Small caps also tend to fare well in June. Russell 2000 has averaged 0.6% in the month since 1979.
In pre-election years since 1950, June ranks no better than mid-pack. June is the #8 DJIA month in pre-election years averaging a 0.8% gain with a record of nine advances in seventeen years. For S&P 500, June is #5 with an average gain of 1.2% (10-7 record). Pre-election year June ranks #6 for NASDAQ and #7 for Russell 2000 with average gains of 1.9% and 1.1% respectively. Recent pre-election year Junes in 2015, 2011 and 2007 were troublesome for the market as DJIA, S&P 500 and NASDAQ all declined (Russell 2000 eked out a modest gain in 2015).
![[Pre-Election Year June Performance Table]](/UploadedImage/AIN_0619_20190523_Pre-Elec_June_mini_table.jpg)
The second Triple Witching Week of the year brings on some volatile trading with losses frequently exceeding gains. On Monday of Triple-Witching Week the Dow has been down thirteen of the last twenty-two years. Triple-Witching Friday is better, up ten of the last sixteen years, but weaker over the past 26 years, up fourteen, down twelve with an average loss of 0.23%. Full-week performance is choppy as well, littered with greater than 1% moves in both directions. The week after Triple-Witching Day is horrendous. This week has experienced Dow losses in 25 of the last 29 years with average losses of 1.09%. NASDAQ and Russell 2000 have fared better during the week after, but this trend appears to be fading.
June’s first trading day is the Dow’s best day of the month, up 24 of the last 31 years. Gains are sparse throughout the remainder of the month until the last three days when NASDAQ and Russell 2000 stocks begin to exhibit strength. The last day of the second quarter is a bit of a paradox as the Dow has been down 17 of the last 28 while NASDAQ and Russell 2000 have nearly the opposite record.
| June (1950-2018) |
| |
DJI |
SP500 |
NASDAQ |
Russell
1K |
Russell 2K |
| Rank |
|
11 |
|
10 |
|
8 |
|
11 |
|
8 |
| #
Up |
|
32 |
|
37 |
|
26 |
|
24 |
|
25 |
| #
Down |
|
37 |
|
32 |
|
22 |
|
16 |
|
15 |
| Average
% |
|
-0.3 |
|
-0.02 |
|
0.6 |
|
0.2 |
|
0.6 |
| 4-Year Presidential Election Cycle Performance
by % |
| Post-Election |
|
-1.1 |
|
-0.6 |
|
0.4 |
|
0.1 |
|
1.2 |
| Mid-Term |
|
-1.7 |
|
-1.8 |
|
-1.4 |
|
-1.2 |
|
-1.4 |
| Pre-Election |
|
0.8 |
|
1.2 |
|
1.9 |
|
1.1 |
|
1.4 |
| Election |
|
0.9 |
|
1.3 |
|
1.6 |
|
0.8 |
|
1.4 |
| Best & Worst June by % |
| Best |
1955 |
6.2 |
1955 |
8.2 |
2000 |
16.6 |
1999 |
5.1 |
2000 |
8.6 |
| Worst |
2008 |
-10.2 |
2008 |
-8.6 |
2002 |
-9.4 |
2008 |
-8.5 |
2010 |
-7.9 |
| June Weeks by % |
| Best |
6/7/74 |
6.4 |
6/2/00 |
7.2 |
6/2/00 |
19.0 |
6/2/00 |
8.0 |
6/2/00 |
12.2 |
| Worst |
6/30/50 |
-6.8 |
6/30/50 |
-7.6 |
6/15/01 |
-8.4 |
6/15/01 |
-4.2 |
6/9/06 |
-4.9 |
| June Days by % |
| Best |
6/28/62 |
3.8 |
6/28/62 |
3.4 |
6/2/00 |
6.4 |
6/10/10 |
3.0 |
6/2/00 |
4.2 |
| Worst |
6/26/50 |
-4.7 |
6/26/50 |
-5.4 |
6/24/2016 |
-4.1 |
6/24/2016 |
-3.6 |
6/4/10 |
-5.0 |
| First Trading Day of Expiration Week: 1990-2018 |
| #Up-#Down |
|
15-14 |
|
16-13 |
|
12-17 |
|
14-15 |
|
12-17 |
| Streak |
|
U1 |
|
U1 |
|
U1 |
|
U1 |
|
U1 |
| Avg
% |
|
-0.1 |
|
-0.1 |
|
-0.3 |
|
-0.1 |
|
-0.4 |
| Options Expiration Day: 1990-2018 |
| #Up-#Down |
|
17-12 |
|
18-11 |
|
14-15 |
|
17-12 |
|
16-13 |
| Streak |
|
D1 |
|
D1 |
|
D4 |
|
D1 |
|
D4 |
| Avg
% |
|
-0.2 |
|
-0.1 |
|
-0.05 |
|
-0.1 |
|
0.02 |
| Options Expiration Week: 1990-2018 |
| #Up-#Down |
|
17-12 |
|
17-12 |
|
13-16 |
|
15-14 |
|
14-15 |
| Streak |
|
D1 |
|
U2 |
|
U1 |
|
U2 |
|
U1 |
| Avg
% |
|
-0.06 |
|
0.001 |
|
-0.3 |
|
-0.06 |
|
-0.2 |
| Week After Options Expiration: 1990-2018 |
| #Up-#Down |
|
4-25 |
|
8-21 |
|
13-16 |
|
9-20 |
|
13-16 |
| Streak |
|
D1 |
|
D1 |
|
D1 |
|
D1 |
|
U2 |
| Avg
% |
|
-1.1 |
|
-0.7 |
|
-0.2 |
|
-0.7 |
|
-0.5 |
| June 2019 Bullish Days: Data 1998-2018 |
| |
3,
7, 10, 14 |
3,
4, 14, 17, 19 |
4,
17, 19, 26-28 |
3,
4, 17, 19 |
3, 4, 7, 17 |
| |
18,
26 |
|
|
|
26, 27 |
| June 2019 Bearish Days: Data 1998-2018 |
| |
11,
12, 24 |
12,
24, 25 |
12,
24 |
12,
24, 25 |
10, 12, 24 |
| |
|
|
|
|
|
|
June 2019 Strategy Calendar
|
|
By:
Christopher Mistal
|
May 23, 2019
|
|
|
|
|
Seasonal Sector Trades: Gold & Silver Heading Lower
|
|
By:
Christopher Mistal
|
May 16, 2019
|
|
|
|
Silver has a strong tendency to peak or continue lower in May, bottoming in mid to late June. Traders can look to sell silver in mid-May and maintain a short position until on or about June 23. In the past 46 years this trade has seen silver (July contract) decline 30 times for a success rate of 65.2%. Prior to 2014, this trade had been successful for eight years in a row. Since 2014 this trade has failed to materialize three times. However, it has been successful in 10 of the last 13 years.
In the second chart below, the 47-year historical average seasonal price tendency of silver as well as the decline typically seen from mid-May until the low is posted in late June or early July is shown. This May silver short trade captures the tail end of silver’s weak seasonal period (shaded yellow) that typically begins in late February or early March.
![[May Short Silver Futures Contract – Trade History]](/UploadedImage/AIN_0619_20190516_SI_History.jpg)
![[Silver Continuous Contract Daily Bar Chart & 1-Yr Seasonal Pattern]](/UploadedImage/AIN_0619_20190516_SI_Seasonal.jpg)
Aside from establishing a short potion in the futures market or through a leveraged, inverse ETF or ETN, an outright short position in iShares Silver Trust (SLV) is preferred. Compared to a leveraged, inverse ETF or ETN, daily volatility could be lower reducing the possibility of being prematurely stopped out of a position. Furthermore, daily tracking and compounding effects should also be less. SLV currently holds nearly 10,000 tonnes of physical silver in the trust. This corresponds to nearly $4.7 billion in assets. SLV daily trading volume over the last 20 days is in excess of 6.5 million shares on average offering plenty of daily liquidity.
![[iShares Silver Trust (SLV) Daily Bar Chart]](/UploadedImage/AIN_0619_20190516_SLV.jpg)
In the above chart, SLV has been trending lower since February. Prior to February SLV enjoyed a brisk rally from November lows just above $13 to briefly over $15 in February. The current decline appears to be on track for a retest of November’s lows and possibly lower. The current decline has been choppy. There have have periods of declines followed by modest rallies that quickly fade. Look to establish a short position in SLV during any bounce above $13.90. If shorted, an initial stop loss at 14.10 is suggested. This trade will be tracked in the Almanac Investor Sector Rotation ETF Portfolio.
Gold’s Fading Shine
Gold also tends to post seasonal bottoms in late June or early July, as demand increases when jewelers again stock up ahead of a the seasonal wedding event in India. Gold prices are also subject to spikes in demand from the investment community, as a hedge or protection from concerns over inflation or during times of economic instability or uncertainty. It is valued in terms of the U.S. dollar, so periods of dollar weakness can support gold’s value. Uncertainty over trade and tariffs does exist and has existed for some time now. During this time inflation has remained subdued while gold has been trending lower. The trend of lower gold is likely to continue.
Shorting an August gold futures contract on or about May 19 and holding until the end of June has been fruitful in 29 of the last 44 years for a success rate of 65.9%. This trade’s best year was 2013 when stocks put up their best yearly performance in more than a decade. This trade has worked in 10 of the last 13 years.
The success of this trade and/or silver’s trade will likely depend on the Fed, what it does or does not do with interest rates and whether or not the Trump Administration can reach a final trade agreement with China. Traditional jewelry and industrial demand is likely to follow historical patterns but investment demand is the wildcard. Gold is an appealing store of wealth when the U.S. dollar is weakening and gold is clearly competitive with cash, especially in countries with negative interest rates. Those negative rates are no different than having to pay a storage fee for physical gold or an expense ratio for holding an ETF consisting of gold.
Instead of using a leveraged, inverse gold ETFs or ETNs a basic short position in SPDR Gold (GLD) will be the path taken to execute a trade. GLD could be shorted now up to a limit of $122.00. Stochastic, MACD, and relative strength indicators are all rolling over as the recent gold bounce is fading. An initial stop loss of $123.95 is suggested. For tracking purposes, a GLD short position will be established in the Almanac Investor Sector Rotation ETF Portfolio using GLD’s average trading price on May 17, 2019. Additional purchases in DB Gold Double Short (DZZ) can also be considered at this time.
|
Best Performing Sectors of the “Worst Six Months”
|
|
By:
Christopher Mistal
|
May 09, 2019
|
|
|
|
Today we are not going to bother debating whether one should actually sell in May or not. Instead, let’s focus on some tactical adjustments that can be made in portfolios to take advantage of what actually does work during the “Worst Six Months” while either shorting or outright avoiding what does not work all that frequently.
In the following table, the performance of the S&P 500 during the “Worst Six Months” May to October is compared to fourteen select sector indices or sub-indices, gold and the 30-year Treasury bond. Nine of the fourteen indices chosen are S&P Sector indices. Gold and 30-year bond are continuously-linked, non-adjusted front-month futures contracts. With the exception of two indices, 1990-2018, a full 29 years of data was selected. This selection represents a reasonably balanced number of bull and bear years for each and a long enough timeframe to be statistically significant while representing current trends. In an effort to make an apple-to-apple comparison, dividends are not included in this study.
![[Various Sector Indices & 30-Year Treasury Bond versus S&P 500 during Worst Six Months May-October Since 1990 table]](/UploadedImage/AIN_0619_20190509_Worst_Months_Sector_Table.jpg)
Using the S&P 500 as the baseline by which all others were compared, five indices and the 30-year Treasury bond outperformed during the “Worst Six Months” while nine others and gold underperformed based upon “AVG %” return. At the top of the list are Biotech and Healthcare with average gains of 8.69% and 4.85% during the “Worst Months.” However, before jumping into Biotech positions, only 24 years of data was available and in those years, Biotech was up just 54.2% of the time from May through October. Some years, like 2014, gains were massive while in down years losses were frequently nearly as large.
Runner-up, Healthcare with 29 years of data and a 65.5% success rate is probably a safer choice than Biotech. Its 4.85% AVG % performance comes by way of one less loss in five additional years of data and just two double-digit losses, both in bear markets during 2002 and 2008.
Other “Worst Six” top performers consisted mostly of the usual suspects when defensive sectors are considered. Consumer Staples, 30-year Treasury bonds and Utilities all bested the S&P 500. Information Technology also performed surprisingly well, but appears to be highly correlated with S&P 500 (losing years in bear markets and similar monthly performance figures). Although not the best sector by AVG %, Consumer Staples advancing 79.3% of the time is the closest thing to a sure bet for a gain during the “Worst Months.”
At the other end of the performance spectrum we have the sectors to short or avoid altogether. The Materials sector was the worst over the past 29 years, shedding an average 2.04% during the “Worst Six.” PHLX Gold/Silver, NYSE ARCA Natural Gas and S&P 500 Industrials also recorded average losses. However, based solely upon the percentage of time up, the stocks only, PHLX Gold/Silver index is the most consistent loser of the “Worst Six” advancing just 37.9% of the time.
![[PHLX Gold/Silver mini-table]](/UploadedImage/AIN_0619_20190509_gold-silver_mini_table.jpg)
Also interesting to note is the fact that every sector, gold and 30-year bonds are all positive in May, on average. It’s not until June when things begin to fall apart for many sectors of the market and the market as a whole. July tends to see a broad bounce, but it tends to be short-lived as August and September tend to be downright ugly on average. It is this window of poor performance that has given October a lift in the past 29 years. Only Biotech, 30-year bonds and gold (futures and gold & silver stocks) manage to post gains in both August and September.
Based upon “% Up” during the “Worst Six Months,” Consumer Staples and Utilities look like the best place to be while Gold/Silver mining stocks (XAU) and Materials could be shorted or avoided all together. May also looks like a great time to rebalance a portfolio as you will likely be closing out long positions into strength and short trade ideas are worth considering given June’s nearly across-the-board poor performance.
Sector Rotation ETF Trade: Consumer Staples
Based upon the above updated “Worst Six Months” Sector Performance, the Almanac Investor ETF Portfolios are headed in the correct direction with existing long positions in Healthcare, Utilities and bonds What is lacking is a position in Consumer Staples, the sector with the highest win ratio of them all during the “Worst Six Months.”
We have been trying to add SPDR Consumer Staples (XLP) to the Sector Rotation ETF Portfolio for some time now on a dip. Thus far this approach has not succeeded. Buy XLP with a buy limit of $56.90. For tracking purposes, XLP will be added to the portfolio using its average price on May 10.
|
DJIA and S&P 500 “Best Months” Over – Shifting to Market Neutral
|
|
By:
Christopher Mistal
|
May 02, 2019
|
|
|
|
Yesterday after the market closed, we sent out our Tactical Seasonal Switching Strategy Sell Alert for DJIA and S&P 500. NASDAQ’s “Best Eight Months” lasts until June and we continue to hold technology and small-cap related positions in the ETF portfolio. From now until when we issue our Seasonal Sell Alert for NASDAQ (sometime on or after June 1) we are shifting the ETF Portfolio to a market neutral position by adding some exposure to short and longer duration bonds.
This “Best Six Months” period for DJIA and S&P 500 got off to a rocky start with the market diving into correction territory in December. Our Seasonal MACD “Buy” Signal assisted in avoiding some of the decline, but not all of it. From our October 31 “Buy” signal through yesterday’s “Sell” signal DJIA advanced 5.2% and S&P 500 7.8%. This is a below historical average showing. While somewhat disappointing, this does not mean seasonality is dead nor does it mean the strategy no longer works. It simply means there were stronger forces at work that delayed the start of typical seasonal strength. In this case, it was an overly hawkish Fed in a rush to return rates to “normal” when market forces were signaling tepid inflation and possibly tepid growth did not warrant further tightening.
Ultimately, the Fed did do a quick policy shift in December and the market found a bottom and quickly reversed course as well. From their Christmas eve day closing lows through their respective highs in April DJIA gained 22.3%, S&P 500 25.3% and NASDAQ an impressive 31.8%. A large portion of these gains occurred in the first four months of this year. Historically,
strong starts similar to this year have not left much for the rest of the year. In addition, the “Worst Months” still have a
lukewarm record in pre-election years.
We are not expecting a bear market to emerge in the near-term, nor are we looking for a correction or pullback like the market experienced in Q4 of last year. The market has had a solid four-month run and is more likely to experience a period of backing and filling in the near-term. Taking some profits (exiting positions related to DJIA and S&P 500 “Best Six Months”), holding onto technology and small-cap positions (“Best Eight Months” lasts until June), adding some defensive positions and adjusting stop losses is the course of action to be followed now.
Tactical Seasonal Switching Strategy ETF Portfolio Updates
In accordance with yesterday’s
Seasonal MACD Sell Alert, all
SPDR DJIA (DIA) and
SPDR S&P 500 positions in the portfolio were closed out today using their average prices. The final numbers will appear in the next update.
Invesco QQQ (QQQ) and
iShares Russell 2000 (IWM) are on Hold.
Half positions in bond ETFs, iShares Core US Aggregate Bond (AGG) and Vanguard Total Bond Market (BND) were also established. BND was already in the portfolio as it traded below its buy limit on April 12. AGG and BND both appear in the table below with their current buy limits.
Sector Rotation ETF Portfolio Updates
Per yesterday’s Sell Alert, positions in SPDR Financial (XLF), SPDR Industrials (XLI), SPDR Materials (XLB) and iShares DJ Transports (IYT) can be sold. All four sectors favorable periods come to an end in May. These positions will be closed out using today’s average price and will appear in the next ETF Portfolio update with their final performance figures. Today’s decline in crude did lift shares of IYT today making for an easy exit. Should broad market weakness continue, transports will likely follow.
Please see table for current advise, buy limits and stop losses for positions not mentioned.
Stock Portfolio Updates
Ever since trading our
Free Lunch basket earlier this year, the Stock Portfolio has been accumulating an increasing amount of cash as Free Lunch stock positions were closed out. Since last update this cash position has buffered overall performance. The overall portfolio climbed 0.7% since last update. Large caps were the best performer, adding 1.8% while small caps returned the least, up just 0.2%.
During the recent healthcare sector retreat, long-time holding UnitedHealth (UNH) was stopped out when it closed below $230.04. UNH gained 140.2% in total after selling half on a double. Any dividends or trading costs are not included.
All positions in the Stock Portfolio are on Hold. Please see table below for updated suggested stop losses.
|
Tactical Seasonal Switching Strategy Update
|
|
By:
Jeffrey A. Hirsch & Christopher Mistal
|
May 01, 2019
|
|
|
|
As of today’s close, both the slower moving MACD indicators applied to DJIA and S&P 500 are negative (arrows in charts below point to a crossover or negative histogram on the slower moving MACD used by our Seasonal Switching Strategy to issue a sell). At this time, we are issuing our official Best Six Months MACD Seasonal Sell signal for DJIA and S&P 500. NASDAQ’s “Best Eight Months” last until June.
Almanac Investor Tactical Seasonal Switching ETF Portfolio Trades
SELL SPDR DJIA (DIA) and SPDR S&P 500 (SPY) positions. For tracking purposes these positions will be closed out of the portfolio using their respective average prices on May 2.
Continue to HOLD Invesco QQQ (QQQ) and iShares Russell 2000 (IWM) as NASDAQ’s “Best Eight Months” ends in June.
Consider establishing a half position in iShares Core US Aggregate Bond (AGG) with a Buy Limit of $108.50.
A position in Vanguard Total Bond Market (BND) was added to the portfolio on April 12 when it traded below its buy limit. If not already purchased, consider establishing a half position in BND with a Buy Limit of $81.00.
Traders/investors following the Best 6 + 4-Year Cycle switching strategy detailed on page 62 of the Stock Trader’s Almanac 2019 do not need to heed this signal but may still want to consider reviewing positions and holdings. Consider trimming any underperforming or lagging positions and implementing or adjusting stop losses.
Almanac Investor Sector Rotation ETF Portfolio Trades
SELL SPDR Financial (XLF), SPDR Industrials (XLI), SPDR Materials (XLB) and iShares DJ Transports (IYT). For tracking purposes these positions will be closed out of the portfolio using their respective average prices on May 2.
All portfolios will be updated and emailed in tomorrow’s regularly scheduled Alert after the close.