|
Market at a Glance 6/25/2015
|
|
By:
Christopher Mistal
|
June 25, 2015
|
|
|
|
6/24/2015: Dow 17966.07 | S&P 2108.58 | NASDAQ 5122.41 | Russell 2K 1283.92 | NYSE 11066.14 | Value Line Arith 4872.77
Psychological: Distracted. Summer has officially begun, although many have been enjoying a lighter schedule since Memorial Day, the unofficial start of summer. Family vacations, three (or four) day weekends seem to have become the norm. As a result, the market is just meandering along. Sentiment indicators lean bullish, but not dangerously so.
Investor’s Intelligence latest survey reported bull advisors at 51.6% and bearish advisors at 15.4%. This is well within the range going back until last December. If bullish advisors shot up to or above 60%, then there would be real cause for concern.
Fundamental: Mixed. Corporations and the stock market are doing ok, but Q1 GDP was a disappointment, declining 0.2%. This is being dismissed as an aberration due to weather. Relative stability in the housing and labor markets does tend to support Q1 as being a fluke, at least for now as full-year growth estimates are still predominately in the 2-3% range. Should Q2 GDP disappoint, what can that be blamed on? Let’s blame summer. It was too nice out to work.
Technical: Range bound. Although NASDAQ and Russell 2000 have been able to extend the top end of their respective trading ranges with modest new all-time highs, a meaningful and lasting breakout has yet to materialize. Stochastic, MACD and relative strength indicators applied to NASDAQ and Russell 2000 were stretched when they peaked on Tuesday, but are now heading back into neutral territory just like those applied to DJIA and S&P 500. A meaningful pullback, perhaps back to 200-day moving averages would likely clear the road to new-highs, but until that happens more sideways drift is expected.
Monetary: 0-0.25%. “When will the Fed raise rates?” is still an unanswered question. From recent FOMC statements and individual comments it is apparent the Fed would like to raise rates. The problem is growth is rather pathetic, especially when compared to historical data, and inflation, measured by CPI, is zero on a year-over-year basis. In fact, CPI has been less than or equal to zero for five straight months. Other than the Feds desire to return to something close to normal monetary policy, the argument for withdrawing stimulus is rather weak right now. Sure all forecasts suggest great things are coming, but that has been the case since roughly 2010. Are today’s forecasts any more likely to be accurate than those of the past 5 years?
Seasonal: Bearish. July is best month of the third quarter for the Dow and S&P, but performance for the other two months, August and September, makes comparisons easy. Two recent “hot” Julys in 2009 and 2010 have boosted July’s average gains since 1950 to 1.2% and 1.0% respectively. Such strength inevitability stirs talk of a “summer rally”, but beware the hype, as it has historically been the weakest rally of all seasons (page 72, Stock Trader’s Almanac 2015). Pre-election-year Julys are not so hot, ranking #6 DJIA, #8 S&P 500 and #10 for NASDAQ and Russell 2000.
|
July Outlook: Best Month of the Worst Quarter
|
|
By:
Jeffrey A. Hirsch & Christopher Mistal
|
June 25, 2015
|
|
|
|
Last month we put out the caution flag for June. Market valuations were running high and the major averages were struggling to breakout above resistance. The Fed was continuing to confuse the market with when they will raise rates and Greece and the EU were continuing to aggravate the market with their exasperating battle on the Greek sovereign debt bailout plan.
Considering all this technical and fundamental market pressure and the fact the June is the last month of NASDAQ’s Best 8 Months, we felt caution was in order. Not much has really changed in four weeks; much of the situation is the same. NASDAQ and the Russell 2000 have poked above their May highs, but the DJIA and the S&P 500 have lagged and are negative for the month and DJIA is flirting with going negative for the year again.
We issued our
NASDAQ MACD Seasonal Sell Signal on June 4 to subscribers and although the NAS moved slightly higher after, we logged a 12.5% gain in
PowerShares QQQ (QQQ) on paper in the ETF Portfolio since last September/October when we took the position at an average price of about 97.39. Of course your mileage may vary, but at least one subscriber is putting these signals to good work.
Rick from Arizona, called in to renew and when asked how he like the service he said, “I gladly subscribe to the Stock Trader’s Almanac because it has made me a very successful trader. In October of 2014 the email newsletter gave me a signal to buy the QQQ index at about 98. Then I patiently waited for the signal to sell which came in early June of 2015. The sell price of about 108 gave me an 11 per cent return or $170,000 profit in just eight months!”
This leads right into the July, the best month of the third quarter, but most of July’s strength is front-loaded in the first half of the month. Caution is still in order, though a tradeable rally may be in the making from the end of June into the first half of July. After that we will be looking for softer market action from late-July into September and early October. Economic readings continue to be less than sanguine with GDP negative for Q1. Next week we will be looking for some individual stocks to short from weak sectors with poor numbers and ugly charts.
Pulse of the Market
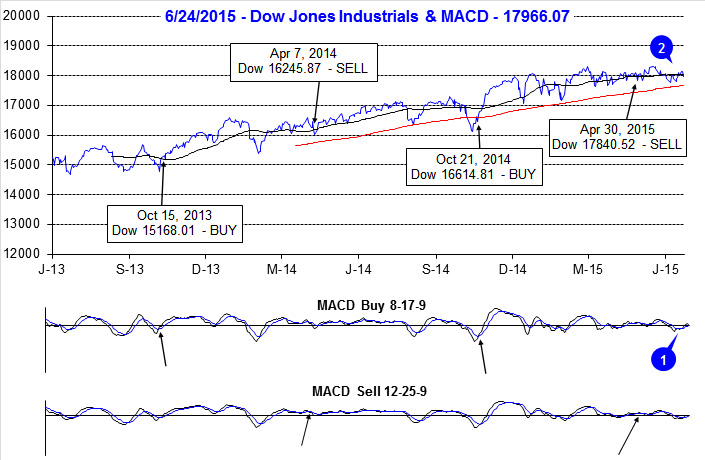
Over the past four weeks, DJIA has literally gone nowhere (2). DJIA did slip below its 50-day moving average early in June, but by just a few hundred points. DJIA has bounced back, but again it failed to exceed its 50-day moving average by not much more than 100 points. Both the faster and slower moving MACD indicators applied to DJIA (1) turned positive mid-week, last week, but waning momentum have them drifting toward sell once again. It would appear the summer doldrums are here with the market merely meandering along in an ever narrowing range.
On the heels of this year’s third Down Friday/Down Monday (DF/DM) warning, DJIA suffered two more DF/DM’s, back-to-back, to kick off the start of June (3). The last such occurrence of three DF/DM’s in four weeks was in January 2014. Back then DJIA spent the next twelve weeks getting back to where it was just prior to the cluster of DF/DM’s. Should DJIA follow a similar path this time, it would only be trading around 18,300 in mid-September. Considering the past few weeks, this is not that far-fetched of a possibility.
S&P 500 and NASDAQ have fallen into a similar pattern as DJIA. Despite being up in five of the last seven weeks, S&P 500 (4) is essentially unchanged since the start of May. NASDAQ’s recent weekly record (5) is weaker, but it’s up week gains have exceeded down week losses resulting in a few percentage points of gains since the start of May. However, as of trading today, NASDAQ is on course for its fourth minor weekly loss in the last five weeks.
Signs of a divergent and confused overall market continue to be present in the number of NYSE Weekly Advancers and Decliners (6). Flat to negative weeks are accompanied by more decliners than advancers, but in positive weeks, like last week, advancers just barely outnumber decliners. This is possible a sign that fewer and fewer stocks are actually participating in rallies by the major indices. Further compounding the confusion, New 52-Week Lows have outnumbered New Highs for three straight weeks even as New Highs climbed higher. A healthy market advance would have major indices moving higher, together, more Weekly Advancers than Decliners and a more robust number of New Highs.
|
Checking the Pulse of the Housing Market
|
|
By:
Christopher Mistal
|
June 23, 2015
|
|
|
|
Today’s new-home sales data release wrapped up this month’s primary housing data. The report showed new-home sales accelerated 2.2% over revised April figures and were a whopping 19.5% higher this May than last May. On a seasonally adjusted annualized rate (SAAR), sales were 546,000 which handily bested the consensus for 525,000. The region with the biggest jump in sales on a percentage basis was the Northeast, leaping a staggering 87.5%. But before getting too excited, Northeast sales were just 30,000 (SAAR) up from 16,000 the previous month.
Today’s report capped a seemingly solid month for the housing market. Existing home sales were reported up 9.2% year-over-year yesterday. Housing starts were 5.1% above May 2014 levels and the NAHB Housing Market Index jumped 5 points to 59. All of this positive data seems to suggest that the housing market must be back on track. Let’s take a closer look at each over the past 30 years and see.
Existing Home Sales
Existing home sales are the single most important piece of data that affects individuals. It is a measure of the ease in which one can buy and sell a house and reflects relative value that your house has. The massive crescendo in 2006 is indicative of just how out of whack the market got. Not only were people buying houses that they shouldn’t, but individuals were obviously flipping houses for a quick buck. When seven million houses were changing hands each year in 2005, double the number in 1995 it was obvious something wasn’t right.
As you can see from the chart existing home sales were a relatively stable number until 1996, but quickly doubled by the peak in late 2005. There were swings, but relatively minor before 1996. After all, a family home is a long term investment, right? Existing home sales were nearly cut in half from the peak to the final, post-tax-credit low in summer of 2010. From that low, existing home sales have steadily risen (with the exception of the second half of 2013 when interest rates briefly began rising) to 5.35 million units on a seasonally adjusted annualized rate as of May 2015. At the current rate existing home sales are comfortably above the long-term average of 4.43 million.
However, there is one major concern, interest rates. Based upon 2013 data, the last time mortgage rates made a swift meaningful move higher, existing home sales are highly likely to take a substantial hit when (if?) rates move higher as forecast. When rates rose approximately 1% in 2013, existing home sales slumped nearly 15% in a matter of just months. If you are considering an existing home sale, now may be a good time to put your house on the market. As far as buying goes, it is still a coin toss. You could get a great mortgage rate now, but your house could be cheaper after rates rise and sales slow.
Housing Starts
Housing starts are indicative of how builders feel about the housing market and are important for two reasons. First, home building provides a lot of jobs. When new home building sours whole construction crews are out of work.
Second, housing starts are a leading indicator of the amount of risk that the market is willing to take. In a good market, home builders ramp up construction in anticipation of future sales. When the market turns they quickly reign in their plans. As you can see from the chart, from the housing bottom in 1991 to the top in 2006, housing starts jumped from under 800k to over 2.27 million on an annualized basis, a number never before reached in the fifty years that the Census Bureau has been compiling data.
From the top, the number of housing starts crumbled all the way below 500k in early 2009. Weak demand and tight credit triggered the collapse. Credit conditions have eased and demand has improved which has restored some builder confidence. Housing starts have since doubled from their lows, but confidence appears to be waning as month-to-month numbers have become quite volatile over the past two years. Double-digit month-over-month and year-over-year percent changes do make good headlines, but it does appear as though some builders are beginning to worry about interest rates. With housing starts currently running well below average (black-dashed line), it appears builders still have a long way to go before they are ready to fully commit.
New Home Sales
It takes longer to build a house than sell a house, resulting in a buildup of inventory. Homebuilders attempt to strike a balance and plan their new construction accordingly. As you can see from the chart, new home sales fell off of a cliff down over 80% from their 2005 high to their 2011 low. Here again we see steady improvement since the lows, but still well below the longer-term average. A falling home ownership rate and lower household creation rate are keeping the market for a new home relatively depressed. Fewer new home buyers mean fewer housing starts and fewer new home sales. This cycle is not likely to be broken until household creation improves which is something very few expect to change anytime soon.
NAHB Housing Market Index
The NAHB Housing Market Index (HMI) is, in our opinion, the best indicator for judging the overall health of the housing market. The HMI was ahead of the curve in forecasting the imminent demise of the market. From 2005 to 2006, the HMI leveled off and turned down well before the other data began to crumble. The HMI will also convey any optimism within the industry before the data confirms a recovery. Numbers above 50 are a positive bias, below is negative. The index is currently at 59 as of this month. This matches its high from last year and is the highest level going back to 2005.
Digging a bit deeper into this composite index does reveal even more. The South and West regions of the U.S. continue to be the brightest locations while the Northeast is the sole drag. Perhaps it is the climate or perhaps it’s the high-tax nature of the location that is keeping the housing marker subdued here. One area of concern though exists; potential buyer traffic is still under 50 at 44. Worse yet, this is the highest reading of the year. Without buyers how much lower will it be before the rest of the index begins to decline? After all, it is the buyer that makes the market.
Conclusion
Although recent housing market data has shown some positive signs, it will likely be decades, if ever, before we see numbers like those from 2005. The housing market crash and ensuing near global financial system meltdown has resulted in significant, and most likely, long-lasting change. For starters lending standards have (re-) tightened making it more challenging for first-time buyers which there are fewer because children are living with mom and/or dad longer. Then even after they move out, renting instead of buying as they are waiting longer to get married and settle down. Foreign and investment buyers have stepped up their purchases, but only in select markets and locations. So much like the broader U.S. economy, the housing market has made substantial progress since the crisis, but remains broadly sub-par once all the hot-spots are averaged into the rest of the data.
|
ETF Portfolio Update: Best Months Over, Shifting Towards Defense
|
|
By:
Christopher Mistal
|
June 18, 2015
|
|
|
|
Bulls clearly had the upper hand in today’s market. NASDAQ exceeded its dot-com era high and closed at a new all-time high. Russell 2000 also broke out to close at a new all-time high. S&P 500 and DJIA also enjoyed 1% plus moves to the upside, but no new highs were made by either of these two indices. Today’s gains turned the faster moving MACD “buy” indicator positive for DJIA, S&P 500 and NASDAQ. Russell 2000 MACD was already positive.
Technically, the picture is rather mixed across the four indices. Stochastic and relative strength indicators applied to Russell 2000 suggest small-cap shares are overbought. The same indicators applied to DJIA, S&P 500 and NASDAQ are essentially in neutral territory suggesting that some more upside is possible. It is encouraging to see tech and small-cap finally leading the way higher, but with the frequently treacherous end of Q2 quickly approaching, it would not be surprising to see today’s break out quickly become just another fake out.
ETF Portfolio Updates
In accordance with our June 4,
official MACD Seasonal NASDAQ Sell signal Alert,
First Trust DJ Internet (FDN),
iShares DJ US Medical Devices (IHI),
iShares DJ US Tech (IYW),
SPDR Technology (XLK),
iShares Russell 2000 (IWM) and
PowerShares QQQ (QQQ) were closed out of the portfolio using their respective closing prices on that day. The average gain for all six of these positions was a respectable 11.4%. IHI was the best, advancing 17.8%.
Also in that Alert, we officially added to our three defensive positions, iShares 20+ Year Treasury Bond (TLT), iShares Core US Aggregate Bond (AGG) and AdvisorShares Ranger Equity Bear (HDGE). As a result of doubling our positions in these ETFs, the “Presented Price” for TLT, AGG and HDGE has been adjusted to reflect an average purchase price. Due to recent market strength, TLT, AGG and HDGE were all modestly lower at yesterday’s close. Additional TLT, AGG and HDGE purchases can be considered at current levels as all three are below their respective buy limits.
Direxion Daily Jr Gold Miners Bear 3X (JDST) was also closed out on the close on June 4. Physical gold has been range bound since March keeping many mining stocks in tight ranges as well. JDST’s 3x leverage helped turn an otherwise flat trade into a decent 6.2% profit relatively quickly.
Both of this month’s
Seasonal Sector Trades ideas have been added to the portfolio.
iPath Bloomberg Livestock Sub-TR ETN (COW) and
PowerShares DB Agriculture (DBA) are modestly lower and on Hold.
With the exception of our three Worst Months trades, TLT, AGG and HDGE, all other positions in the portfolio are on hold. SPDR HealthCare (XLV) did trade above its auto-sell today. If you have sold your position that is fine, but officially we are going to continue to Hold XLV as the sector has a solid track record of outperforming the broader market during the Worst Months.
Disclosure Note: At press time, officers of the Hirsch Organization, or accounts they control held a position in USO.
|
Mid-Month Update: Surviving the Worst Six Months
|
|
By:
Jeffrey A. Hirsch
|
June 16, 2015
|
|
|
|
Ah, summer on Wall Street hazy, hot, humid and volatile. Volatility as measured by the dreaded VIX has not really been that high historically, the major averages and the shares that make them up sure have been bouncing around and trending lower, though not down by much. The DJIA has been leading the downdraft, off about 3% from the late-May high at the low last week.
Several items are likely weighing on stocks. The Fed’s big two-day midyear meeting started today. This is the first meeting in nearly a decade where rate hikes are on the table. We do not expect an increase tomorrow. This meeting is also associated with a Summary of Economic Projections and a press conference by the Chair, Janet Yellen. So it’s kind of a big deal.
Then there is the Greek debt fiasco, the trade agreement showdown in Washington, plus the recent ramp up of the 2016 Presidential Election Campaign. Jeb Bush is now officially running, bringing the number of Republican candidates to eleven– in the words of Spinal Tap’s Nigel Tufnel, “These go to eleven.” Get ready for the mudslinging. Economic readings have been less than sanguine. GDP looks negative for Q1 and other metrics like Housing Starts today have been falling. While there are positive data out there it is clear the economy could be on surer footing.
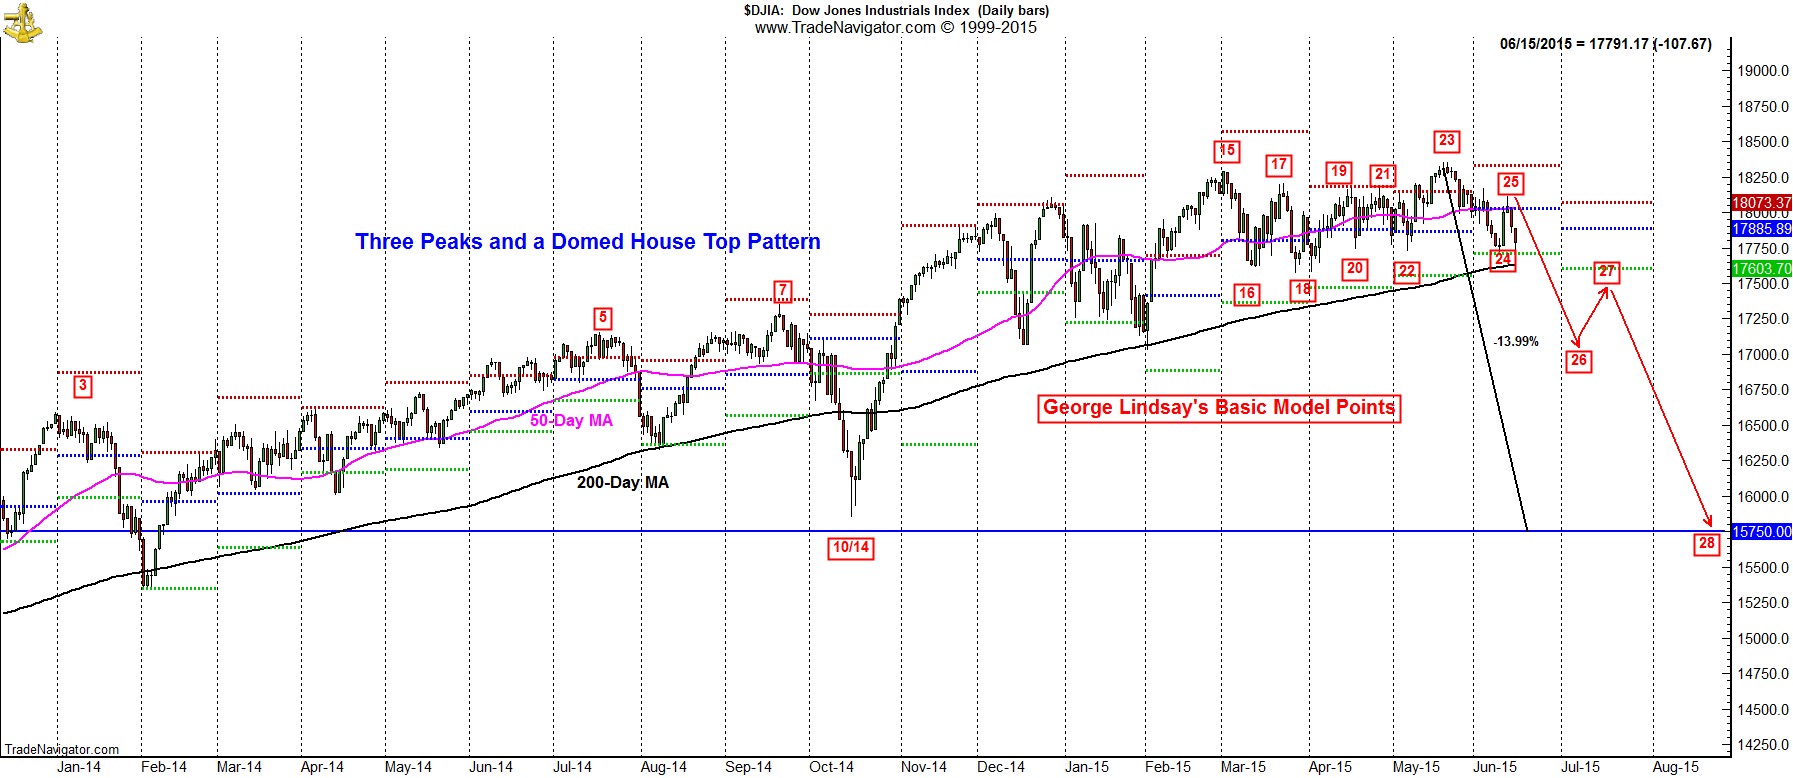
So fundamentals and politics are sketchy. Market valuations are a bit high and internals have not been incredibly robust with NYSE decliners outpacing advancers last week and new lows beating highs and up to nearly 300 last week. Technically the market is looking precarious, drifting sideways pretty much since March and unable to break through resistance. There is also a potential Head-And-Shoulder Top forming, not to mention a possible Three Peaks and a Domed House Top. (Did you see the
tweet from Bill Gross on technical analysis?)
However, it is also the Worst Six Months (AKA “Sell in May”) and we would contend that negative market seasonality is playing a role in the market’s recent struggles. Hopefully, we have helped you prepare over the past several months with the portfolio adjustments we’ve made. While holding on to a host of winning stock positions and a handful of ETF sector positions, we’ve taken some respectable gains, cut losers and weaker positions and implemented a few shorts and defensive plays.
Let’s review. On October 21, 2014 we issued our Best Six and Eight Months MACD Seasonal Buy Signal. On April 30, 2015 we issued the
Sell Signal for the Dow & S&P. On June 4 we issued the
Sell Signal for NASDAQ. From their respective buys to sells S&P 500 was up 7.4% and NASDAQ is up about 14.5%. From the sells to today, S&P is up 0.4% and NASDAQ is down about 0.7%.
We’ll be looking for additional shorting opportunities over the next few months, but for now stick to the game plan and stick to the drill. Hold on to big winners, tighten stops, limit new longs, and consider some of the bond ETF we have suggested and some of the shorts and downside plays. Or sit tight in cash and let the summer market storms wash over you and be ready for the next seasonal buying opportunity later in the year after a pullback or correction.
|
A Closer Look at Seasonal Volume Patterns
|
|
By:
Jeffrey A. Hirsch & Christopher Mistal
|
June 11, 2015
|
|
|
|
Yesterday’s robust market advance was accompanied by reasonably solid volume.
SPDR S&P 500 (SPY),
PowerShares QQQ (QQQ) and
SPDR DJIA (DIA) all exceeded their respective three-month average daily trading volumes according to data on
Yahoo! Finance. The market attempted to follow through on yesterday’s move today, but finished off its highs in a meager volume session. Not only have the “Best Six/Eights Months” for stocks come to an end, it also appears the summer doldrums have arrived.
We refer to the summer months as the doldrums due to the anemic volume and uninspired trading on Wall Street. The individual trader, if they are looking to sell a stock, is generally met with disinterest from the street. It becomes very difficult to sell a stock at a good price. That is also why many summer rallies tend to be short lived and are quickly followed by a pullback or correction.
Volume Surrounding Holidays
In the table below we have beefed up the holiday trading table from page 84 of the Stock Trader’s Almanac to illustrate the effects of dramatic changes in trading volume before and after holidays. As with all the graphs and charts in this study, the volume numbers in this table are based on the deviation from the annual average daily volume. But first we need to take into consideration the shortened trading days that occur around certain holidays.
Thanksgiving has the most consistent “half day” of all the holidays. Since 1992 the New York Stock Exchange (NYSE) has closed early and the roughly 50% reduction in trading should not be surprising as many people stay home recovering from the previous day’s feast and spend time with family. However, it seems that those that do trade are in good spirits, generally driving prices higher on the best post-holiday trading day of the bunch.
The day before and after Independence Day and Christmas do not close early as regularly, but have many early closings; when the respective holiday lands on a weekday. In any event all these annual average daily volume deviations provide a useful benchmark for evaluating the relevance or importance of a market move surrounding a holiday.
3-Day Weekends
Monitoring market performance on the individual days of the week has been revealing over the years. The insights were so inspiring that our iconoclastic founder and resident consigliere, Yale Hirsch, entitled his 1986 book Don’t Sell Stocks on Monday. In the following charts we have lined up the performance on each day of the week from pages 141 and 142 of the Almanac with annual average daily volume deviations for each day.
Not surprising, Monday, or the first trading day of the week shows substantially reduced trading volume on both the NYSE and NASDAQ of about 9% below the average. Friday is also below average. This underscores the recent trend of market gains being concentrated midweek and weakness at the beginning and end of weeks.
Apparently, traders and investors prefer long weekends; or at least not being exposed going into the weekend and being more tentative about taking new positions upon their return. Picking up stocks on Monday weakness and unloading during midweek strength on higher volume would appear to be a prudent strategy for the most part. It also pays to be keen to price and volume action on Fridays and the following Monday for indications of future market direction. Strong volume and price advances tend to be bullish, while back-to-back weakness on normal or elevated volume is frequently bearish.
Volume Lags
Examining the typical monthly price patterns from pages 145 and 146 of the Almanac in conjunction with the annual average daily volume deviations for each day below exposes the “follower” tendencies of market participants. Note how volume picks up after the usual month-end price gains and even more substantially following the normal mid-month surge.
Similar to the days of the week pattern, it makes sense to go against the crowd. Going long or covering shorts after midmonth into higher volume and selling or shorting the last few days of the month and into the first half as prices rise and volume declines appears to make the most sense.
Big Picture
Below we have plotted the one-year seasonal volume patterns since 1965 for the NYSE and 1978 for NASDAQ against the annual average daily volume moving average for 2015 so far. The typical summer lull is highlighted in yellow. Note the spike in volume that occurred in late April and May as the market began to sell-off after mid-month. The recent volume trend for the current year (red line) shows a perennial trail off in volume may be underway.
An atypical surge in volume this summer, especially accompanied by outsized gains, would be an encouraging sign that the bull market will continue. However, should traders lose their conviction and participate in the annual summer exodus from The Street, the long absent 10% market correction could quickly unfold.
|
Stock Portfolio Updates: Weakest Positions Trimmed, Holding Winners
|
|
By:
By Christopher Mistal
|
June 09, 2015
|
|
|
|
In average years, Treasury bonds have been a relatively safe place to park cash during the “Worst Four/Six Months” of the year for DJIA, S&P 500 and NASDAQ and other times of economic uncertainty. However, in recent years, the heavy hand of the Fed has distorted this seasonality. Round after round of QE sent demand for Treasury bonds soaring and interest rates lower, much lower. Now the concern is the Fed may actually start to raise interest rates sometime this year and Treasury bond prices have been falling sending yields higher.
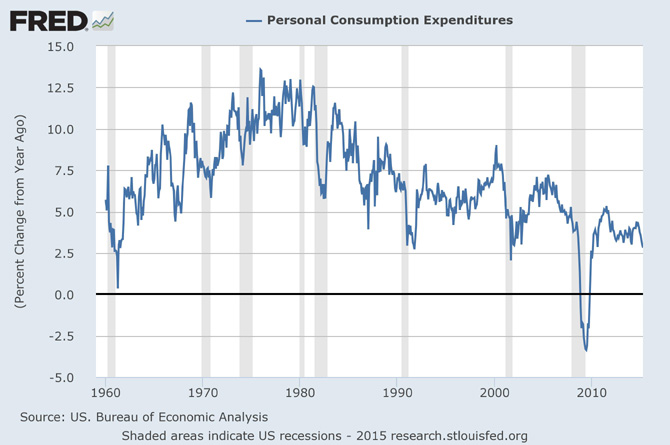
Is the Fed really going to raise interest rates sooner rather than later or are they just squawking to keep rates from going negative and creating a whole new batch of problems? The Fed’s mandate, from Congress, is maximum employment and stable prices. No hard numbers were provided, but the Fed has said it considered the unemployment rate at 6% (ish) to be good and a 2% annual change in personal consumption expenditures (PCE) would be an indication of stable prices. In the following two charts, this criterion has been met.
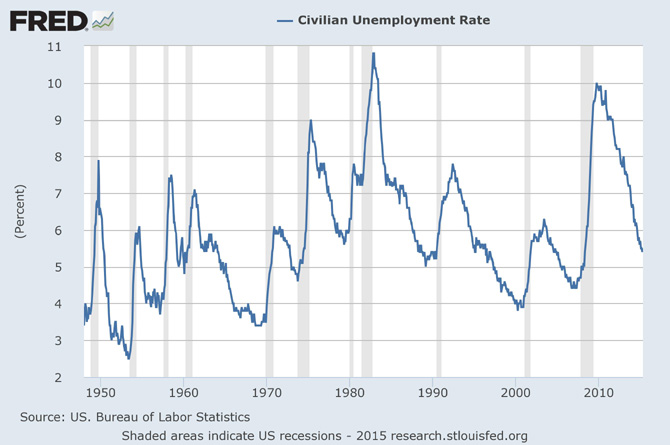
But wait, data junkies like us know these are some rather highly massaged figures. Yes unemployment has fallen to 5.5% as of May, but one of the largest reasons for the decline is a rather hefty decline in the labor force participation rate. This rate peaked in 2000, declined modestly and stabilized around 66% before plunging to less than 63% when the Great Recession struck in 2008. It is at its lowest level in nearly 40 years. Demographics could explain some of the trend, but this does not look like maximum employment.
Then there is the little issue of consumer price inflation (CPI). Unlike PCE, CPI has been less than or equal to zero for the last four months and this trend is still pointing lower, not higher. Two indicators heading in two different directions, one reportedly measures prices and the second spending. Not exactly the best argument for stable prices.
What about actual growth? Here again another chart that does not really support much higher interest rates. 2015 Q1 GDP decreased at an annual rate of 0.7%. While year-over-year GDP has barely managed to maintain 2.5% since 2010. This is well below average when compared to previous recovery periods.
Sluggish growth, falling prices and a labor market that is at best of questionably health do not make the strongest case for any meaningful rate increases by the Fed. Zero is obviously a problem they would like to fix, but the solution is likely to only be 0.5% to 0.75% increase in tiny, deliberate and painfully slow steps. This seems far less than what the Treasury bond market is currently pricing in.
Stock Portfolio Updates
Over the past three weeks since last update, through the market’s close on June 8, S&P 500 declined 2.3%. Russell 2000 was down 0.3% over the same time period. Collectively the three Almanac Investor Stock Portfolios slipped 0.7%. Individual stocks within our Portfolio essentially followed broad market trends, but our decline was buffered by its cash position that has grown to 65.6% of the total portfolio. Similar to the decline suffered by the large-cap S&P 500, our Large-Cap portfolio suffered the greatest decline, shedding 3.6%. Mid-Caps were best, off just 0.1%. The Small-Cap portfolio matched the Russell 2000 decline exactly, 0.3%.
Per last month’s update, Insteel Industries (IIIN) and Rocky Mountain Chocolate Factory (RMCF) were closed out of the Small-Cap portfolio. IIIN was closed out using its closing price on May 19 while RMCF traded as high as $13.70 on May 20 (and several days thereafter) offering ample opportunity to sell at $13.40 or better. All said, IIIN was closed out for a loss of 3.4% and RMCF was sold at a 1.6% loss. Patient and/or more nimble traders likely fared better.
Our Mid-Cap portfolio’s four holdings continue to look solid. JetBlue (JBLU) has taken a hit recently along with the rest of the airline stocks and the broader transportation sector. JBLU is, in our opinion, one of the best managed airlines. This is confirmed by actual seat time on its planes and by its peer besting revenue growth over the past year. Due to solid industry-wide auto sales, the previous Mid-Cap portfolio underachiever, Group 1 Automotive (GPI) and Lithia Motors (LAD) have both enjoyed swift moves higher since the start of June. The strong positive trend in auto sales data suggests there is more room for these two stocks to run. All positions in the Mid-Cap portfolio are on Hold.
In the Large-Cap portfolio, Polaris Industries (PII) and Avis Budget Group (CAR) were closed out of the portfolio using their closing prices on May 19. CAR has drifted lower since then and was a timely executed trade. However, closing out PII would have been much better on May 20 as shares popped over $7 that day. Nonetheless, PII is right back to its old ways and is headed lower again. Previously mentioned airline stock weakness also hit United Continental Holdings (UAL) and it closed below its stop loss on May 20. Profits taken on the one-third of the UAL position sold in December combined with the sale of the remaining position add up to a 38.7% gain overall.
The “Best Six Months” for DJIA and S&P ended on April 30. NASDAQ and Russell 2000 “Best Eight Months” ended on June 4. All other positions, not specifically mentioned above, are on Hold. See table below for updated Stop Losses.
|
Seasonal Sector Trades: June’s Seasonal Lows Setup High Probability Longs
|
|
By:
By Christopher Mistal & Jeffrey A. Hirsch
|
June 04, 2015
|
|
|
|
Beef prices tend to form a seasonal high in March as packers have purchased inventory ahead of the summer grilling season. Then as grill masters supplement steaks and burgers with pork ribs, chicken and other delicacies, beef consumption starts to decline in the hot weather. But beef supplies also begin to dwindle as feed lots are short on inventory.
Live Cattle prices typically hit a seasonal low in mid- to late June and then begin to rise before the school season begins as federal government subsidies for school lunch programs kick in for beef purchases. Consumption continues to increase through the winter and holiday season, generally keeping cattle futures prices higher through mid-February.
Our top longer-term seasonal play for live cattle is to go long the April 2016 contract near the usual June low on or about June 18 and hold it for 160 days until about February 6. Over the past 45 years this trade has been positive 30 times for a success rate of 66.7%. Prior to last year, the previous four years were stellar. 2010 registered the largest gain in this trade’s 45-year history and those four years combined account for more than half the historic gains. Last year, seasonal strength ended early with a late November high. A simple trailing stop loss would gain turned last year’s mild loss into a potentially sizable profit.
![[June Long Live Cattle (April 2016) Trade History]](/UploadedImage/AIN_0715_20150604_LC_History.jpg)
The weekly chart below depicts the Live Cattle continuous futures contract with iPath Bloomberg Livestock Sub-TR ETN (COW) overlaid in the solid black line to illustrate how the two instruments trade nearly in tandem. Traders may want to look at futures and options strategies, but others may find COW an adequate trading vehicle. In any event, beef is poised for its typical seasonal move up from an early summer low to a mid-winter peak.
![[Live Cattle (LC) Weekly Bars (Pit Plus Electronic Continuous contract) & Seasonal Pattern since 1970]](/UploadedImage/AIN_0715_20150604_LC_Seasonal.jpg)
COW is thinly traded averaging just about 8,000 shares per day on average over the past three months, but volume does pickup when Live Cattle (or lean hogs) begin to move. As of April 30, 2015, COW was 60.13% Live Cattle and 39.87% Lean Hogs. Caution should be taken with COW. This Exchange-Traded Note, like other unsecured debt securities with no principal protection, carries inherent risk, primarily issuer credit risk, and the risks with COW may be greater. PLEASE READ THE
PROSPECTUS, CONSULT YOUR FINANCIAL ADVISOR AND CONDUCT YOUR OWN DUE DILIGENCE. COW will be added to the Almanac Investor ETF Portfolio at today’s closing price. Use a buy limit for COW of $27.02. If purchased, a stop loss of $25.50 is suggested.
![[iPath DJ-UBS Livestock Sub-Index ETN (COW) Daily Bar Chart]](/UploadedImage/AIN_0715_20150604_COW.jpg)
In addition to Live Cattle seasonal strength beginning in June, Cocoa, Wheat and Sugar also begin seasonably favorable periods in the month. Outside of the futures market, iPath Pure Beta Cocoa ETN (CHOC), Teucrium Wheat (WEAT) and iPath Bloomberg Sugar ETN (SGG) correlate well. However with the exception of WEAT, all have traded less than 40,000 shares per day on average over the past three months and holdings are generally meager presenting further liquidity concerns. PowerShares DB Agriculture (DBA) is a good alternative as it provides exposure to eleven different commodities: Feeder Cattle, Cocoa, Coffee, Corn, Cotton, Lean Hogs, Live Cattle, Soybeans, Sugar, Wheat and Kansas Wheat. DBA has assets approaching $1billion and trades nearly 400,000 shares per day, offering plenty of liquidity relative to other choices. DBA will be added to the Almanac Investor ETF Portfolio at today’s closing price. Use a buy limit for DBA of $22.45. If purchased, a stop loss of $21.50 is suggested.
|
NASDAQ Seasonal Sell Update
|
|
By:
By Jeffrey A. Hirsch & Christopher Mistal
|
June 04, 2015
|
|
|
|
As of today’s close, both the faster and slower moving MACD indicators applied to NASDAQ have turned negative. At this time we are issuing our official MACD Seasonal Sell signal for NASDAQ.
NASDAQ’s “Best Eight Months” have come to an early end. As a result, Sell First Trust DJ Internet (FDN), iShares DJ US Medical Devices (IHI), iShares DJ US Tech (IYW), SPDR Technology (XLK), iShares Russell 2000 (IWM) and PowerShares QQQ (QQQ). For tracking purposes, these positions will be closed out of the ETF Portfolio using today’s closing prices.
Also, at this time we will officially add to existing positions in iShares 20+ Year Treasury Bond (TLT), iShares Core US Aggregate Bond (AGG) and AdvisorShares Ranger Equity Bear (HDGE) using today’s closing prices. New buy limits appear below in the updated ETF Portfolio.
This NASDAQ Seasonal Sell Signal is a reminder to tighten stop losses and/or take profits on technology related positions as NASDAQ’s seasonally favorable period has come to an end.
In addition to closing out tech and small-cap related ETFs, also Sell Direxion Daily Jr Gold Miners Bear 3X (JDST). For tracking purposes, it will be closed out of the portfolio using today’s close.
|
ETF Trades: Continue Holding Tech, Gold Miners on Radar
|
|
By:
Christopher Mistal
|
June 02, 2015
|
|
|
|
Recently we have been
tracking the lack of market performance this year versus past pre-election years. At the end of May DJIA was up just 1.1% year-to-date and S&P 500 2.2%. At the same point in the year in previous pre-election years DJIA was up on average slightly more than 8% while S&P 500 was typically up nearly 12%. This year’s underperformance can be explained by tepid economic data leading to so-so earnings forecasts and a Fed that is considering when to raise rates for the first time since 2006. The “glass is half full” crowd may look at this underperformance as a reason to consider buying U.S. stocks as it would seem there is a fair amount of upside potential available should the market decide to catch up to the average pre-election year.
In order to see if there exists any historical precedent to support this notion, I queried our database going back to 1901 for DJIA and 1930 for S&P 500. I was looking for past pre-election years where DJIA and S&P 500 had year-to-date performance less than or equal to this year at the end of May. In DJIA’s case there were six years, 1903, 1907, 1923, 1931, 1939 and 1947 (the only year with a full-year gain). S&P 500 had only four since 1930, 1931, 1935 (+41.4% full-year), 1939 and 1947 (no change). In the following two charts these years are combined into a single average performance and compared to the typical pre-election year and 2015 year-to-date through May 29. Based upon these two charts, the probabilities of the market catching up are quite slim.
NASDAQ’s Best Eight Months Update
Although the “Best Six Months” for DJIA and S&P 500 have officially come to an end, NASDAQ’s “Best Eight Months” (November through June) is still in progress. As of the market’s close yesterday, both the faster and slower moving MACD indicators applied to NASDAQ were positive. However, after running into resistance (red dashed line) in late-May NASDAQ’s momentum has begun to wane. Should NASDAQ finish today around unchanged, a decline of 0.1% (about 7.5 points) would turn NASDAQ’s MACD Sell indicator negative. When NASDAQ’s MACD Sell indicator becomes negative, we will issue our NASDAQ Seasonal MACD Sell signal and begin clearing out remaining technology and small-cap positions held in the Almanac Investor ETF Portfolio.
June/July Sector Seasonalities
June and July tend to offer few high-probability seasonal trading opportunities in typical years. This year is shaping up to be somewhat typical. We have already seen some volatility trickle into the markets and trading volume has been light as more and more traders and investors take time off to enjoy summer. As a result, there are just three seasonal sector setups in the Stock Trader’s Almanac 2015 for June and July. The first takes advantage of seasonal weakness by natural gas stocks beginning in mid-June through the end of July. This trade is based upon the NYSE ARCA Natural Gas index (XNG). Considering the XNG has already slipped nearly 10% from its late-April highs to current level, we will pass on this opportunity as the bulk of the move is likely over.
The next two seasonalities actually begin in July. Based upon the Dow Jones Transportation index, the transports are seasonally weak from mid-July through mid-October. Last month, we shorted iShares Transports (IYT) in association with seasonal weakness in the Morgan Stanley Cyclical index. Thus far, this trade has been mildly successful. Continue to Hold the short IYT position.
July’s last seasonal opportunity is based upon the PHLX Gold/Silver index. Over the past fifteen years this index has produced an average gain of 14.6% from its end of July lows to its late December highs. The index is comprised of 30 precious metal mining company stocks. Obviously, moves higher by physical gold and silver would benefit the companies that mine the metals, but the stocks can also rise in anticipation of higher precious metals prices and during periods of uncertainty. Market Vector Gold Miners (GDX) is the ETF of choice for this trade. It has more than $6 billion in assets and has traded nearly 40 million shares on average over the past three months. Because seasonal strength does not typically begin until late-July, we will be patient and look to add GDX to the ETF Portfolio on dips below $19.25. If purchased set an initial stop loss at $17.33 and take profits at the auto-sell price of $24.27.
ETF Portfolio Updates
In preparation for the end of NASDAQ’s “Best Eight Months,” stop losses have been raised significantly for FDN, IHI, IYW, XLK, IWM and QQQ. See table below for exact values. When we issue our NASDAQ Seasonal Sell signal, we will close these positions out of the portfolio.
Previously mentioned weakness in natural gas stocks hit First Trust ISE-Revere Natural Gas (FCG) on May 26 when it closed below its stop loss of $10.79. The decline arrived early and eroded a large portion of the gains FCG had; nonetheless a 7.6% gain was realized when it was stopped out.
Defensive positions, HDGE, TLT and AGG have all been added to the portfolio and are on hold for now. When we issue NASDAQ’s Seasonal Sell signal we will reevaluate these positions and possibly increase the positions.
All four of last month’s new ETF Trade ideas were also added to the portfolio over the past month. All four positions had modest gains at yesterday’s close. Please note the changes in stop losses and auto-sell prices for these positions.
Disclosure Note: At press time, officers of the Hirsch Organization, or accounts they control held a position in USO.