|
Market at a Glance - 6/30/2022
|
|
By:
Christopher Mistal
|
June 30, 2022
|
|
|
|
6/30/2022: Dow 30775.43 | S&P 3785.38 | NASDAQ 11028.74 | Russell 2K 1707.99 | NYSE 14487.64 | Value Line Arith 8055.70
Seasonal: Neutral. July has been the strongest month of the third quarter. Midterm-year Julys have a mixed record ranking #3 for DJIA and #5 S&P 500, but for NASDAQ and Russell 2000 July is the worst month in midterm years. NASDAQ’s seasonal midyear rally ends on or around July 14. Early July gains tend to fizzle after mid-month. July is the first month of NASDAQ’s Worst Four Months, July through October.
Fundamental: Shaky. Third estimate of Q1 GDP was revised even lower to a –1.6% annual rate. Atlanta Fed’s GDPNow forecast of Q2 GDP has slipped to –1.0% as of June 30. Two consecutive quarters of negative GDP satisfies the traditional definition of a recession. Headline inflation has accelerated to a new multi-decade high. Official employment metrics remain firm, but the technology sector has slowed hiring and, in some instances, begun layoffs. Consumer sentiment has plunged to the lowest level on record according to University of Michigan’s final release in June. Corporate earnings could be the next to suffer.
Technical: Oversold Bounce? Countless key support levels have not held this year for DJIA, S&P 500 or NASDAQ. With several popular companies trading at or near pre-Covid levels, it is looking increasingly likely that DJIA, S&P 500 and NASDAQ return to pre-Covid levels before the bear market ends. DJIA has already come within a few hundred points of its February 2020 closing high of 29551.42. S&P 500 pre-Covid closing high was 3386.15 and NASDAQ’s was 9817.18.
Monetary: 1.50 – 1.75%. Surging inflation has forced the Fed to accelerate interest rate increases. The Fed is currently projecting a 3.1% to 3.6% target rate by year end. This is a sharp increase from where it was at the start of the year. Most of this increase is expected before Election Day in November. Election results and a Fed nearing the end of a tightening cycle could prove to be the catalyst for the market to find bottom later this year and rally into 2023.
Psychological: Bearish. According to
Investor’s Intelligence Advisors Sentiment survey Bullish advisors stand at 32.9%. Correction advisors are at 27.1% while Bearish advisors numbered 40.0% as of their June 29 release. Bears have outnumbered bulls for nine straight weeks now and for good reason. That has been the market’s trend the entire year with only the briefest of bounces. Overall, we still do not see bearish sentiment at a level that suggests outright fear and/or panic and this is what it will likely be when the current bear market nears its end.
|
July Outlook: Worst Case Scenario in Play No Bottom Yet
|
|
By:
Jeffrey A. Hirsch & Christopher Mistal
|
June 30, 2022
|
|
|
|
Unfortunately, the stock market is delivering on its bearish historical 4-Year Cycle and seasonal tendencies here at the midway point of 2022. It is also playing out the less than sanguine outlook we wrote last year around this time in the
2022 Stock Trader’s Almanac (pages 10-11) and in our
annual forecast from last December 16. So where do we go from here?
Much to our chagrin the short answer is that we have likely not seen the low either in price or time. Current trends are now leaning towards the “Worst Case” scenario we presented in our 2022 forecast which was for a “Mild bear market for S&P 500 with 2022 ending down 10-20%.” With S&P 500 down 20.6% year-to-date at the end of June the bear is fully in place.
As we have been guiding over the past several months, we still expect this bear to put in a typical midterm election year bottom sometime in the August-October timeframe just ahead of the midterm elections. Stocks are clearly exhibiting the historical weakness that often transpires in the Worst Six Months of the year May-October and they are also tracking the “Weak Spot” of the 4-year cycle. But this should set us up for the “Sweet Spot” of the cycle from Q4 midterm year through Q2 pre-election year.
The intersection of the annual seasonal pattern and the 4-Year Cycle produces the quadrennial “Sweet Spot.” As we continue to patiently ride out this bear the chart below of the 4-year cycle may provide some solace. We are currently finalizing the 2023 edition of the Stock Trader’s Almanac so here’s a sneak peak at this new chart from the 2023 STA that highlights the midterm low and most importantly the quadrennial rally from the midterm low to the pre-election year high in what we call the Sweet Spot of the 4-year cycle.
The second and third quarter of the midterm year has been the weakest period of the entire 4-year pattern averaging losses over the 2-quarter period of -1.2% for the Dow, -1.5% for the S&P 500 and -5.0% for the NASDAQ Composite Index. But in the Sweet Spot of the cycle the Dow gains 19.3%, S&P 500 increases 20.0% and NASDAQ jumps 29.3% over the three-quarter span from midterm year Q4 to pre-election year Q2.
It is for this reason that we call midterm election years “A Bottom Pickers Paradise.” From the midterm low to the pre-election year high DJIA gains 46.8% since 1914 and NASDAQ gains a whopping 68.2% since 1974! As the 2022 bear market runs its course, the market will likely bounce along sideways, testing the lows, hitting its low point in late Q3 or early Q4 in the August-October period in prototypical midterm bottom fashion. Then be prepared for the rally off that low into the Sweet Spot and beyond to new highs.
Worst First Half Since 1970
As the market logged its worst first half start to the year with DJIA down 15.3%, S&P off 20.6% and NASDAQ down 29.5%, there has been a lot of positive spin on how great second halves are when the market is down so much in the first half. Well, we did some deeper digging and went back a bit further than some of the cherry-picked stats we have seen.
Unfortunately, as you can see in this chart of DJIA Top 10 Worst First Half Starts since 1901 all but two of the years, 1939 and 1970 end down 10% or more. Five years (1932, 1939, 1940, 1962 & 1970) ended significantly higher (>5%) than their mid-year levels. Three (1907, 1920, & 2008) ended much lower and two (1910 & 1913) were flat from mid-year to yearend.
We suspect that the Fed will be wrapping up its aggressive tightening cycle at the September meeting or at least indicating a pause after three consecutive large rate increases. After the 75-basis-point hike at the June meeting another 75 is expected in July and at least another 50 in September bringing the Fed Funds rate up to 3.0%. This should coincide with the end of the Weak Spot and the final push of the midterm election campaigns ahead of the Sweet Spot.
Pre-Election Best Year of 4-Year Cycle
Thankfully, the pre-election year is still the best year of the 4-year cycle and with midterm year 2022 delivering a bear as has been the tendency for past 74 years and back further, the prospects for upside action in 2023 are good despite the gloomy present situation. Since 1949 DJIA is up an average of 16.2% in the pre-election year, S&P is up 16.8% and since 1971 NASDAQ gains an average 29.3% in the third year of the 4-year cycle.
But first we must get through the midterm elections. The drop in consumer confidence, recession fears and President Biden’s already low and dwindling approval ratings implies that the usual loss of Congressional seats by the incumbent president’s party will likely result in the Republicans taking back control of both houses of Congress.
However, this would create the best political alignment for the stock market: a Democratic president with a Republican Congress. In the chart here as you can see in the green bar this combination has produced the best market performance for an average gain on the Dow of 16.4% since 1949. If President Biden can tack to the center and facilitate some bipartisan legislation as Bill Clinton did after the 1994 midterms the market could respond rather bullishly.
Pulse of the Market
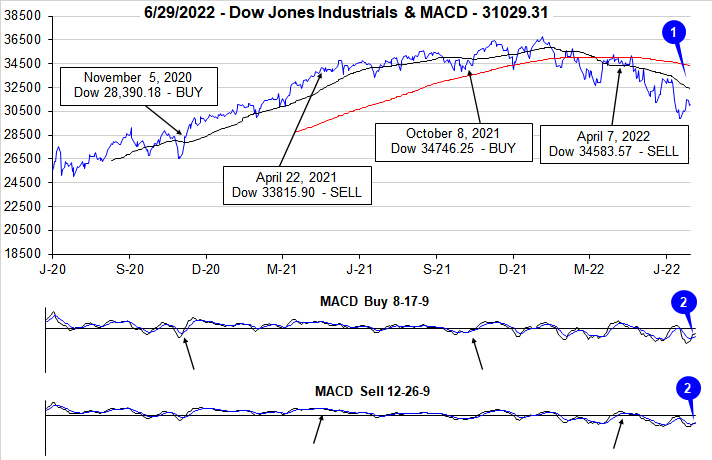
Coming into the final trading day of the first half of 2022, DJIA was down 14.6% year-to-date. This magnitude of first half declines would put 2022 in the Top 10 Worst First Halves since 1901 and would be its worst start since 1970. In 2008, DJIA was down -14.4% year-to-date at the end of the first half. S&P 500 is on course for a top five worst first half since 1930 while NASDAQ is having its worst first half ever going back to 1971. The present situation would be ever worse were it not for last week’s bounce higher (1). Last week’s gains were sufficient to turn both the faster and slower moving MACD indicators applied to DJIA positive, but that momentum appears to be fading already (2). If the historically bullish beginning-of-second-half tendencies do not materialize, the summer doldrums could be especially dangerous this year.
The sea of red that appears in the table below further highlights the market’s struggles thus far this year. Since the start of 2022, DJIA has been most consistently weak despite it being down the least with 19 weekly losses in 25 weeks (three out of four January weekly losses can been seen in the June 2022 Outlook) through the week ending June 24 (3). Similar clusters of negative performance appeared in bear market years of 2008-2009, 1974, 1931-1932 and in 1917. Certainly not great company from a historical viewpoint as the mildest DJIA bear in those years was a 40.1% decline from the bear that ended on December 19, 1917 (STA 2022 page 133). The silver lining here is some of the best historical buying opportunities came at the end of these bear markets.
During the June selling wave, DJIA recorded its eighth Down Friday/Down Monday (DF/DM) of the year (4). On its current trajectory, DJIA is on track to exceed its DF/DM count from 2008 and potentially match or exceed the 18 occurrences in 2002. As long as uncertainty remains elevated, additional DF/DMs are likely. This year they have been fairly reliable signals that selling pressure was beginning to accelerate with more declines following.
Although S&P 500 (5) and NASDAQ (6) have not had as many down weeks as DJIA, their respective weekly losses have been larger. Technology was the market’s leader in 2020 and 2021 and it has led on the way down. If this leadership trend persists, NASDAQ is likely to find its ultimate bottom first and then lead the overall market higher once again. Traditional signs of a bottom are still lacking.
NYSE Weekly Advancers and Weekly Decliners (7) have been consistent with the market’s overall moves. During big down weeks Weekly Decliners ballooned and during big positive weeks Weekly Advancers held the advantage. Despite nearing some historical extremes, the ratio of Weekly Decliners to Weekly Advancers still has not spiked to levels seen at other ultimate bottoms. During the Covid-19 bear, Weekly Decliners exceeded Weekly Advancers by a ratio of 15 to 1 and greater during three out of four weeks. The March 2009 bottom was preceded by two readings above 10 to 1 in three weeks.
Weekly New Highs (8) have continued to dwindle while Weekly New Lows have exploded and modestly retreated. Here again we see “near extreme,” but not quite the spike levels of historical bottoms. Weekly New Lows in excess of 2000 could signal a final washout has happened or is about to happen.
Even with headline inflation surging to a new multi-decade high, Treasury bond yields have remained rather sanguine. Yields have moved higher but it has been orderly and consistent with increases made by the Fed (9). We believe most would prefer to avoid an economic recession, but it is increasingly becoming more and more likely. Historically recessions have followed yield curve inversions. It would not be surprising to see this happen again as the Fed moves aggressively in its attempt to quell inflation.
|
July Almanac, Stats & Calendar: Historically Best Month of Q3
|
|
By:
Jeffrey A. Hirsch & Christopher Mistal
|
June 23, 2022
|
|
|
|
July historically is the best performing month of the third quarter however, the mostly negative results in August and September tend to make the comparison easy. Two “hot” Julys in 2009 and 2010 where DJIA and S&P 500 both gained greater than 6% and strong performances in 2013 and 2018 have boosted July’s average gains since 1950 to 1.3% and 1.1% respectively. Such strength inevitability stirs talk of a “summer rally”, but beware the hype, as it has historically been the weakest rally of all seasons (page 76, Stock Trader’s Almanac 2022).
July begins NASDAQ’s worst four months and is the fourth weakest performing NASDAQ month since 1971, posting a 0.6% average gain. Dynamic trading often accompanies the first full month of summer as the beginning of the second half of the year brings an inflow of new capital. This creates a bullish beginning, middle, a soft week after options expiration and some strength towards the end. The last trading day of July has a bearish bias over the last 21 years.
![[Recent 21-Year July Market Performance (2001-2021) Seasonal Pattern Chart]](/UploadedImage/AIN_0722_20220623_July_Seasonal_Pattern_Chart.jpg)
July’s first trading day is the third best performing first trading day of all twelve months with DJIA gaining a cumulative 1346.32 points since 1998. Over the past 21 years, DJIA’s first trading day of July has produced gains 76.2% of the time with an average advance of 0.30%. S&P 500 has advanced 85.7% of the time (average gain 0.35%). NASDAQ has been slightly weaker at 76.2% (0.24% average gain). No other day of the year exhibits this amount of across-the-board strength which makes a case for declaring the first trading day of July the most consistently bullish day of the year over the past 21 years.
Trading on the day before and after the Independence Day holiday is often lackluster. Volume tends to decline on either side of the holiday as vacations begin early and/or finish late. Since 1980, DJIA, S&P 500, NASDAQ and Russell 2000 have recorded net losses on the day after.
Midterm-year July rankings are something of a mixed bag, ranking #3 for DJIA and #5 S&P 500, averaging gains of 1.3% and 0.9% respectively (since 1950); while NASDAQ (since 1974) and Russell 2000 (since 1982) midterm Julys rank #12. NASDAQ has only advanced in four of the last twelve midterm Julys with an average loss of 1.9%. Russell 2000 has advanced only three in its last ten with an average decline of 3.8%.
NASDAQ’s 12-Day Midyear Rally
In the mid-1980s the market began to evolve into a tech-driven market and the market’s focus in early summer shifted to the outlook for second quarter earnings of technology companies. In anticipation of positive results, over the last three trading days of June and the first nine trading days in July, NASDAQ typically enjoys a rally. This 12-day run has been up 29 of the past 37 years with an average historical gain of 2.6%. Look for this rally to begin around June 28 and run until about July 14.
After the bursting of the tech bubble in 2000, NASDAQ’s mid-year rally had a spotty track record from 2002 until 2009 with three appearances and five no-shows in those years. However, it has been quite solid over the last twelve years, up eleven times with a single mild 0.1% loss in 2015. Last year, NASDAQ advanced a solid 2.0% during the 12-day span.
|
July 2022 Strategy Calendar
|
|
By:
Christopher Mistal
|
June 23, 2022
|
|
|
|
|
Mid-Month Update: Riding the Bear to the Midterm Bottom
|
|
By:
Jeffrey A. Hirsch & Christopher Mistal
|
June 16, 2022
|
|
|
|
On Monday of this week DJIA fell into an official
Ned Davis Research (NDR)
bear market. For decades we have used and relied upon NDR’s definitions of bull and bear markets in the annual Stock Trader’s Almanac and in our newsletters. NDR’s definition of a bear is more nuanced than the typical 20% decline from peak that is commonly used throughout media nowadays. An NDR bear market requires a 30% drop in the Dow Jones Industrial Average after 50 calendar days or a 13% decline after 145 calendar days and a new lower trough. Reversals of 30% in the Value Line Geometric Index also qualify. This time around, DJIA was at a new low, down greater than 13% after 145 calendar days on June 13, 2022.
This raises the question, “Where can we go from here?” In the table below we examine all the 13% DJIA declines after 145 days since 1948 and the subsequent action after. The four 30% Value Line Geometric reversal bear markets in 1987, 1990, 1998 and 2020 are included for reference.
Of the eighteen others only the two reached bottom at the 13%, 145-day decline, 1953 and 2016. Eight were followed by further declines of less than 10% and eight greater. Twelve bottomed out less than three months later and six dragged on for 6 months or more. The average additional decline was 12.4% over an average of 139 calendar days. Based upon DJIA’s close on June 13 and these averages, DJIA could ultimately find bottom around October 31, 2022, at 26732.13. This would represent a total bear market decline of 27.4% in 298 calendar days.
![[Midterm Years with Bear Market Bottoms since WWII]](/UploadedImage/AIN_0722_20220616_Midterm_Bear_Seasonal_Pattern-v-2022.jpg)
These numbers align reasonably well with the typical post-election year high to midterm low since 1913 (STA 22, page 34). They are also consistent with our recent
midterm year seasonal pattern charts and comparisons of 2022 to 1962, 1970 and 1974. The early Q4 bottom also aligns well with the beginning of the
Sweet Spot of the 4-year cycle. Additionally, by early Q4, the Fed is currently projected to have significantly raised interest rates and midterm election results will be arriving soon.
Four Horsemen of the Economy
Now that the bear has been declared the $64,000 is when will the powers that be declare recession and how long and deep will it be. Let’s turn to our Four Horsemen of the Economy. Our updated Four Horsemen chart below from our
2022 Annual Forecast is clearly indicating at least a mild recession is likely already upon us. The “official” recession definition is two consecutive quarters of negative GDP growth. GDP has already come in negative for Q1 2022 and the
Atlanta Fed’s GDPNow estimate for Q2 is now exactly zero as of today’s update.
The current readings from the Four Horsemen align closely with previous peaks and troughs associated with the beginning of a recession. Starting at the bottom, the Unemployment Rate has been rather low at 3.6% for three straight months. Historically, the Unemployment Rate has bottomed and turned higher at the outset of recessions.
Our in-house inflation metrics plot the 6-month exponential moving average (EMA) of the year-over-year change in the CPI and PPI. It’s no secret that these high levels of inflation, not seen since the stagflation 1970s and the double-dip recession 1980s, are consistent with previous recessions. Plunging Consumer Confidence is also a clear marker of recession. But on the flipside, all these dire readings and “official” recessions line up with the low points of the DJIA on the top.
In the four months between now and our projected midterm bottom, inflation could reach a peak and begin to subside. Russia and Ukraine could also arrive at some tenable ceasefire. If China can avoid further Covid-19 lockdowns, supply chains could turn the corner too. Any perceived improvement would be welcomed by the market. Until then, it is the “Worst Months” of the year and the Weak Spot of the four-year cycle. Caution and patience remain the best course of action.
|
NASDAQ Seasonal MACD Update: It’s a Bear Market
|
|
By:
Jeffrey A. Hirsch & Christopher Mistal
|
June 13, 2022
|
|
|
|
As of today’s close, the slower moving MACD “Sell” indicator applied to NASDAQ is negative. NASDAQ’s “Best Eight Months” has come to an end. At this time we are issuing our official MACD Seasonal Sell signal for NASDAQ.
Sell Invesco QQQ (QQQ).
Sell iShares Russell 2000 (IWM).
For tracking purposes, these positions will be closed out of the Tactical Switching Strategy ETF Portfolio using their respective average prices tomorrow, June 14.
NASDAQ declined 25.9% during its historically bullish period. This down “Best Eight Months” with MACD timing period is the first loss for the strategy since the early days of the financial crisis in 2008-2009. It is NASDAQ’s second worst loss ever during its “Best Months.” Its worst loss was 32.2% during the beginning of the Dot-com bubble burst in 2000.
In addition to today’s NASDAQ Seasonal Sell, the DJIA is officially in a bear market as of today’s close. For years we have relied upon the Ned Davis Research definition of bear and bull markets. An official bear market requires a 30% drop in the Dow Jones Industrial Average after 50 calendar days or a 13% decline after 145 calendar days. Reversals of 30% in the Value Line Geometric Index also qualify. The drop is measured from peak to trough and both price and time criteria must be met. At today’s close it has been 160 calendar days since DJIA’s peak on January 4, DJIA is down 17.1% and at a new closing low which meets the parameters.
Inflation is stubbornly remaining at multi-decade highs, the Fed is tightening, sentiment is bearish, support levels are not holding, supply chain disruptions persist, there is conflict in Europe and energy prices are at record highs for consumers. Continue to be patient as the Weak Spot of the four-year-cycle will eventually give way to the Sweet Spot, likely sometime later in Q3 or in early Q4. Even with inflation at multi-decade highs, cash is likely the least risky place to wait.
|
NASDAQ MACD & Stock Portfolio Updates: Rally Stalls
|
|
By:
Christopher Mistal
|
June 08, 2022
|
|
|
|
NASDAQ Seasonal MACD Update
After surging to finish May, NASDAQ (along with S&P 500 and DJIA) have stalled out. Our slower moving MACD “Sell” indicator (12-26-9) remains positive but is fading following eight days of sideways to lower movement right around 12000. As of today’s close, NASDAQ would need to decline a massive 932.86 points (7.94%) in a single day to turn MACD negative.
When NASDAQ’s MACD Sell indicator turns negative, we will issue our NASDAQ Seasonal MACD Sell signal via email Alert and begin clearing out remaining technology and/or small-cap positions held in the Almanac Investor ETF Portfolios. Until that time, all related positions are on Hold.
S&P 500 Performance Before, During and After Recessions
A recession has widely been defined by economists as two consecutive quarters of decline in GDP. Whether or not you are a glass half-full or half-empty person, Q1 U.S. GDP was negative which does satisfy half of that definition. More recently the Federal Reserve Bank of Atlanta’s GDPNow model’s estimate for Q2 U.S GDP has been trending increasingly closer to the zero line. In its most recent update on June 8, its estimate stood at 0.9%. This is a substantial decline compared to its May 17 projection of a 2.5% annualized quarterly growth rate. In an effort to gain a better understanding of the market’s performance before, during and after recessions we have compiled the following table.
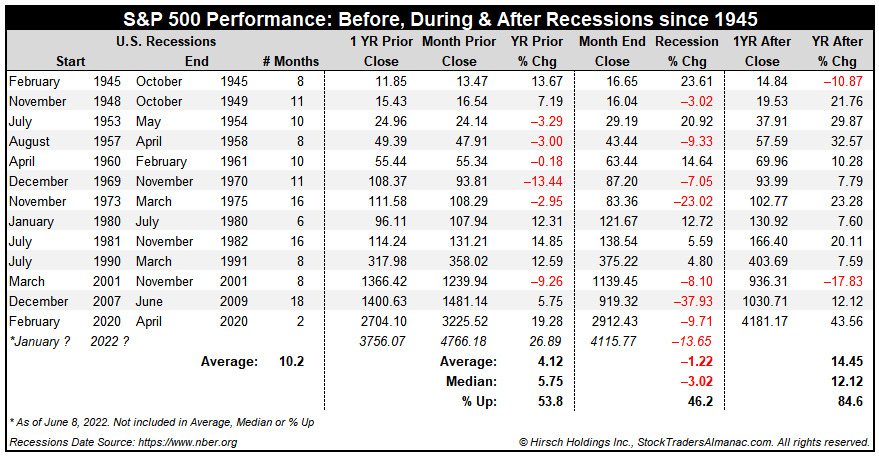
Dates for U.S recessions were sourced from the National Bureau of Economic Research (NBER). Since 1945, there have been 13 U.S. recessions. The most recent and shortest was the result of Covid-19 and began in February 2020 and ended two months later in April. The longest recession post WWII was caused by financial crisis in 2008-2009 and lasted 18 months. The average duration of a recession has been 10.2 months.
Historically, in the 12-month period (year) prior to the start of the recession, S&P 500 has been positive 53.8% of the time with an average gain of 4.12%. In the table above, the year before the recession began is calculated using monthly closes. For example the 1-year prior to the Covid-19 recession was calculated using the close from January 2019 through the close of January 2020. During recessions S&P 500 historically advanced 46.2% of the time but with an average loss of 1.22%. Once the recession ended S&P 500 generally tended to soar 14.45% on average higher over the next year with gains occurring 84.6% of the time.
If, and this is still a big “if,” we are currently in a recession, and it began in January of this year then it could also be around halfway over based upon the average recession duration of approximately 10 months. Projecting out further, then the end could also arrive sometime around October or November just in time for the “Sweet Spot” of the 4-Year Election Cycle to begin. Perhaps a recession is outright avoided and instead the market just completes a typical, volatile midterm year correction. The market is still navigating the “
Weak Spot” and we remain patient for a better risk/reward setup that will likely arrive in late Q3 or early Q4 this year.
Stock Portfolio Updates
Over the last four weeks since last update through yesterday’s close, S&P 500 advanced 4.6% while Russell 2000 jumped 10.1%. Over the same time period the entire stock portfolio climbed 1% higher, excluding dividends and any fees. A sizable cash position of approximately 74% of the total portfolio kept overall performance in check. This cash percentage is not a target allocation, it is the result of positions being closed as market volatility rose and positions began weakening.
Unlike recent updates, not a single position was stopped out in the last four weeks. The portfolio also has the fewest number of positions since the brief Covid-19 induced bear market of early 2020, two small-caps, one mid-cap and thirteen large-cap positions. Large-cap stocks performed the best, up 5% on average. Amdocs (DOX), DT Midstream (DTM) and Constellation Energy (CEG) are notable standouts each up over 11% since last update. AT&T (T) also receives an honorable mention, up 8.3% in four weeks and back into positive territory.
T's recent spinoff, Warner Brothers Discovery (WBD) has not fared well and is the only position in the portfolio currently in the red. A broad disinterest in growth stocks and a tightening streaming market are likely contributing to the weakness. Management changes are also apparently providing sufficient reason to keep selling pressure elevated. Trading volume does appear to be easing which could suggest a bottom in the near future.
All positions are on Hold. Please see the table below for updated stop losses and current advice for positions not covered above.
|
ETF Trades & NASDAQ’s Best Eight Months: Tech Bounce Most Welcome
|
|
By:
Christopher Mistal
|
June 02, 2022
|
|
|
|
NASDAQ’s Best Eight Months Update
Barring a significant run higher, NASDAQ’s 13-year streak of gains during its “Best Eight Months” is likely to come to an end this year. Detailed on page 62 of the Stock Trader’s Almanac 2022, NASDAQ has averaged a solid 11.4% gain during its “Best Month” since October 2008. During the period, NASDAQ suffered five losing “Worst Months” periods, three single-digit gains and five double-digit gains. It appears the goal of the Tactical Switching Strategy, as applied to NASDAQ, of capturing the majority of the gains while potentially missing a sizable portion of declines is still being met.
![[NASDAQ Daily Bars and MACD Sell Indicator Chart]](/UploadedImage/AIN_0722_20220602_NASDAQ_MACD.jpg)
This year’s still potential NASDAQ’s “Best Months” loss will not be the first nor is it likely to be the last. With the Seasonal Sell window now open, any further damage done to NASDAQ when its current rally comes to an end is likely to be minimized or even possibly avoided altogether depending on the exact timing of when NASDAQ’s Seasonal MACD Sell Signal triggers. As of today’s close, NASDAQ would need to suffer a crushing one-day decline of nearly 20% to cause its MACD to turn negative. The more plausible scenario involves NASDAQ climbing/drifting higher while momentum and the pace of gains slows and then MACD rolls negative at a level somewhere above its present value.
When NASDAQ’s MACD Sell indicator turns negative again, we will issue our NASDAQ Seasonal MACD Sell signal and begin clearing out remaining technology and/or small-cap positions held in the Almanac Investor ETF Portfolios. Until that time, all related positions are on Hold.
June Sector Seasonalities
There is only one new Sector Seasonality that begins in June, a bearish period for natural gas stocks that is based upon the NYSE ARCA Natural Gas index (XNG). We are going to pass on this trade setup. Russia’s invasion of Ukraine has increased uncertainty in the energy sector to lofty, potentially dangerous levels. Economic sanctions on Russia have traditional markets for its oil & gas exports scrambling to find alternates while domestically demand remains robust despite current prices. It is possible that substantial premium has already been built into to the price of natural gas along with the stocks of companies that produce it, but momentum still appears to be in the bull’s court at this time. Risk to a short trade just does not appear to balance with any potential reward at this time.
Sector Rotation ETF Portfolio Updates
Three bullish and one bearish Sector Seasonality come to an end in June. Starting at the top of the table on the bottom of page 94 in the 2022 Stock Trader’s Almanac, the bullish trade based upon XNG comes first. Our correlating ETF position, first presented in January, First Trust Natural Gas (FCG), traded above its auto-sell in April and was closed out for a 36.6% gain excluding any trading costs or dividends.
The next seasonality to end is a bearish period for gold and silver stocks based upon the Gold and Silver index (XAU). We passed on this setup as inflation concerns muddled the fundamental outlook and the technical setup appeared less than ideal. That decision has proved prudent as XAU rallied along with gold and silver during this time. Our position in SPDR Gold (GLD) is essentially unchanged since last update and remains on Hold.
Lastly, we come to the Consumer Sector, Discretionary and Staples. SPDR Consumer Discretionary (XLY) was stopped out in January and closed at $183.18 for a minuscule gain of 0.1%. SPDR Consumer Staples (XLP) was sold at its auto-sell price for $80.53 in April and a new position was established on May 12 when XLP dipped below its buy limit. Staples has a solid historical record of weathering the “Worst Six Months” well with a combination of a high frequency of gains and average performance even before considering any dividends paid. XLP is on Hold.
SPDR Technology (XLK) was stopped out on May 9. This position in XLK was originally established in March for High-Tech’s favorable period from mid-March through the beginning of July. XLK did rally to close out March but gave back all of it gains throughout April.
As much off an eye sore as it is, SPDR S&P Biotech (XBI) is on Hold. XBI is comprised of many development-stage companies that have scant revenues and expanding losses as R&D continues. Tightening monetary conditions are likely to make it even more challenging for many of these companies. We were obviously early to purchase shares, but XBI is intended to be a longer-term holding in the portfolio. XBI’s prospects will likely improve when the broader market finds firmer footing.
Tactical Seasonal Switching Strategy Updates
We will continue to maintain a neutral bias in the Tactical Seasonal Switching portfolio until when NASDAQ’s Seasonal MACD Sell triggers. At that time the portfolio will shift to a conservative/defensive stance for the balance of the Worst Months. Surging inflation, supply chain woes and an aggressively tightening Fed appear likely to keep uncertainty and market volatility elevated this summer.
Bond positions, TLT, AGG and BND are on Hold. These are partial positions that we may or may not add to after NASDAQ’s Seasonal Sell triggers. Bonds have bounced off their respective recent lows as recession fears have grown but face further downside pressure from the Fed. Cash may prove to be the least dangerous position this “Worst Months” period. The biggest risk to cash is inflation and its erosion of purchasing power, but the Fed has repeatedly pledged to get inflation under control.
Invesco QQQ Trust (QQQ) and iShares Russell 2000 (IWM) are on Hold. As noted above, this has been a disappointing “Best Months” period, but MACD has recently turned positive and QQQ and IWM are bouncing.