|
August 2019 Trading & Investment Strategy
|
|
By:
|
July 25, 2019
|
|
|
|
|
Market at a Glance - 7/25/2019
|
|
By:
Christopher Mistal
|
July 25, 2019
|
|
|
|
7/25/2019: Dow 27140.98 | S&P 3003.67 | NASDAQ 8238.54 | Russell 2K 1561.45 | NYSE 13169.29 | Value Line Arith 6273.18
Psychological: Complacent. According to Investor’s Intelligence Advisors Sentiment survey bulls are at 54.2%. Correction advisors are at 29% and Bearish advisors are 16.8%. Bulls did ease slightly from their previous level of 58.0% which was the high of 2019. A rate cut from the Fed, a debt-ceiling deal, increasing possibility of the ECB easing and trade deal hopes have all contributed to the sense of ease and calm. But what happens after the market seemingly gets everything it wants? Year-to-date gains would suggest a cooling-off period with a period of consolidation and perhaps a mild pullback during seasonally weak August and September.
Fundamental: Soft Patches. Q2 GDP estimate from Atlanta Fed GDPNow is at just 1.3% as of July 25. It had been as high as 2.1% in June. Corporate earnings are also currently forecast to decline for Q2 and Q3 according to latest S&P Capital IQ consensus estimates. On the brighter side, the economy added 224,000 net jobs in June and the unemployment rate is a low 3.7% while inflation remains subdued.
Technical: At resistance. DJIA, S&P 500 and NASDAQ all broke out to new all-time highs but have run into resistance and are struggling to maintain momentum and move even higher. NASDAQ’s Seasonal MACD Sell was triggered on the close on July 19. DJIA and S&P 500 MACD indicators are also negative and trending lower. Russell 2000 has been stuck in a holding pattern essentially since February. Without small-caps, other major indexes are likely to struggle to make any major move higher.
Monetary: 2.25-2.50%. Until next week when the Fed is expected to cut at least .25% and possibly 0.50%. This “insurance” cut maybe what the economy needs to alleviate some trade dispute uncertainty and put growth back on a positive and accelerating trajectory. Low rates have been supportive of markets as companies can easily and cheaply finance dividend increases and share buybacks.
Seasonal: Bearish. August is the worst DJIA, S&P 500, NASDAQ, Russell 1000 and Russell 2000 month over the last 31 years, 1988-2018, with average declines ranging from 0.1% by NASDAQ to 1.1% by DJIA. In pre-election years, August has been better with modest average gains.
|
August Outlook: Ripe For A Seasonal Pullback
|
|
By:
Jeffrey A. Hirsch & Christopher Mistal
|
July 25, 2019
|
|
|
|
Major U.S. stock market indices continue to track historic seasonal patterns and the historical seasonal pattern for Pre-Election Years quite closely this year and that suggests it is likely to continue to do so. The Dow, S&P 500 and NASDAQ have just logged new all-time highs and while that is bullish for the year as a hole and the second half in general it does indicate that we are ripe for a seasonal pullback.
As you can see in the accompanying chart mid-July in Pre-Election Years is frequently a point where the market begins its seasonal retreat after hitting new highs. Then after choppy, sideways, backing and filling action over the “Worst Four Months” July-October, additional new highs are usually reached in December and often at yearend, even on the last trading day of the year.
Frankly, the market is really getting everything it wants. At least a quarter point Fed rate cut is likely at the end of July. It looks like President Trump and the Democrats have worked out a new budget and debt ceiling deal this week that will be signed into law shortly. The trade battles and negotiations continue crawling along and every time things look a little shaky the Trump administration sends top officials for high level talks with China. Up until recently, economic readings and corporate results have been solid. This has all been a boon for stocks.
But now as economic data and earnings season has not been exceedingly firm, seasonal weakness, technical resistance and elevated sentiment have created an environment where the market is likely to retreat toward recent support levels around the March and June 2019 lows near Dow 25000, S&P 2725 and NASDAQ 7333 over the next three months – in the 8-12% correction area.
However, our longer term outlook for yearend and Election Year 2020 remains bullish. So here’s a little preview of our outlook for 2020 from the Stock Trader’s Almanac 2020 that we just sent to the press first shared with you, our loyal Almanac Investor Newsletter members.
For 2020, we could easily join the throng of skeptics and bears that are forecasting recession and a down market for 2020 and stoke investor’s fears, but we have three main observations that have guided us toward a more bullish outlook for Election Year 2020.
1. The Power of Incumbency. As you can see in the accompanying chart the stock market has performed much better in election years when a sitting president is running for reelection. Since 1949 the Dow is up 10.1% in election years when a sitting president is running for reelection vs. 5.3% in all election years and –1.6% in election years with an open field and no incumbent commander-in-chief running for a second term.
2. Fiscal and Monetary Policy Synchronicity. After several years of conflicting policy the Federal Reserve and the U.S. Federal government are finally getting in synch. Interest rates are historically low and the Fed is on the brink of lowering rates at the same time as fiscal policy has been lowering taxes and increasing spending. These dual pro-growth policies should continue to propel the stock market higher.
3. Recent Pattern of 50% Moves Following Extended Consolidations. An interesting pattern has materialized following the past few market consolidation phases. After bouncing around a base for 2-3 years the DJIA has rallied 50% higher. Following the 2009 secular bear market low the market rose to the 12,000 level on the Dow in February 2011 and then moved sideways for about than 2 years up and down and around 12,000. Then it took off at the end of Election Year 2012 rising 50% to 18,000 at the end of 2014. DJIA stayed close to 18,000 until just after the election in 2016. Then it jumped up another 50% near 27,000 in January 2018. Until this month DJIA has been unable to breakthrough 27,000. If this pattern continues, the next 50% move higher can be expected to gain momentum in 2020.
These gains will of course not come without pause and correction. The world stage will continue to feature some challenging geopolitical, diplomatic, trade-related and economic storylines. U.S. presidential campaign politics will increasingly focus on domestic political disputes, standoffs and unfinished business. But when all is said and done we expect 2020 to be an up year based on the historical patterns and cycles and current favorable policies, relatively healthy economics, a dovish Fed and positive market behavior. This all points to the likelihood that our May 2010 Super Boom Forecast when the Dow was around 10,000 for the Dow to reach 38,820 by the year 2025 may be ahead of schedule. (Check out the
update of the Super Boom Forecast in the April 11, 2019 subscriber alert on our website.)
Pulse of the Market
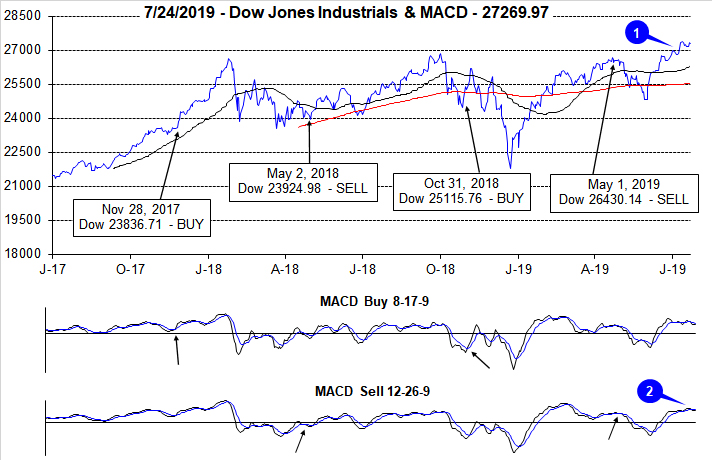
DJIA broke out to new all-time highs in July, crossing through and closing above 27,000 for the first time ever (1). Both DJIA’s 50- and 200-day moving averages are bullishly trending higher, but positive momentum is showing signs of waning which is being confirmed by MACD indicators. Both the faster and slower moving MACD indicators applied to DJIA are negative and trending lower (2). Thus far, DJIA has only demonstrated mild weakness, but absent further catalyst DJIA could be on the verge of a mild, seasonally driven pullback in the near-term.
During the holiday shortened week in observance of Independence Day DJIA recorded its fourth Down Friday/Down Monday (DF/DM) of 2019 (3). Historically such occurrences have been followed by weakness sometime during the following 90 calendar days. Thus far, that weakness has been virtually nonexistent with just a mild loss during last week. Although the DF/DM did break DJIA’s winning streak of Monday gains, Monday’s performance over the past eight weeks is the exact opposite of what it was in the prior eight-week period.
Even with a couple of weekly losses sprinkled in, DJIA, S&P 500 and NASDAQ all advanced solidly in June and are positive in July with four trading sessions remaining. DJIA, S&P 500 (4) and NASDAQ (5) have risen in six of the last eight weeks. Unlike lengthy consecutive weekly winning streaks an occasional down week is probably healthy for the market as it may keep sentiment in check.
Market breadth measured by NYSE Weekly Advancers and NYSE Weekly Decliners (6) has been somewhat tepid over the past four weeks with Advancers leading declining by only modest amounts. This is possibly an early caution sign as it suggests recent highs were not supported by a broad base of participating stocks. If the breakout was fueled by just a few large stocks, then it may not last.
Weekly New Highs and Low (7) have also broken the bullish trend that was in place in June. New Highs have slipped lower while New Lows have risen since late June. This is yet another caution flag that may suggest the breakout to new highs may be short-lived. If New Highs continue to decline in number with expanding New Lows, lower is likely to be the next direction for the market at least in the near-term.
After slipping to a multi-year low, the 30-year Treasury bond yield (8) has rebounded and appears to be leveling off in the 2.5 to 2.65 range. Yields are likely to bounce around in a narrow range while waiting for the next Fed announcement on July 31. Historically, low rates have been a positive for stocks and within that context; rates remain low, even today.
Click for larger graphic…
|
August Almanac: Worst Performing Month of Year Over Last 31 Years
|
|
By:
Christopher Mistal & Jeffrey A. Hirsch
|
July 25, 2019
|
|
|
|
Money flows from harvesting made August a great stock market month in the first half of the Twentieth Century. It was the best month from 1901 to 1951. In 1900, 37.5% of the population was farming. Now that less than 2% farm, August is amongst the worst months of the year. It is the worst DJIA, S&P 500, NASDAQ, Russell 1000 and Russell 2000 month over the last 31 years, 1988-2018 with average declines ranging from 0.1% by NASDAQ to 1.1% by DJIA.
In pre-election years since 1950, Augusts’ rankings improve modestly: #7 DJIA, #8 S&P 500, #10 NASDAQ (since 1971), #9 Russell 1000 and #10 Russell 2000 (since 1979). Average performance in pre-election years is positive except for Russell 2000 which is unchanged.
[Pre-Election Year August Mini Table]
Contributing to this poor performance since 1987; the shortest bear market in history (45 days) caused by turmoil in Russia, the Asian currency crisis and the Long-Term Capital Management hedge fund debacle ending August 31, 1998 with the DJIA shedding 6.4% that day. DJIA dropped a record 1344.22 points for the month, off 15.1%—which is the second worst monthly percentage DJIA loss since 1950. Saddam Hussein triggered a 10.0% slide in August 1990. The best DJIA gains occurred in 1982 (11.5%) and 1984 (9.8%) as bear markets ended. Sizeable losses in 2010, 2011 and 2013 of over 4% on DJIA have widened Augusts’ average decline. A strong August in 2014 of S&P 3.8% and NASDAQ 4.8% preceded corrections of 7.4% and 8.4% respectively from mid-September to mid-October.
The first nine trading days of the month have exhibited weakness while mid-month is better. Note the bullish cluster from August 15-19. The end of August tends to get whacked as traders evacuate Wall Street for the summer finale. The last five days have suffered in 13 of the last 23 years with the S&P 500 up only six times on the penultimate day in the past 23 years. In the last 23 years, the last five days of August have averaged losses of: Dow Jones Industrials, –0.9%; S&P 500, –0.7% and NASDAQ, –0.3%.
On Monday of expiration the Dow has been up 16 of the last 24 years with five up more than 1%, while on expiration Friday it has dropped in 13 of those 24 years, down seven of the last nine years. Expiration week is down slightly more than half the time since 1990, but some of the losses have been steep (-2.6% in 1990, -2.3% in 1992, -4.2% in 1997, -4.0% in 2011, -2.2% in 2013 and -5.8% in 2015). The week after expiration is mildly stronger up 18 of the last 29.
| August Vital Stats (1950-2018) |
| |
DJI |
SP500 |
NASDAQ |
Russell
1K |
Russell 2K |
| Rank |
|
10 |
|
11 |
|
11 |
|
10 |
|
9 |
| #
Up |
|
39 |
|
38 |
|
27 |
|
25 |
|
23 |
| #
Down |
|
30 |
|
31 |
|
21 |
|
15 |
|
17 |
| Average
% |
|
-0.1 |
|
-0.04 |
|
0.3 |
|
0.3 |
|
0.3 |
| 4-Year Presidential Election Cycle Performance
by % |
| Post-Election |
|
-1.7 |
|
-1.4 |
|
-1.2 |
|
-1.4 |
|
-0.8 |
| Mid-Term |
|
-0.5 |
|
-0.2 |
|
-1.2 |
|
0.2 |
|
-1.3 |
| Pre-Election |
|
0.9 |
|
0.5 |
|
0.7 |
|
0.3 |
|
-0.0001 |
| Election |
|
0.7 |
|
0.9 |
|
2.7 |
|
2.0 |
|
3.3 |
| Best & Worst August by % |
| Best |
1982 |
11.5 |
1982 |
11.6 |
2000 |
11.7 |
1982 |
11.3 |
1984 |
11.5 |
| Worst |
1998 |
-15.1 |
1998 |
-14.6 |
1998 |
-19.9 |
1998 |
-15.1 |
1998 |
-19.5 |
| August Weeks by % |
| Best |
8/20/82 |
10.3 |
8/20/82 |
8.8 |
8/3/84 |
7.4 |
8/20/82 |
8.5 |
8/3/84 |
7.0 |
| Worst |
8/23/74 |
-6.1 |
8/5/11 |
-7.2 |
8/28/98 |
-8.8 |
8/5/11 |
-7.7 |
8/5/11 |
-10.3 |
| August Days by % |
| Best |
8/17/82 |
4.9 |
8/17/82 |
4.8 |
8/9/11 |
5.3 |
8/9/11 |
5.0 |
8/9/11 |
6.9 |
| Worst |
8/31/98 |
-6.4 |
8/31/98 |
-6.8 |
8/31/98 |
-8.6 |
8/8/11 |
-6.9 |
8/8/11 |
-8.9 |
| First Trading Day of Expiration Week: 1990-2018 |
| #Up-#Down |
|
19-10 |
|
22-7 |
|
24-5 |
|
23-6 |
|
21-8 |
| Streak |
|
D1 |
|
D1 |
|
D1 |
|
D1 |
|
D1 |
| Avg
% |
|
0.3 |
|
0.4 |
|
0.5 |
|
0.3 |
|
0.4 |
| Options Expiration Day: 1990-2018 |
| #Up-#Down |
|
12-17 |
|
13-16 |
|
14-15 |
|
14-15 |
|
14-15 |
| Streak |
|
U1 |
|
U1 |
|
U1 |
|
U1 |
|
U1 |
| Avg
% |
|
-0.3 |
|
-0.2 |
|
-0.3 |
|
-0.2 |
|
0.02 |
| Options Expiration Week: 1990-2018 |
| #Up-#Down |
|
13-16 |
|
16-13 |
|
17-12 |
|
16-13 |
|
19-10 |
| Streak |
|
U1 |
|
U1 |
|
D2 |
|
U1 |
|
U1 |
| Avg
% |
|
-0.4 |
|
-0.1 |
|
0.2 |
|
-0.1 |
|
0.3 |
| Week After Options Expiration: 1990-2018 |
| #Up-#Down |
|
18-11 |
|
20-9 |
|
19-10 |
|
20-9 |
|
20-9 |
| Streak |
|
U2 |
|
U2 |
|
U2 |
|
U2 |
|
U6 |
| Avg
% |
|
0.4 |
|
0.4 |
|
0.7 |
|
0.4 |
|
0.2 |
| August 2019 Bullish Days: Data 1998-2018 |
| |
14,
19, 28 |
15,
16, 19, 21, 28 |
14-16,
19, 21, 28 |
15,
16, 19, 21 |
14, 16, 21, 26, 28 |
| |
|
|
|
28,
30 |
|
| August 2019 Bearish Days: Data 1998-2018 |
| |
1,
12, 29 |
20,
29 |
2,
8, 20 |
29 |
2, 5, 8 |
| |
|
|
|
|
|
|
August 2019 Strategy Calendar
|
|
By:
Christopher Mistal
|
July 25, 2019
|
|
|
|
|
NASDAQ’s Best Eight Months Update
|
|
By:
Jeffrey A. Hirsch & Christopher Mistal
|
July 22, 2019
|
|
|
|
As of Friday’s close, the slower moving MACD “Sell” indicator applied to NASDAQ turned negative. At this time we are issuing our official MACD Seasonal Sell signal for NASDAQ.
NASDAQ’s “Best Eight Months” have come to an end. As a result, Sell iShares US Technology (IYW), iShares Russell 2000 (IWM) and PowerShares QQQ (QQQ). For tracking purposes, these positions will be closed out of the Sector Rotation and Tactical Switching Strategy ETF Portfolios using today’s closing price.
Also consider adding to existing positions in iShares 20+ Year Treasury Bond (TLT), iShares Core US Aggregate Bond (AGG) and Vanguard Total Bond Market (BND) on dips.
Suggested buy limits:
TLT - $131.70
AGG – $111.20
BND - $82.90
This NASDAQ Seasonal Sell Signal is a reminder to tighten stop losses and/or take profits on technology related positions as NASDAQ’s seasonally favorable period has come to an end. Russell 2000 exhibits a similar pattern to NASDAQ and small-cap positions could also be trimmed.
|
Stock Portfolio & NASDAQ’s MACD Updates: Adding Defense & Still on Hold
|
|
By:
Christopher Mistal
|
July 18, 2019
|
|
|
|
NASDAQ’s MACD Update
As of the market’s close today, the slower moving MACD indicator applied to NASDAQ remained positive by the slimmest of margins. Even with NASDAQ’s gain today, a one-day gain of 0.59% (48.29 points) would be needed to keep NASDAQ’s MACD Sell indicator positive. NASDAQ could make this move higher tomorrow and still not eclipse its previous all-time closing high, but NASDAQ would need to continue higher into record territory to further stave off its MACD indicator from turning negative. Because NASDAQ’s MACD indicator remains positive, we will continue to hold NASDAQ and small-cap related positions.
When NASDAQ’s MACD Sell indicator becomes negative, we will issue our NASDAQ Seasonal MACD Sell signal and begin clearing out remaining technology and small-cap positions held in the Almanac Investor ETF Portfolios. We will also review current holdings in the Stock Portfolio and act accordingly. Until that time, all technology and small-cap related positions in the portfolios are on Hold.
Stock Portfolio Updates
In the time since last update through yesterday’s close the Almanac Investor Stock Portfolio advanced 0.2% compared to a 2.0% gain by S&P 500 and a 0.3% loss from the Russell 2000. Compared to the S&P 500, overall performance was also held in check by a sizable cash position that currently represents 49.9% of the entire portfolio. Large-cap holdings contributed the bulk of the advance across the entire portfolio, advancing 0.9%. Small-caps also performed adding 0.2%. Mid-caps were the drag on the entire portfolio, slipping 0.2%.
Last month’s Defensive Basket of dividend paying stocks have been added to the portfolio table below. Eleven of the basket’s nineteen stocks have traded below their respective buy limits. Nine of these eleven are still active positions in the portfolio.
Medifast (MED) and
Energizer Holdings (ENR) were added on June 21 but were stopped out soon thereafter. ENR has subsequently bounced back while MED has continued to slip lower.
Of the nine active positions, five are higher and four are modestly lower. UnitedHealth (UNH), previously a holding is the portfolio, is the top performing new position, up 8.5%. With a gain of 7.7%, Bayer AG (BAYRY) is second best so far as of yesterday’s close. On the flip side, of the four new additions currently showing a modest lost, Vistra Energy (VST) is down the most, off 8.7%. That leaves eight positions from the basket that have yet to trade below their buy limits. All eight of these stock ideas can still be considered on dips.
As we await the arrival of NASDAQ’s Seasonal MACD Sell signal we will continue to maintain a neutral bias in the portfolios. Continue to Hold existing positions and limit new buying to positions with “Current Advice” of “Buy Dips” or “Buy.” Also consider taking some profits and take note of updated stop loss suggestions in the portfolio table below.
|
NASDAQ Seasonal MACD Update and ETF Trades: Tech Still Rising & Transports Slipping
|
|
By:
Christopher Mistal
|
July 11, 2019
|
|
|
|
As of the market’s close today, both the faster and slower moving MACD indicators applied to NASDAQ were positive. With NASDAQ’s modest decline today, a one-day decline of at least 2.33% (190.88 points) would be needed to turn NASDAQ’s MACD Sell indicator negative.
When NASDAQ’s MACD Sell indicator becomes negative, we will issue our NASDAQ Seasonal MACD Sell signal and begin clearing out remaining technology and small-cap positions held in the Almanac Investor ETF Portfolios. We will also review current holdings in the Stock Portfolio and act accordingly. Until that time, all technology and small-cap related positions in the portfolios are on Hold.
July Sector Seasonalities
Two new sector seasonalities begin in the month of July. First up is a bearish seasonality in Transports which typically begins in the middle of July and lasts until the middle of October. This seasonality is based upon the Dow Jones Transportation index (DJT). Over the last 5-, 10- and 15-year time periods DJT has declined 2.0%, 3.4% and 2.7% on average during this weak timeframe.
iShares Transportation (IYT) is a good choice to establish a short position in. IYT has just over $500 million in assets, has traded an average of over 150,000 shares per day over the past 20 trading days and has a reasonable 0.43% expense ratio. IYT’s top five holdings include: Norfolk Southern, Union Pacific, FedEx, Kansas City Southern and Landstar System.
Unlike DJIA or S&P 500, IYT has been struggling since peaking in late April. More recently, IYT is battling to remain above its declining 50- and 200-day moving averages. Stochastic, relative strength and MACD indicators are all neutral, but trending poorly. IYT could be shorted near resistance around $192.86 or a breakdown below $183.95. If shorted, set an initial stop loss at $200.50, this year’s high. If tit-for-tat tariffs spiral out of control and global trade activity continues to slow, transports are likely slip even further.
July’s second seasonality is from gold & silver mining stocks. This seasonality is based upon strength in the Philadelphia Gold & Silver index that typically begins in late July and lasts until late December. Over the last five years this trade has not been that successful however, over the last fifteen years the trade has averaged 7.8%. A three-pronged approach to this trade will be taken. In addition to a long position in VanEck Vectors Gold Miners (GDX) positions in SPDR Gold (GLD) and iShares Silver (SLV) are also suggested.
![[VanEck Vectors Gold Miners (GDX) Daily Bar Chart]](/UploadedImage/AIN_0819_20190711_GDX.jpg)
GDX is currently trading near multi-year highs due to strength in physical gold as the Fed has been signaling an end to it rate tightening cycle and the possible beginning of a new easing cycle. Lower rates are generally a negative for the U.S. dollar and have the potential to boost inflation. Both are generally viewed as a positive for gold and the stocks that mine it. GDX could be considered on dips below $25.50. If purchased an initial stop loss at $23.50 is suggested. Take profits if GDX trades above $26.92.
Physical gold and silver and the ETFs that hold them have strengthened as economic data has softened and further gained steam when the Fed shifted to a dovish tune. Strength during gold and silver’s typically weak June is further confirmation that stronger forces could be at work this year and above average performance from now to yearend is possible.
GLD could be considered on dips below a buy limit of $131.00. If purchased, set a stop loss at $127.00.
SLV could be considered near current levels with a buy limit of $14.10. If purchased, set a stop loss at $13.45.
Sector Rotation ETF Portfolio Updates
As the markets favorable period nears it end, the Sector Rotation ETF Portfolio has been thinning out. Positions established to capitalize on seasonal weakness in gold and/or silver did not pan out this time around. DB Gold Double Short (DZZ) and the short position in iShares Silver (SLV) were both stopped out on June 19.
Technology strength has persisted into July. iShares US Technology (IYW) was closed out when it traded above its auto-sell price on July 1 for a gain of 23.2% excluding trading costs and dividends.
Remaining positions in the portfolio are defensive in nature. XLP, XLV and XLU are on Hold.
Please see update portfolio table below for the most recent advice, buy limits and stop losses.
Tactical Seasonal Switching Strategy Updates
As it has been the situation since issuing our Seasonal MACD Sell Signal for DJIA and S&P 500, the Tactical Seasonal Switching portfolio is essentially neutral. Continue to Hold QQQ and IWM positions until when NASDAQ’s Seasonal MACD Sell Alert triggers. Defensive positions in bond ETFs, AGG, BND and TLT, are also on Hold as they have rallied nicely in anticipation of a Fed rate cut in the near future.
|
Seasonal Sector Trade: Second Half of July Troublesome for S&P 500 in Pre-election Years
|
|
By:
Christopher Mistal & Jeffrey A. Hirsch
|
July 11, 2019
|
|
|
|
Selling the September S&P 500 futures contract on or about July 15 and holding until on or about July 24 has a 56.8% success rate registering 21 wins against 16 losses in the last 37 years. The best win was $19,150 in 2002, and the worst loss was in 2009, posting a $12,650 bereavement. This trade had been successful in 13 of 15 years from 1990 to 2004. Since then it has nearly the opposite record, posting losses in 11 of 14 years from 2005-2018. However, in the last nine pre-election years this trade has been successful seven times. Losses were registered in 1983 and in 2011. In 2011, a longer holding period would have allowed the trade to turn profitable as S&P 500 dropped 16.8% from July 22, 2011 through August 8, 2011.
![[S&P Trade History Table]](/UploadedImage/AIN_0819_20190711_SP_History.jpg)
In recent years when this trade did not work, weakness did materialize however; it was not well aligned with the window defined by this trade. In some years weakness arrived early and was fleeting while in other years it was later and lasted into the early part of August. This year the setup is compelling as S&P 500 is struggling to breakout above 3000. Growth and earnings are slowing while the race for the White House in 2020 is beginning to heat up. Rate cut enthusiasm could also fade as quickly as it materialized.
![[S&P 500 (SP) Weekly Bars (Pit Plus Electronic Continuous contract) & Seasonal Pattern since 1982]](/UploadedImage/AIN_0819_20190711_SP_Seasonal.jpg)
Looking at the chart above, you will see the average price tendency is for a summer sell-off that usually begins in mid-July and lasts until mid-October (blue arrow). This trade targets the initial part of weakness (shaded yellow). Part of the reason is perhaps due to the fact that July starts the worst four months of the year for NASDAQ and also falls in the middle of the worst six months for DJIA and S&P 500. Mid-July is also when we typically kick off earnings season, where a strong early month rally can fade, as active traders may have “bought the rumor” or bought ahead on anticipation of good earnings expectations and then turn around and “sell the news” once it hits the street.
For the Almanac Investor Sector Rotation ETF Portfolio, our top choice to execute a trade based upon this seasonality is ProShares UltraShort S&P 500 (SDS). This trade is not for the faint at heart or those without the desire or ability to routinely monitor as SDS is leveraged two times the daily move of the S&P 500. This relationship can be seen in the following chart comparing SDPR S&P 500 (SPY) (daily bars) to SDS (solid black line). We will add SDS to the Sector Rotation ETF Portfolio if SPY trades back down below $295.00. Once added to the ETF Portfolio, a 3.5% trailing stop loss, based upon daily closing prices of SDS, is suggested.