|
Market at a Glance – July 23, 2026
|
|
By:
Christopher Mistal
|
July 23, 2026
|
|
|
|
Please take a moment and register for our members’ only webinar, August 2026 Outlook & Update on Wednesday July 29, 2026, at 4:00 PM EDT here:
Please join us for an Almanac Investor Member’s Only discussion of recent market action with time for Q & A at the end. Jeff and Chris will cover their outlook for August 2026, review the Tactical Seasonal Switching Strategy ETF, Sector Rotation ETF, and Stock Portfolio holdings and trades. We will also share assessments of the Iran war, economy, the Fed, inflation, geopolitical events, gold, copper, energy, and relevant updates to seasonals now in play.
If you are unable to attend the live event, please still register. Within a day of completion, we will send out an email with links to access the recording and the slides to everyone that registers.
After registering, you will receive a confirmation email containing information about joining the webinar and a reminder message.
Market at a Glance
7/23/2026: Dow 51711.65 | S&P 7408.30 | NASDAQ 25137.69 | Russell 2K 2940.16 | NYSE 23874.27 | Value Line Arith 13771.17
Seasonal: Bearish. August is the second worst DJIA, S&P 500, NASDAQ, Russell 1000 and Russell 2000 month over the last 38 years, 1988-2025 with average performance ranging from +0.1% by NASDAQ to a –0.7% loss by DJIA. In historically challenging midterm years, August’s average performance is even worse with losses ranging from –1.4% by NASDAQ and Russell 2000 to –0.2% by Russell 1000. In 2022, DJIA, S&P 500, NASDAQ, and Russell 1000 declined 4% or more.
Fundamental: Mixed. Latest inflation metrics, CPI and PPI, were better than anticipated with inflation cooling, but tensions are flaring again in the Middle East, and crude oil is rising once again threatening to reignite inflation. Economic growth also appears to be cooling despite massive AI spending. As of its July 17 update, the Atlanta Fed’s GDPNow model has Q2 growth at just 1.7%, a significant reduction from past estimates that were above 3%. Corporate earnings remain robust, but big AI spending is transferring earnings from one group of stocks to another. On the surface, the labor market appears to be holding up well with unemployment at 4.2% but the number of people not in the labor force has topped 105 million.
Technical: Rolling over? DJIA had ignored tech weakness and logged new all-time highs in June and early July but has pulled back since closing above 53,000 on July 6. After today’s decline, DJIA no longer has a sizeable cushion to its 50-day moving average and S&P 500 has fallen below its 50-day moving average. NASDAQ has the weakest chart, having fallen below its 50-day moving average and remaining below since July 16. Levels to watch are DJIA around 51,400, S&P 500 near 7,250 and NASDAQ 24,250
Monetary: 3.50 – 3.75%. Next week on July 28 & 29, Fed chairman Warsh will preside over his second FOMC meeting. As of 4:45 pm EDT on July 23, the
CME Group’s FedWatch Tool is showing the odds favor no change in interest rates at this meeting and we are inclined to agree. CPI and PPI did retreat when energy prices fell throughout May and June. But with crude oil prices surging again, market-based interest rates could force the Fed to act.
Sentiment: Nervous. According to
Investor’s Intelligence Advisors Sentiment survey Bullish advisors stand at 51.8%. Correction advisors are at 31.5% and Bearish advisors were 16.7% as of their July 22 release. Market headwinds are building, seasonal factors are weakening, and investors are on edge. Advisor sentiment confirms the concern with an increasing number of advisors anticipating a correction. However, the number of bearish advisors remains subdued which suggests that any market pullback or retreat is not likely to turn into a full-blown bear market.
|
August Outlook: Summer Correction & Midterm Weak Spot
|
|
By:
Jeffrey A. Hirsch & Christopher Mistal
|
July 23, 2026
|
|
|
|
This year’s mid-year rally came fast and furious. Most of NASDAQ’s Midyear Christmas in July Rally came on the last two trading days of June, gaining 3.6% over the two days after being down the first day of the rally. Stocks meandered for the next two weeks, gaining little ground though ticking a hair higher on July 10 before rolling over this week. For the full 12 days of the mid-year move NASDAQ was up 3.0% in line with the historical average.
NASDAQ’s Best 8 Months MACD Seasonal sell signal that triggered July 17 wasn’t perfect but looks like it may turn out to be rather timely as stocks continue to sell off this week, especially techs. Welcome to the summer selloff. We warned you about this last issue.
A convergence of geopolitical conflict, surging crude prices, and an overextended AI tech trade is colliding with rising interest rates to amplify the market’s traditional seasonal headwinds. 4-Year Cycle Midterm forces also appear to be reasserting themselves as hostilities between the U.S. and Iran heat up. This has driven energy prices and interest rates higher and stock prices lower.
It now looks like the Midterm Weak Spot Pattern is overtaking the Trump Presidency Years Cycle. When we identified the Trump Presidency Seasonal Cycle back in March, the usual midterm year Q2-Q3 Weak Spot got pulled forward into Q1 by the Iran War — in classic Trump Q1 shock-cycle fashion. Then the ceasefire rally drove the market to new highs.
Note the red 6th Year of Presidency (the second midterm year of a two-term president) and blue All Midterm Election Years lines. The pink 2026 line is trending lower after mid-year in a similar fashion. Our concern is that with the AI tech trade stretched, hostilities ramped up in the Mideast, the weakest two-month stretch (August/September) and the midterm elections just around the corner, the market is likely to be weaker over the next few months into September or October. If we continue to track the Midterm Years and 6th Years of Presidency, we should be primed to kick off the Sweet Spot of the 4-Year Cycle with a solid Q4 rally.
![[Trump August]](/UploadedImage/AIN_0826_20260723_Trump_August_900.jpg)
In the chart above we have pulled out August Market Performance just during Trump presidency years and his previous midterm year, 2018. Much better overall performance, but nothing new, really. Typical August trend with greater weakness the first half of August, much stronger second half. President Trump’s actions can knock the market down and he can just as quickly reverse course for another “TACO Trade.” However, it does seem like it is getting harder and harder for the administration to pause, end or resolve the Iran mess in some reasonable manner in short order. The chart is encouraging, but it does not seem likely to repeat this year given the headwinds that exist now.
![[DJIA technical chart]](/UploadedImage/AIN_0826_20260723_DJIA_Technical_900.jpg)
DJIA logged its sixth Down Friday/Down Monday (DF/DM) of 2026 earlier this week, and according to research in Stock Trader’s Almanac (page 78, 2026 edition), this is a market signal worth watching. When the Monday close was breached (as it was today, black arrow), subsequent performance was considerably weaker. Monday’s market action initially suggested that investors were willing to step back in and buy the dip, but that failed.
Was Turnaround Tuesday’s rally merely one of those typical short-term bounces that have historically followed many DF/DM signals? The bigger question is whether the market can bounce off today’s lows or breaks near-term support. Should DJIA break below its 50-day moving average (blue line) around 51400, the area in the yellow band between 49500 and 50000 is the next level of support. Just below that there is support around 48800 where the April 16/17 Israel-Lebanon ceasefire gap and the red 200-day moving average line converge.
If NASDAQ breaks below today’s lows near 25000 it is likely to fall to the next support level in the yellow band between 24000-24250, where the October 2025 highs, January 2026 highs, the Israel-Lebanon ceasefire gap and the red 200 DMA line converge.
S&P 500 has formed a symmetrical triangle off the June highs. The direction of this neutral continuation pattern is usually decided when it breaks out one way or another. It was on the brink of resolving lower at the close today. A break lower would first test the 7250-7300 level near the June lows and the early May gap before challenging the 7000-7100 level in the yellow band above the January 2026 highs and around the April 16/17 gap.
However, we do suspect this ends up being a typical summer correction to the near-term support levels in the charts. A 7%-8% move to S&P 7000-7100 would be an ordinary correction. It would also be the first one this market has had to digest such a correction since the March lows and the subsequent big rally to new all-time highs.
The 10-year yield hit a new 52-week high today. Odds are the Fed will not change interest rates at its meeting next week. But if crude prices remain elevated the market may force the Fed to raise rates. So, sit tight and ride out the summer midterm year Q3 correction, a fatter pitch is coming. We should be in a good position to jump into the Sweet Spot of the 4-Year Cycle with a solid Q4 rally by October.
Pulse of the Market
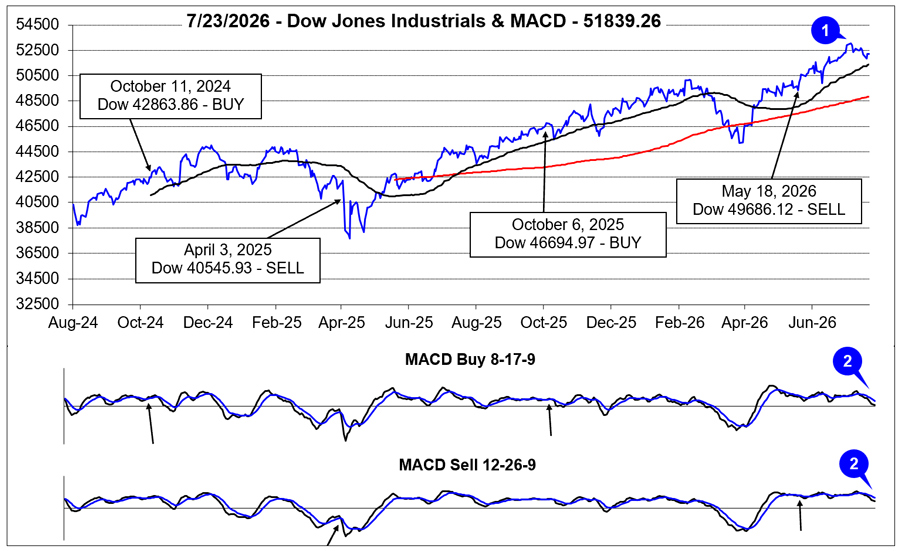
During this year’s mid-year rally, DJIA asserted its leadership by climbing to new all-time highs (1) that ultimately culminated on July 6 just above 53,000. S&P 500 and NASDAQ also participated in the mid-year rally, but they did not climb to new highs. As we noted in the July 2026 Outlook, second-half July weakness did materialize somewhat earlier this year in the form of choppy sideways trading shortly after the Independence Day holiday.
DJIA’s fading momentum after closing at new all-time highs in early July has been confirmed by both the faster and slower moving MACD indicators (2). Both MACD indicators turned negative on July 9, and have remained so since. Additional sideways-to-lower trading is likely as the worst two months of the year, August and September, are just around the corner. However, any meaningful pullback would likely push MACD indicators below the zero line, where buy signals tend to be the most reliable, setting them up for DJIA Seasonal MACD Buy signal sometime on or after October 1 and the official beginning of the Sweet Spot of the 4-year cycle (page 46 STA 2026).
Market headwinds strengthened further earlier this week when DJIA completed its sixth Down Friday/Down Monday (DF/DM) warning (3) (page 78, STA 2026) of 2026. After shedding over 700 points on Friday and Monday combined, DJIA did enjoy a rally on “Turnaround Tuesday.” But with DJIA closing below its Monday close, today, its odds of a quick recovery and renewed strength have fallen.
Previously mentioned second half of July weakness also arrived early for S&P 500 (4) and NASDAQ (5) with both recording a loss last week. Even with those losses last week, S&P 500 was up in 13 of last 16 weeks and NASDAQ was positive in 12 weeks since the end of March. Such strength would suggest some period of consolidation is not out of the question and it could be accelerating now.
Over the last five weeks, market breadth (6) has not been encouraging. In four of the five weeks, it was not as expected. There were two negative weeks where Weekly Advancers outnumbered Weekly Decliners and two positive weeks where Decliners outpaced Advancers. On the surface this would appear to suggest that a limited number of stocks continue to pull the broader indexes along with them. A deeper dive appears to suggest a seesaw battle of rotation where neither side can maintain the advantage for long. Regardless, mixed weekly breadth is consistent with consolidation, chop, and volatility. If weekly decliners take the lead and hold onto it, a more meaningful pullback is possible.
Looking at New 52-week Highs and Lows (7), we see a continuation of the mixed theme. New 52-week Highs have effectively done nothing since late April when they first broke above 300 while New 52-week Lows also remain range bound. Considering the market’s gain since late April, the relatively stagnant number of New 52-week Lows is not unusual or unexpected. The lack of expansion in new 52-week Highs, however, could be cause for some concern as it could mean the rally never really broadened out.
Renewed hostilities in the Mideast have and still are pushing crude oil higher which is pushing inflation expectations and Treasury bond yields higher. The 90-day Treasury bond yield (8) has reached its highest level since last November, just before the Fed cut rates in December. The 30-year Treasury bond yield has also moved to its highest level since May. Consumers and the stock market can likely tolerate modestly higher interest rates for a relatively brief time period but are likely to struggle if the trend remains higher for longer.
Click for larger graphic…
|
NASDAQ Seasonal MACD Update: Christmas in July has Ended
|
|
By:
Jeffrey A. Hirsch & Christopher Mistal
|
July 17, 2026
|
|
|
|
As of today’s close, the slower moving MACD “Sell” indicator applied to NASDAQ is negative. At the start of trading today, following Thursday’s loss, NASDAQ needed to gain at least 57.49 points (+0.22%) today to keep its MACD positive. That did not happen today. NASDAQ’s “Best Eight Months” has come to an end. We are now issuing our Seasonal MACD Sell signal for NASDAQ.
Sell Invescos QQQ (QQQ).
Sell iShares Russell 2000 (IWM).
For tracking purposes, these positions will be closed out of the Tactical Switching Strategy ETF Portfolio using their respective average prices on Monday, July 20.
Existing positions in TLT, AGG and BND on are Hold. Cash, money market, and/or short-duration bond ETFs like SHV and SGOV are likely to be the least risky during the remainder of the “Worst Months” this year. SHV and SGOV can be considered at current levels up to their respective buy limits.
As a reminder, traders/investors following the Best 6 + 4-Year Cycle switching strategy detailed on page 64 of the Stock Trader’s Almanac 2026 should heed this Seasonal Sell signal. Consider moving into our suggested bond ETFs and/or similar cash and cash equivalents.
Disclosure note: Officers of Hirsch Holdings Inc held positions in IWM, QQQ, SGOV, and TLT in personal accounts.
|
August Almanac & Vital Stats: No Reprieve in Midterm Years
|
|
By:
Jeffrey A. Hirsch & Christopher Mistal
|
July 16, 2026
|
|
|
|
[Editor’s note: You are receiving the August Almanac email Issue early in order to move the August Outlook Issue to next Thursday and then have the members’ only webinar on Wednesday, July 29. A registration link for the webinar will be included in next week’s issue, after the market’s close on July 23.]
Please join Jeff at the MoneyShow Masters Symposium in Las Vegas at Caesars Palace from July 19-22, 2026, as he kicks off the 60th Anniversary Edition tour for the 2027 Stock Trader’s Almanac. The Las Vegas Symposium will be four days of keynotes, workshops, live trading, and MoneyMasters Courses — all digging into transformative technologies, hard assets, income strategies, and alternatives. Not surface-level stuff. Real ideas, specific names, and up-to-date thinking on where the opportunity is in the second half of 2026 and beyond.
Plus, you’ll have a blast in Las Vegas doing it – with MoneyShow’s signature social and networking events waiting at every turn! If you want to be in the room when the conversation (and fun!) happens, I hope to see you there.
Please
register here or copy and paste this link into a browser window:
(https://lasvegasmms.moneyshow.com/?scode=067466)
More information and Jeff’s UPDATED schedule can be found at the bottom of this email.
NASDAQ Seasonal MACD Update
Even after today’s decline, NASDAQ’s Seasonal MACD remains positive. NASDAQ needs to advance 57.49 points (+0.22%) tomorrow, Friday, July 17, to keep its MACD (12-26-9) positive. Continue to hold associated positions in QQQ and IWM.
When NASDAQ’s Seasonal Sell signal criteria are met, we will send an email to all members. At that time, we will finish repositioning the Portfolios for the “Worst Months” and anticipate adding to some or possibly all of the existing bond ETFs and cash holdings in the Tactical Seasonal Switching Strategy portfolio. As a reminder, we use daily closing prices to calculate MACD. Any intraday signal does not apply.
The Iran/Hormuz conflict has evolved from a market shock into an active geopolitical risk backdrop. Renewed hostilities have lifted oil prices, stoked inflation concerns, and pressured stocks. The market appears increasingly desensitized to and willing to at least partially discount these flare-ups.
Energy remains the wild card, as any disruption that sends crude sharply higher could amplify the historically weak August-September period and the Midterm Year Q3 Weak Spot (page 46 STA 2026). But absent a significant energy-driven inflation shock, the current strategic stalemate supports our expectation for a typical late-summer pullback/correction that could set the stage for the Best Six Months and the favorable Sweet Spot of the four-year cycle that has historically begun in October.
August 2026 Almanac
Agriculture and farming made August a great stock market month in the first half of the Twentieth Century. It was the best DJIA month from 1901 to 1951. (See page 42 of the 2026 Almanac comparing the seasonal patterns of DJIA before and after 1950.) Now it is the second worst DJIA, S&P 500, NASDAQ, Russell 1000 and Russell 2000 month over the last 38 years, 1988-2025 with average performance ranging from +0.1% by NASDAQ to a –0.7% loss by DJIA. In 2022, DJIA, S&P 500, NASDAQ, and Russell 1000 all declined over 4% in August and in 2023 they declined 1.8% or more.
Contributing to this poor performance since 1988 was the second shortest bear market in history (45 days) caused by turmoil in Russia, the Asian currency crisis and the Long-Term Capital Management hedge fund debacle ending August 31, 1998, with the DJIA shedding 6.4% that day. DJIA dropped 1344.22 points for the month, off 15.1%—which is the second worst monthly percentage DJIA loss since 1950. Saddam Hussein triggered a 10.0% slide in August 1990. The best DJIA gains occurred in 1982 (11.5%) and 1984 (9.8%) as bear markets ended. Additional recent DJIA August losses in excess of 4% were in 2010, 2011, 2013, and 2015.
![[Midterm Year August Table]](/UploadedImage/AIN_0826_20260716_Midterm_August_Mini_table.jpg)
In midterm years since 1950, Augusts’ rankings improve ever so slightly: #10 DJIA and NASDAQ (since 1974), #9 S&P 500 and Russell 2000 (since 1982), and #8 Russell 1000 (since 1982). Average losses range from –0.2% for Russell 1000 to –1.4% by NASDAQ and Russell 2000. All five indexes have winning track records, more gains than losses, but losses have frequently been substantially larger than gains. DJIA and NASDAQ suffered double-digit losses in 1974, 1990 and 1998. Midterm Augusts have tended to either post a modest gain or be brutally lower.
Historically, the first eight or nine trading days of the month have exhibited weakness while mid- and late month have been somewhat better. In midterm years, August has tended to open weaker with losses accumulating until around the ninth trading day before reversing and surging until shortly after mid-month. At which point, a bounce of varying magnitude and duration occurred before the major indexes slipped again to sink through the end of the month.
On Monday of monthly options expiration NASDAQ has been up 26 of the last 33 years with ten days up more than 1%. Monthly expiration Friday has improved recently, up 15 of the last 23 years and up 7 of the last 8. In monthly expiration week, DJIA is down 21 times in 36 years since 1990, with some sizable losses; –2.6% in 1990, –2.3% in 1992, –4.2% in 1997, –4.0% in 2011, –2.2% in 2013, –5.8% in 2015, and –2.2% in 2023. The week after expiration has been stronger, DJIA up 22 of the last 35.
A New Age of Investing and Trading in Transformative Technologies
Let's be honest — the last few years were almost too easy if you were holding the right AI and Big Tech names. But that trade has gotten a lot more complicated.
We're hearing more questions about the AI boom – and we’re seeing real rotation now. Money is starting to move out of last year's darlings and into places that felt “boring” 18 months ago — industrials, energy, value, income. The major indices are still near all-time highs, and Wall Street's long-term outlook for stocks hasn't fallen apart. But what's working underneath the surface looks very different now.
On top of that, the Fed may not be done being restrictive, inflation hasn't gone away quietly, and geopolitical flare-ups keep popping up – putting oil, commodities, and real assets squarely into any market conversation.
Bottom line: This is a market where active allocation and real risk management actually matter again. That's a big part of why Jeff is looking forward to speaking at the
2026 MoneyShow Masters Symposium in Las Vegas, scheduled for July 19–22 at Caesars Palace.
Please
register here or copy and paste this link into a browser window:
(https://lasvegasmms.moneyshow.com/?scode=067466)
Jeff’s speaking schedule:
Sunday, July 19, 2026, at 2:30 pm - 2:55 pm PDT (Pre-Show Keynote)
The AI Super Boom: How to Ride the Next Leg of the Secular Bull
Monday, July 20, 2026, at 4:55 pm - 5:40 pm PDT (Workshop)
What Six Decades of Market History Tell Us About the Next 15
Tuesday, July 21, 2026, at 9:25 am - 9:55 am PDT (Keynote Panel)
The Stocks and ETFs You Can’t - and Shouldn’t – Live Without
Tuesday, July 21, 2026, at 3:45 pm – 4:30 pm PDT (Workshop)
Hot Stocks and Sectors for the Summer Doldrums
Meet Jeff in Las Vegas and join the 2027 Stock Trader’s Almanac 60th Anniversary Edition tour kickoff.
|
August 2026 Strategy Calendar
|
|
By:
Christopher Mistal
|
July 16, 2026
|
|
|
|
|
NASDAQ MACD & Stock Portfolio Updates: Midyear Rally Resumes
|
|
By:
Christopher Mistal
|
July 09, 2026
|
|
|
|
NASDAQ’s annual “Christmas in July” Midyear Rally, defined as the last three trading days of June through the first nine trading days of July, is nearing its conclusion, and 2026 has largely followed the script. After a powerful advance into late June, the rally did pause as traders locked in gains, digested fresh economic data and reacted to the latest headlines. As of today’s close, July 9, NASDAQ has advanced 3.35% with three trading days to go.
![[NASDAQ Midyear Rally Chart]](/UploadedImage/AIN_0826_20260709_NASDAQ_Midyear_Rally_Chart.jpg)
While the final outcome remains to be seen, the recent consolidation is not unusual and fits the historical tendency for the rally to experience brief interruptions before a final push. Since 1985, this 12-trading-day seasonal window has produced an average gain of 2.5% and finished higher in roughly four out of every five years, making it one of NASDAQ's most consistent seasonal patterns. Whether the rally can finish with another burst higher or begins to fade into the typical second-half summer lull will likely set the tone for the balance of July.
NASDAQ Seasonal MACD Update
NASDAQ’s Seasonal MACD indicator entered June in negative territory and remained there until today. As of today’s close, it is positive. Currently NASDAQ would need to decline at least 342.20 points (–1.31%) in a single day to turn its MACD (12-26-9) negative. Continue to hold associated positions in QQQ and IWM.
When NASDAQ’s Seasonal Sell signal criteria are satisfied, we will send an email to all members. As a reminder, we use daily closing prices to calculate MACD. Any intraday signal does not apply. At that time, we will finish repositioning the Portfolios for the “Worst Months” and anticipate adding to some or possibly all of the existing bond ETFs and cash holdings in the Tactical Seasonal Switching Strategy portfolio.
Stock Portfolio Updates
Over the past five weeks, through the close on July 8, the Almanac Investor Stock Portfolio crept 0.1% higher, excluding dividends and any potential interest generated by the cash position, compared to a 0.9% decline by S&P 500 and a 2.2% increase by Russell 2000 over the same time. Small-cap positions were the biggest drag on the portfolio, down 7.1% as HealWell AI (HWAIF) slipped back below $0.60 per share. Large caps were best, advancing 4.8%, boosted by broad, modest gains from its numerous defensive-sector holdings.
HWAIF is still on Hold. Aside from its annual meeting, which was primarily administrative, the other recent news of note was the announcement that it completed a pilot of its DARWEN-powered SMART Summary and SMART Search AI tools with positive results and an indirect SpaceX stake that was estimated to be valued at around CAD$25 million. A stronger balance sheet and progress with its AI tools are encouraging steps in the right direction but more is still needed.
StoneX Group (SNEX) will complete a three-for-two split after the market’s close on July 17, 2026, and is expected to begin trading split-adjusted when the market opens on July 20. Each shareholder will receive one share for every two that they held on July 7 with fractional shares being paid in cash. After the split, SNEX stop loss should be adjusted by dividing it by 1.5. Its stop loss of $98.64 now, it will be $65.76 on July 20. SNEX is on Hold.
Super Micro Computer (SMCI) was hit hard in June. Shares had rallied to over $50 early in the month but quickly reversed after SMCI sold $7 billion in equity and export-control issues surfaced. Quarterly earnings have been strong, but investor confidence is not given the company’s spotty history. The position in the portfolio is all that remains after taking profits twice, once when it first doubled and then a second time when it was trading over $90 per share. SMCI is on Hold.
The utility sector stocks that were
presented on March 12, 2026, have improved since last update. All seven were up on average 1.3% as of July 8 excluding any dividends and trading costs.
Dominion Energy (D) is the top performer, up 11.7% followed by
Entergy (ETR) with an 8.8% gain.
These large-cap utility trades were presented for two main reasons; the sector has a track record of performing during the “Worst Months” and because of rising energy demand from data centers. Both of these reasons remain valid. AEP, D, and ETR can still be considered on dips below their respective buy limits. DUK, EXC, NEE, and SO can be considered at current levels up to their respective buy limits.
All positions from the
June 11, 2026, Dividend Stock Basket appear in the Stock Portfolio below. Eight of the ten positions did trade below their buy limits.
Energizer Holdings (ENR) and
Newell Brands (NWL) have not yet traded below their buy limits.
The dividend basket has gotten off to a relatively solid start with six of eight positive as of July 8 and an average gain of 2.2% across all eight positions held. PepsiCo (PEP) did have a tough day today, down over 3%, after reporting quarterly earnings. Today’s retreat on what looks like a 1 cent miss on earnings is likely overdone given the 6.4% increase in net revenue. PEP can be considered at current levels.
ENR, PRGO, NWL, CPB, SJM, MKC, HRL, KHC, KVUE and MO can all be considered at current levels or on dips below their respective buy limits.
All other positions not previously mentioned in the portfolio are on Hold. Please note some stop losses have been updated to account for recent moves.
Disclosure note: Officers of Hirsch Holdings Inc. held positions in AROC, HWAIF, SMCI, and SNEX in personal accounts.
|
ETF Portfolios & NASDAQ MACD Update: Metals, Mining, & Holding
|
|
By:
Christopher Mistal
|
July 02, 2026
|
|
|
|
Key takeaways from the webinar are NASDAQ’s Midyear rally is underway, it has struggled the past couple of sessions, but strength usually runs until around mid-July. This rally is likely to provide the setup for NASDAQ’s Seasonal MACD Sell Signal and time to review positions, take profits and consider rotating into other positions for the balance of the “Worst Months.”
Iran, inflation, and stretched valuations in some sectors of the market are still market headwinds. Midterm election uncertainty is also likely to begin to grow in August, September, and October. Collectively or individually, these could easily be the catalyst for a typical midterm-year “Weak Spot” (page 46 STA 2026) market pullback.
NASDAQ Seasonal MACD Update
As of the close today, July 2, NASDAQ’s Seasonal MACD indicator remains negative. The criteria we use to issue our NASDAQ Seasonal MACD sell is a new negative crossover of MACD (using 12-26-9 parameters) on or after the first trading day in June. It would currently take a one-trading-day NASDAQ advance of 488.81 points (+1.89%) for NASDAQ’s MACD indicator to turn positive. Continue to hold associated positions in QQQ and IWM.
When NASDAQ’s Seasonal MACD registers a new negative crossover, we will send an email to all active members. At that time, we will finish repositioning our Portfolios for the “Worst Months.” We do anticipate adding to existing bond ETF and cash holdings in the Tactical Seasonal Switching Strategy portfolio.
July Sector Seasonalities
Three new sector seasonalities begin in the month of July. Bearish seasonalities for Industrials and Transports have historically begun around mid-July and lasted until around the middle of October. Technically, both sectors currently look strong with corresponding strength in iShares DJ Transports (IYT) and SPDR Industrials (XLI). Higher energy costs had been a drag in Q2, but now that crude oil has retreated, both sectors have broken out. At this time, we are going to pass on trading these bearish seasonalities. Should either begin to falter, we may consider a trade at that time.
July’s final new seasonality is for gold & silver mining stocks. This seasonality is based upon strength in the Philadelphia Gold & Silver index (XAU) that typically begins in late July and lasts until late December. Over the past 10 years, XAU has gained on average 11.07% and more recently in the last 5 years it has averaged 20.23%. After trading well over $5000 per ounce earlier this year, gold retreated to less than $4000 in late June and appears to be setting up for a typical seasonal low now. Silver’s decline this year has been even more substantial going from over $120 per ounce to less than $60 last week.
VanEck Gold Miners (GDX) is our preferred ETF to take advantage of seasonal strength in gold and silver miners. As of the close on July 1, GDX had over $22 billion in assets with a net expense ratio of 0.51%. Top five holdings of GDX include: Agnico Eagle Mines, Newmont, Barrick Mining, Wheaton Precious Metals, and Anglogold Ashanti.
Year-to-date, GDX was down –12.7% as of its July 1 close. It’s 50-day moving average crossed below its 200-day moving average in late-June, forming a historically bearish “death cross.” Our research has shown that the typically the majority of the decline has occurred by the time a death cross occurs. Stochastic, relative strength and MACD indicators are all at or near oversold levels but could turn the corner soon as GDX appears to have found support and begun to move higher. GDX can be considered at current levels up to a buy limit of $79.70. If purchased, set an initial stop loss at $69.05 and an auto sell at $106.23.
![[SPDR Gold (GLD) Daily Bar Chart]](/UploadedImage/AIN_0826_20260702_GLD_Chart.jpg)
Next, we will also look to establish a position in SPDR Gold (GLD). Like the miners, physical gold was also higher today and its chart is similar to GDX. Bouncing higher off of late June lows, and a recent death cross, but with slightly better Stochastic, relative strength, and MACD indicators. GLD can be considered at current levels up to a buy limit of $382.05. If purchased, consider a stop loss at $349.25. There is no auto-sell price at this time.
VanEck Junior Gold Miners (GDXJ) is the small-cap version of GDX. The holdings of GDXJ are generally smaller market cap and early-stage miners. GDXJ has over $7 billion in assets and an expense ratio of 0.52%. Top five holdings are: Equinox Gold, Alamos Gold, Evolution Mining, Endeavour Mining, and Coeur Mining. GDXJ can be considered at current levels up to a buy limit of $103.65. If purchased, set an initial stop loss at $88.70 and an auto sell at $138.15.
![[iShares Silver (SLV) Daily Bar Chart]](/UploadedImage/AIN_0825_20250702_SLV.jpg)
Lastly, we will consider a position in iShares Silver (SLV). In recent years, silver has generally followed the trend set by gold with additional volatility and larger price swings. SLV’s chart is similar to gold with larger price swings. SLV also appears to have found support and appears to be in the early stages of a new rally. Technical indicators are showing early signs of improvement. SLV can be considered at current levels up to a buy limit of $57.65. If purchased a stop loss of $47.85 is suggested. Like GLD, there is no auto-sell price at this time.
For tracking purposes, GDX, GLD, GDXJ, and SLV will all be added to the Sector Rotation ETF Portfolio using their respective average prices on Monday, July 6.
Sector Rotation ETF Portfolio Updates
Five sector seasonalities come to an end in July but there are no associated positions currently held in the Sector Rotation ETF portfolio. They are Oil (Long), Info Tech (Long), Computer Tech (Long), Banking (Short), and Natural Gas (Short). XLE was closed out in April, IYW ran away and was not added to the portfolio. Short trades associated with banking and natural gas sectors were not selected due to corresponding strength in both.
“Worst Months” defensive positions in SPDR Consumer Staples (XLP) and SPDR Utilities (XLU) can still be considered on dips or at current levels up to their respective buy limits. Results from XLU and XLP have been mixed recently as Fed interest rate policy appears to be in a state of flux due to the recent resurgence in inflation metrics. Historically, higher rates have been a headwind for XLP and XLU. The recent decline in crude oil prices should begin to moderate inflation and potentially put the Fed back on track for lower interest rates. Lower rates would likely be solid tailwinds for XLP and XLU.
In accordance with the last ETF Portfolio update, Invesco DB Agriculture Fund (DBA) was sold and closed out of the portfolio on May 29 at $27.37 for a meager 1.4% gain. DBA could be the perfect example of where too much diversification is not good for investment returns. Fourteen different commodity holdings don’t always move in the same direction.
First Trust Natural Gas (FCG) and United States Natural Gas (UNG) were stopped out of the portfolio in early June after closing below their respective 2% trailing stop losses. FCG’s exposure to crude oil helped it avoid a loss while UNG declined 7.1%.
Healthcare and biotech positions, XLV, IBB, and XBI all surged in June and were up an average of 14.0% at the close on July 1. XLV, IBB, and XBI are on Hold.
IDV, EFAV, EFV are on Hold.
Tactical Seasonal Switching Strategy Portfolio Update
Continue to Hold QQQ and IWM. NASDAQ’s Seasonal MACD Sell Signal has NOT triggered.
Defensive positions in bond ETFs, TLT, AGG, BND, SHV and SGOV, are still flat to slightly negative excluding dividends and any trading fees. TLT, AGG and BND are on Hold. The performance of TLT, AGG and BND will likely depend greatly upon the direction of inflation metrics and the Fed. Our preferred bond ETFs are SHV and SGOV as both exhibit relatively stable pricing and have yields above 3%. We will consider adding to SHV and SGOV positions when NASDAQ’s Seasonal Sell signal triggers, but they can be considered at current levels up to their respective buy limits.
Disclosure note: Officers of Hirsch Holdings Inc hold positions in EFAV, EFV, IBB, IDV, IWM, QQQ, SGOV, TLT, TQQQ, XBI, XLP, XLU and XLV in personal accounts.