|
September 2018 Trading & Investment Strategy
|
|
By:
|
August 23, 2018
|
|
|
|
|
September Outlook: Worst Month Often Bucks Bulls Off Easy Ride
|
|
By:
Jeffrey A. Hirsch & Christopher Mistal
|
August 16, 2018
|
|
|
|
While we are naturally concerned about the market’s lofty levels, climbing bullish sentiment and the seasonally bearish tendencies of September, we expect the market to continue on its bullish trajectory save for a dip toward the end of August and then again at the end of Q3 and early October. The market will eventually selloff, but we don’t expect any major decline or bear market until next year.
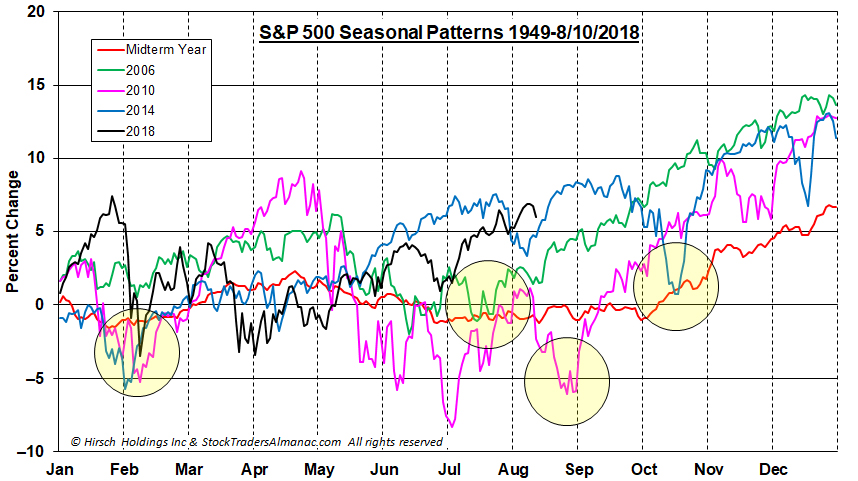
Midterm years are notoriously a rough year for markets as presidents push through their most disruptive policy initiatives and battle the opposition party to retain congressional seats. But the last three midterm years, 2006, 2010 and 2014 have been strong followed by troubled pre-election years. 2007 brought us the major top of the Financial Crisis with the S&P up 3.5%. 2011 suffered a mini-bear from April to October that shaved 19.4% off the S&P, which ended the year down a fraction -0.003%. Another mini-bear transpired in 2015 with the S&P losing 14.2% from May 2015 to February 2016. The S&P finished 2015 off -0.7% for the year.
From the chart below comparing 2018 to the previous three midterm years 2006, 2010 and 2014, it looks like we are setting up for above average midterm year market gains again followed by a weaker pre-election year prone to a bear market and a recession. Encircled in yellow, all four years suffered early-year declines in January/February. Looking forward from here the previous three midterm years had pullbacks that ended in July or August or September/October as was the case in 2014.
Contagion from the economic, currency and political crisis in Turkey has not spread as of yet, but we are reminded of the 1997-98 currency crisis that started with the Thai baht meltdown in July 1997 and then spilled over into other Asian currencies in the fall of 1997. But it wasn’t until August 1998 when additional pressure from the Russian financial crisis caused the collapse of hedge fund behemoth Long Term Capital Management that had to be bailed out by Wall Street banks under the supervision of the Federal Reserve to prevent a deeper crisis.
Earnings season is winding down and has been well above estimates, again. This has buoyed the market, but the advance/decline lines are not robust, and traders and investors are complacent. VIX is back down under 14 today.
Investors Intelligence Advisors Sentiment has bulls back up to 57.3% vs. 18.4% bears, pushing the spread close to the danger zone. Weekly CBOE Equity-Only Put/Call ratio remains sanguine at 0.64.
This sets up the market for possible retracement of recent gains. But without a meaningful retreat or pullback, the Q4 rally could be muted and make us more vulnerable to an early 2019 top. Earnings comparisons will be much more challenging next year and tax cut and fiscal stimulus effects will begin to fade.
The wall of worry is not that tall. There is not much left to climb. Nothing negative has yet to stick to this White House and now it is reported that China is coming to visit later this month for renewed trade talks. China seems to be in trouble with the tariffs, the yuan has been slipping and the Shanghai composite is down 17% YTD.
The bottom line right now, whether you like it or not, is that President Trump’s “Art of the Deal” policies are trumping bearish seasonality. Everyone has been on the weak August seasonality bandwagon for some time and that trade is a little too crowded right now for any bear to emerge. The biggest midterm election surprise would be for the Republicans to not lose a bunch of seats. The Fed will most likely hike rates again in September. The Fed is still the big concern.
Pulse of the Market
DJIA’s “Hot July” (+4.7%) extended until its recent peak on August 6. Since that time, DJIA has been struggling to find traction and regain positive momentum. Prior to today’s gain, DJIA’s trend had it on course back towards and likely below its 50- and 200-day moving averages (1) where it has spent much of this year. Both the faster and slower moving MACD indicators applied to DJIA are currently negative (2) confirming the shift in momentum.
Over the last three weeks, DJIA has gone on to log two additional Down Friday/ Down Monday (DF/DM) warnings (3). The last time DJIA had a cluster of DF/DM like this (three in four weeks) began in March 2017. DJIA, S&P 500 and NASDAQ all slipped lower during the following two weeks, but then resumed their march higher as deregulation and expectations for corporate tax cuts buoyed earnings forecasts. However, the three out of four DF/DM cluster in May 2015 ultimately marked the start of a mini-bear market that lasted until February 2016.
Until last week, DJIA and S&P 500 (4) had logged five straight weekly gains. NASDAQ (5) did not participate in the streak. Divergences like this are not entirely bearish, but they also are not all that bullish.
Market breath has remained mixed with NYSE Weekly Advancers out numbering NYSE Weekly Decliners in just two of the last five weeks (6). Last week’s slightly negative breadth was accompanied by a minor NASDAQ gain and six weeks ago all three indexes advanced solidly, but breadth was negative. Weekly New Highs and New Lows (7) continue to fluctuate with no clear trend for any meaningful duration of time. Expanding numbers of New Highs and shrinking number of New Lows is usually the trend of a healthy bull market.
30-year Treasury bond yields (8) have bounced back above 3% after spending four weeks below it and the 90-day Treasury climbed above 2% last week for the first time since February 2008. 2% is still low, but after spending more than a decade below that level it could still be an issue especially if the yield curve continues to flatten.
Click image to view full size…
|
Market at a Glance - 8/16/2018
|
|
By:
Christopher Mistal
|
August 16, 2018
|
|
|
|
8/15/2018: Dow 25162.41 | S&P 2818.37 | NASDAQ 7774.12 | Russell 2K 1670.67 | NYSE 12723.09 | Value Line Arith 6407.87
Psychological: Resolute. Turkey, Chinese growth, tariffs, etc. are not derailing the market or traders and investors. According to
Investor’s Intelligence Advisors Sentiment survey bulls are at 57.3%. Correction advisors are modestly lower at 24.3% and Bearish advisors are just 18.4%. The difference between bulls and bears remains at a cautious level that leaves room for further gains, but it also does not completely rule the possibility of a rough patch.
Fundamental: Firm. U.S. unemployment ticked back to 3.9% earlier this month. Atlanta Fed GDPNow model is currently forecasting Q3 growth of 4.3%. This follows a 4.1% reading for Q2 which was the best pace of growth in nearly four years. Biggest headwinds to growth are the Fed, additional tariffs and a stronger U.S. dollar. Thus far there impact has been limited.
Technical: Divergent. Major indexes have been marching to their own beat since dropping in late-January/early-February. DJIA is furthest from its last all-time closing high reached in January. S&P 500 is in second place, closer to its old high, but also dating back to January. The Russell 2000 had its run that ran out of gas in June. NASDAQ was recently at new all-time highs in July, but has struggled since. Advance/Decline lines for NASDAQ and Russell 2000 peaked in early July. S&P 500 and NYSE continued to climb into early August. Any attempt at new all-time highs by a single index is likely to be short-lived until participation broadens.
Monetary: 1.75-2.00%. The Fed’s next meeting will end on September 26 and the current probability of a rate increase at this meeting is 96.0% according to CME Group’s FedWatch Tool as of August 16. At some point the combination of higher rates and a shrinking Fed balance sheet will begin to effect growth and the market. What level is open to debate, best guess would be somewhere around a 3% to 3.5% Fed funds rate could begin doing harm.
Seasonal: Bearish. September is the worst performing month of the year for DJIA, S&P 500, NASDAQ (since 1971), Russell 1000 and Russell 2000 (since 1979). In midterm years going back to 1950, average losses widen for DJIA (–1.0%), NASDAQ (–0.8%), Russell 1000 (–1.1%) and Russell 2000 (–0.6%). S&P 500’s average September loss improves slightly from –0.5% to –0.4% in midterm years.
|
September Almanac: Worst Month of the Year since 1950
|
|
By:
Christopher Mistal & Jeffrey A. Hirsch
|
August 23, 2018
|
|
|
|
Since 1950, September is the worst performing month of the year for DJIA, S&P 500, NASDAQ (since 1971), Russell 1000 and Russell 2000 (since 1979). September was creamed four years straight from 1999-2002 after four solid years from 1995-1998 during the dot.com bubble madness. Although September’s overall rank improves modestly in midterm years going back to 1950, average losses widen for DJIA (–1.0%), NASDAQ (–0.8%), Russell 1000 (–1.1%) and Russell 2000 (–0.6%). S&P 500’s average September loss improves slightly from –0.5% to –0.4% in midterm years. Although September 2002 does influence the average declines, the fact remains DJIA has declined in 11 of the last 17 midterm-year Septembers.
![[Midterm September Performance Table]](/UploadedImage/AIN_0918_20180823_Midterm_September_Table.jpg)
The month has opened strong in 14 of the last 23 years (a fading trend as S&P 500 has been down five of the last seven first trading days), but as tans begin to fade and the new school year commences, fund managers tend to clean house as the end of the third quarter approaches, causing some nasty selloffs near month-end over the years. Recent substantial declines occurred following the terrorist attacks in 2001 (DJIA: –11.1%), 2002 (DJIA –12.4%), the collapse of Lehman Brothers in 2008 (DJIA: –6.0%) and U.S. debt ceiling debacle in 2011 (DJIA –6.0%).
September Triple Witching week is generally bullish with S&P 500 advancing twice as many times as declining since 1990, but is has suffered some sizable losses. Triple-Witching Friday was essentially a sure bet for the bulls from 2004 to 2011, but has been a loser four or five of the last six years, depending on index. The week after Triple Witching has been brutal, down 22 of the last 28, averaging an S&P 500 loss of 1.0%. In 2011, DJIA and S&P 500 both lost in excess of 6%. The week after was positive in 2016 and 2017.
In recent years, Labor Day has become the unofficial end of summer and the three-day weekend has become prime vacation time for many. Business activity ahead of the holiday was more energetic in the old days. From 1950 through 1977 the three days before Labor Day pushed the DJIA higher in twenty-five of twenty-eight years. Bullishness has since shifted to favor the two days after the holiday as opposed to the days before. DJIA has gained in 16 of the last 24 Tuesdays and 17 of the last 23 Wednesdays following Labor Day.
| September (1950-2017) |
| |
DJI |
SP500 |
NASDAQ |
Russell
1K |
Russell 2K |
| Rank |
|
12 |
|
12 |
|
12 |
|
12 |
|
12 |
| #
Up |
|
27 |
|
30 |
|
26 |
|
19 |
|
22 |
| #
Down |
|
41 |
|
37 |
|
21 |
|
20 |
|
17 |
| Average
% |
|
-0.7 |
|
-0.5 |
|
-0.5 |
|
-0.6 |
|
-0.4 |
| 4-Year Presidential Election Cycle Performance
by % |
| Post-Election |
|
-0.5 |
|
-0.5 |
|
-0.2 |
|
-0.5 |
|
-0.04 |
| Mid-Term |
|
-1.0 |
|
-0.4 |
|
-0.8 |
|
-1.1 |
|
-0.6 |
| Pre-Election |
|
-1.0 |
|
-0.9 |
|
-0.9 |
|
-1.0 |
|
-1.6 |
| Election |
|
-0.4 |
|
-0.2 |
|
-0.04 |
|
0.2 |
|
0.8 |
| Best & Worst September by % |
| Best |
2010 |
7.7 |
2010 |
8.8 |
1998 |
13.0 |
2010 |
9.0 |
2010 |
12.3 |
| Worst |
2002 |
-12.4 |
1974 |
-11.9 |
2001 |
-17.0 |
2002 |
-10.9 |
2001 |
-13.6 |
| September Weeks by % |
| Best |
9/28/01 |
7.4 |
9/28/01 |
7.8 |
9/16/11 |
6.3 |
9/28/01 |
7.6 |
9/28/01 |
6.9 |
| Worst |
9/21/01 |
-14.3 |
9/21/01 |
-11.6 |
9/21/01 |
-16.1 |
9/21/01 |
-11.7 |
9/21/01 |
-14.0 |
| September Days by % |
| Best |
9/8/98 |
5.0 |
9/30/08 |
5.4 |
9/8/98 |
6.0 |
9/30/08 |
5.3 |
9/18/08 |
7.0 |
| Worst |
9/17/01 |
-7.1 |
9/29/08 |
-8.8 |
9/29/08 |
-9.1 |
9/29/08 |
-8.7 |
9/29/08 |
-6.7 |
| First Trading Day of Expiration Week: 1990-2017 |
| #Up-#Down |
|
19-9 |
|
16-12 |
|
12-16 |
|
16-12 |
|
13-15 |
| Streak |
|
U2 |
|
U2 |
|
U2 |
|
U2 |
|
U2 |
| Avg
% |
|
-0.04 |
|
-0.1 |
|
-0.3 |
|
-0.1 |
|
-0.2 |
| Options Expiration Day: 1990-2017 |
| #Up-#Down |
|
15-13 |
|
16-12 |
|
18-10 |
|
17-11 |
|
19-9 |
| Streak |
|
U1 |
|
U1 |
|
U1 |
|
U1 |
|
U1 |
| Avg
% |
|
0.02 |
|
0.1 |
|
0.1 |
|
0.1 |
|
0.2 |
| Options Expiration Week: 1990-2017 |
| #Up-#Down |
|
17-11 |
|
19-9 |
|
19-9 |
|
19-9 |
|
18-10 |
| Streak |
|
U2 |
|
U2 |
|
U5 |
|
U2 |
|
U3 |
| Avg
% |
|
0.08 |
|
0.3 |
|
0.2 |
|
0.2 |
|
0.4 |
| Week After Options Expiration: 1990-2017 |
| #Up-#Down |
|
7-21 |
|
6-22 |
|
10-18 |
|
7-21 |
|
9-19 |
| Streak |
|
U2 |
|
U2 |
|
D1 |
|
U2 |
|
U2 |
| Avg
% |
|
-1.0 |
|
-1.0 |
|
-1.0 |
|
-1.0 |
|
-1.4 |
| September 2018 Bullish Days: Data 1997-2017 |
| |
5,
10, 12, 18 |
12,
13, 18, 26, 27 |
4,
12-14, 18 |
4,
12, 13, 18 |
4, 7, 12, 13 |
| |
20,
26 |
|
|
26,
27 |
18, 27 |
| September 2018 Bearish Days: Data 1997-2017 |
| |
7,
24, 28 |
24,
28 |
17,
24, 28 |
24,
28 |
25 |
| |
|
|
|
|
|
|
September 2018 Strategy Calendar
|
|
By:
Christopher Mistal
|
August 23, 2018
|
|
|
|
|
Stock Portfolio Update: Defensive Basket Outperforms
|
|
By:
Christopher Mistal
|
August 09, 2018
|
|
|
|
NASDAQ just successfully extended its daily winning streak to eight consecutive days. DJIA, S&P 500 and Russell 2000 have not been as strong over the same period. On the surface NASDAQ’s strength is impressive, but it still has failed to eclipse its recent all-time closing high from July 25. And based upon the following Advance/Decline line chart, it could have some trouble doing so in the immediate future.
Since reaching a peak in mid-July, Advance/Decline lines for NASDAQ and Russell 2000 have been trending lower with the occasional blip higher. This is confirmation that the rally is narrowing and fewer and fewer stocks are actually advancing. The divergence between NASDAQ and Russell 2000 compared to NYSE and S&P 500 is another area of concern as it could be an indication that investors and traders could be rotating to more defensive areas of the market.
Stock Portfolio Updates
Over the past three weeks since last update, S&P 500 climbed 1.5% through yesterday’s close. Russell 2000 slipped 0.3% over the same time period. Overall, the entire Stock Portfolio climbed 0.3% excluding any dividends or trading fees. Mid-caps performed the worst falling 0.2%. Large-caps were best adding 1.4% while Small-caps edged higher by 0.2%. Compared to the S&P 500, the overall portfolio’s performance lagged due to a still sizable cash position and three positions being stopped out.
June’s basket of Defensive Stocks is performing nicely. Of the 21 stocks selected eighteen are positive, one is negative and two were recently stopped out. Including the stopped positions, the basket’s average performance is 4.7% compared to a gain of 2.7% by S&P 500 over the same time period. TE Connectivity (TEL) is the worst laggard still held in the portfolio, off 4.3%. This is a modest improvement from last update’s 6.6% decline. Intel (INTC) and Western Digital (WDC) were both stopped out on July 27. INTC has recovered modestly, but WDC is even lower now.
Of the nineteen remaining defensive positions, five are up double digits. The best performing position is still McCormick & Company (MKC), up 14.5% so far as of yesterday’s close. Not far behind is Church & Dwight (CHD) up 12.5%. You may not immediately recognize this company, but chances are you have at least one of their products in your home at this moment and possible more. Some of its brands include: Arm & Hammer, Oxiclean, Nair, Orajel, First Response, Waterpik and Trojan.
Global Brass and Copper Holdings (BRSS) recent struggles with the decline in copper price came to an end when they reported Q2 earnings a week ago. Solid earnings results along with a 50% increase in their quarterly dividend and the announcement of a share buyback program was more than enough to end the recent retreat in share price. BRSS climbed 14.8% since last update as a result.
Thus far, the market has proven to be quite resilient, but it is still early August and midterm elections are still about three months away. Tariffs, the Fed or some yet unknown geopolitical issue could still spark a meaningful pullback during this historically unfavorable time period. Cash and defensive positions held in the portfolio can provide some level of protection during this period. All positions in the portfolio are currently on Hold. Please see portfolio table below for updated stop loss suggestions.
|
ETF Portfolio Updates: Bonds Ease, Other Defensive Sectors Pay Off
|
|
By:
Christopher Mistal
|
August 02, 2018
|
|
|
|
July’s employment situation report, typically released on the first Friday of August, has largely been a market disappointment over the last seventeen years. DJIA, S&P 500, NASDAQ, Russell 1000 and Russell 2000 have all declined a majority of the time. Average, historical performance on the day has been negative with Russell 2000 declining the most, off 0.55%. Across the board strength in four of the last six years has improved average performance as the prior twelve year stretch was nearly all bearish.
Yesterday’s ADP private sector employment report showed 219k jobs were added in July. This was well above the consensus estimate of 185k and the report also came with an upward revision to June’s number. This suggests that tomorrow’s employment situation report could be solid as well. Current estimates are looking for around 193k net new jobs being added in July and the unemployment rate is anticipated to decline to 3.9% from 4%.
Solid labor market numbers have become a double-edged sword for the market. More people employed means more money to spend, but it also puts pressure on inflation expectations and the Fed to continue to tightening monetary policy by raising interest rates. Higher rates are already starting to hit the housing market and have sent ripples through some emerging markets. Tariffs and isolationist trade policy is a real concern, but the Fed is the biggest risk to the economy. If they tighten too quickly or too much they run the risk of triggering a recession as growth remains fickle.
New Trade Ideas for August Seasonalities
Biotechnology sector enters its historical favorable season in August. iShares NASDAQ Biotech (IBB) could be bought on dips below $112.00. Maintain the existing stop loss at $100.27. The auto sell is $141.31 based upon historical average performance and the new buy limit. A 14.7% average gain has occurred over the last 15 years while an average gain of 18.3% has taken place the most recent 5 years. Top five holdings are: Biogen, Gilead Sciences, Amgen, Celgene and Illumina. This sector has been slowly recovering since falling from grace in mid-2015. Prescription drug prices are in the spotlight, but this sector has the potential to cure disease, not just treat symptoms.
IBB is an existing position in the portfolio that is being held for its historical track record of performing reasonably well during the “Worst Months,” May through October. If IBB trades below its buy limit we will officially add to the existing position. If you currently do not own a position in IBB, it can be considered on dips below its buy limit of $112.00.
Over the last 15 years, High-Tech has generated an average return of 12.0%, and for the last five years the average has been 7.4% during its bullish season from mid-August to mid-January. Our top ETF within this sector is iShares DJ US Tech (IYW). A buy limit of $179.90 and stop loss of $161.95 are appropriate. If high-tech produces above average gains, profits will be taken at the auto sell of $221.70. IYW’s top five holdings are: Apple, Microsoft, FB, GOOG and INTC. These five holdings represent 53.95% of IYW’s total holdings. Tech has been an unstoppable freight train of returns and that trend is likely to continue.
ETF Portfolio Updates
The summer doldrums and the worst two-month span (August-September) of the year have arrived. After briefly faltering at the end of July, technology shares have reasserted themselves into the leadership role. As a result, NASDAQ and S&P 500 are now higher than their respective July closes. DJIA is still lagging. Due to recent market strength many of the defensive positions that were modestly positive last update are now slightly negative. iShares 20+ Year Bond (TLT) and iShares US Aggregate Bond (AGG) were down a fraction of a percent at yesterday’s close.
However, other defensive positions have held up. SPDR Utilities (XLU) is still up 6.6% since its addition to the portfolio. SPDR Healthcare (XLV), iShares NASDAQ Biotechnology (IBB) and SPDR Consumer Staples (XLP) have all advanced over the last month. With the exception of IBB, all of these defensive positions are currently on Hold.
Last month’s new trade ideas in gold and silver, GDX, GLD and SLV, did not pan out. All three were added in the first half of July and all three were then quickly stopped out. Higher interest rates and tightening monetary policy, globally, is likely to blame for the lack of investment interest in precious metals and the stocks that mine them. Gold’s current trajectory suggests it could be headed to test its lows from late 2016 while silver looks like it is on its way to its lows from late 2015. Considering the current geopolitical environment, gold and silver could also just as quickly find support and rebound.
iShares Transports (IYT) was shorted on July 26 when it traded above $197.02. Its stop loss has been raised to $207.00 which is just above its all-time intra-day high traded in January. If new tariffs do begin to dampen global trade, then this sector should be one of the first to feel the effects of reduced trade. Hold the IYT short position.
Please see table below for current advice and stop losses.