|
Market at a Glance - 8/26/2021
|
|
By:
Christopher Mistal
|
August 26, 2021
|
|
|
|
8/26/2021: Dow 35213.12 | S&P 44470.00 | NASDAQ 14945.81 | Russell 2K 2213.98 | NYSE 16694.32 | Value Line Arith 9562.68
Fundamental: Decelerating. Although the second estimate of Q2 GDP was revised 0.1% higher to 6.6%, estimates for Q3 are slipping. According to the Atlanta Fed’s GDPNow Forecast, Q3 growth is projected to be 5.7% as of its update on August 25 from 6.1% the prior week. Corporate earnings growth is also slowing as easy year-over-year comparisons fade into history. Housing and labor markets are cooling as the pace of gains in both are also moderating. Broad moderation across the economy as it continues to struggle to return to “normal” is likely to have a similar effect on equity market returns going forward.
Technical: Stretched. DJIA, S&P 500 and NASDAQ have all recently broken out to new all-time highs. However, momentum appears to be waning. Weekly and cumulative advance/decline metrics are still mixed suggesting the move to marginally higher new highs has occurred with limited participation. Historically as participation fades so has the rally.
Monetary: 0 – 0.25%. Fiscal and monetary policy both remain highly support, but for how much longer is the key question. Discussions of when and how the Fed will taper bond purchases are accelerating and some clarity may be given on Friday, August 27, when the annual Jackson Hole symposium takes place virtually due to the Delta variant’s seemingly unchecked spread. Any insights provided could have the potential to move the market in either direction and in a meaningful and significant manner.
Seasonal: Bearish. September is the worst DJIA, S&P 500, NASDAQ, Russell 1000 and Russell 2000 month. Average declines range from –0.4% from Russell 2000 to –0.7% by DJIA. In post-election years since 1950, September is still ranked no higher than #9 while average performance remains negative with only a modest improvement.
Psychological: Bulls retreating. According to
Investor’s Intelligence Advisors Sentiment survey Bullish advisors have slipped to 50.0%, their lowest number since May 2020. Correction advisors have increased to 31.5% while Bearish advisors have crept up to 18.5%. The ongoing retreat in bullish sentiment combined with a modest uptick in correction/bearish is encouraging, but overall sentiment is still at levels that call for caution.
|
September Outlook: End of Q3 Has Been Challenging
|
|
By:
Jeffrey A. Hirsch & Christopher Mistal
|
August 26, 2021
|
|
|
|
Aloha friends. We’ve seen a lot these past two weeks in Hawaii from snorkeling with sea turtles and swimming in waterfalls on Maui to the southernmost point in the U.S. and Kilauea Caldera on the Big Island, then to surfing Hanalei Bay and hiking the Na Pali Coast in Kauai and now Waikiki Beach on Oahu for the last leg of the trip. We will be heading to Pearl Harbor National Memorial and Banzai Pipeline before heading home. We joke each time we jump to a new island that this is our favorite island so far.
Economically the islands are booming again despite the governor’s recent call for tourists not to visit the islands right now and restaurants at 50% capacity. Rental cars are rather scarce and super-high priced. The Islands are bustling, though you can still see the economy being held back by the pandemic fears and protocols, but the Aloha Spirit prevails.
As the summer travel season winds down here in Hawaii as well as on the Mainland and the rest of the world the market faces seasonal challenges as the third quarter comes to a close in the September, which is still the worst month of the year. The market is also struggling technically on the charts and has been exhibiting weak market internals.
Some geopolitical hotspots have flared up, namely our old nemesis Afghanistan, as well as persistent troubles in the Middle East, the Far East and with Russia. Add in fears of the Delta variant fourth wave of Covid-19 and Fed taper chatter and the potential for a late-August/September selloff increases or at least pause in the march to continued new highs. But until the fiscal spending spigot flow rate is reduced and the Fed telegraphs it will begin to tighten the market is likely to wander higher on stimulus and easy money.
As you can see in the updated chart here of the S&P 500 One-Year Seasonal Pattern Since 1949, the market has so far defied the typical seasonal summer weakness it normally exhibits. The market continues to rally on pent up demand from pandemic restrictions as well as trillions in federal fiscal stimulus and continued quantitative easing and still historically low interest rates from the Federal Reserve.
If the market continues to defy gravity and rallies through Labor Day, the next most likely weak spot is the end of September after Triple Witching on the third Friday of September as noted by the two purple arrows in the chart. We are not expecting any major sell off here. At most we’d expect a 5% correction or so as the market succumbs to some of the same headwinds we have been experiencing all year.
Sentiment remains elevated though bullish advisors have diminished some with a few more bears and the weekly put/call ratio in the Pulse has up ticked. Valuations remain elevated as earnings growth has likely peaked and the easy comps to last year’s pandemic lows fade away. Market breadth is not too fresh with a dearth of new highs and expanding new lows as the indices have logged new highs. Weekly advancing stocks versus declining stocks have been mixed as well.
We continue to expect the market to wander higher with the potential for a pause or sell off highest toward the end of September. Any late-September/October sell off would set up out next Best Months Seasonal MACD Buy Signal quite well and we still expect the S&P 500 to finish the year in the 4500-4600 range or even higher.
Pulse of the Market
With the support of easy monetary policy, Federal spending, and solid corporate earnings, DJIA has avoided typical seasonal weakness this August climbing to multiple new all-time closing highs and a gain of 1.3% as of its close on August 25. However, the new closing highs were all around mid-month (1) which has historically been the strongest part of the month. Prior to and after mid-month, DJIA has been meandering unable to sustain the run higher or make a clear move meaningfully lower. As a result both the faster and slower moving MACD indicators applied to DJIA are currently negative (2).
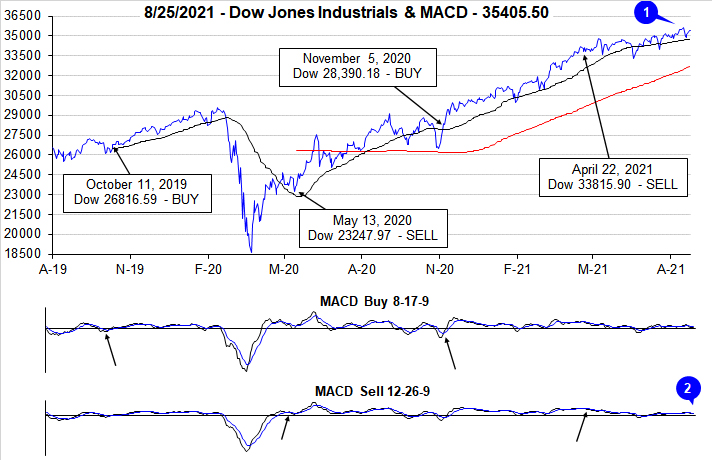
Late July and early August weakness did trigger DJIA’s third Down Friday/Down Monday (DF/DM) warning of the year (3). Similar to the mid-July occurrence, DJIA did quickly recover its modest losses which have historically been followed by a lower chance of any additional weakness in the near-term. DJIA’s current streak of 16 of the last 20 Friday’s being positive shows traders and investors must be growing increasingly comfortable with the economy and the market.
For the most part S&P 500 performance (4) has mirrored DJIA. Since the final week of June both DJIA and S&P 500 have advanced six out of nine weeks. NASDAQ (5) has one additional weekly loss over the same time period. All three indexes moving in the same direction at the same time suggests the impacts of Covid-19 are falling as all corners of the economy return or at least appear to be heading ever closer to pre-pandemic levels.
Market breadth measured by NYSE Weekly Advancers and NYSE Weekly Decliners (6) has been mixed over the past four weeks and remains an area that warrants attention. Typically Weekly Advancers will outnumber Weekly Decliners in positive weeks and vice a versa during down weeks. The greater the advantage one has over the other generally correlates with the magnitude of the move. This has not always been the situation in recent weeks.
The trend of Weekly New Highs (7) is also worrisome as they continue to shrink even as the major indexes traded at new all-time highs recently. Last week’s number of Weekly Highs was well below their peak reached in mid-March at 951. New Weekly Lows are now troublingly expanding. Last week’s count of 248 was the highest since late March when they hit 262. To find a greater number of New Weekly Lows you have to go back to the beginning of the pandemic in March and April of last year.
Interest rates have been relatively stable over the past seven weeks with the 30-year Treasury yield (8) oscillating around 1.90%. This could change soon as many are expecting Fed officials to signal their approach to tapering asset purchases this week during its annual Jackson Hole symposium (now virtually) on Friday, August 27.
|
September Almanac: Worst Month of Year Over Last 71 Years
|
|
By:
Christopher Mistal & Jeffrey A. Hirsch
|
August 19, 2021
|
|
|
|
Start of the business year, end of summer vacations, and back to school once made September a leading barometer month in first 60 years of 20th century, now portfolio managers back after Labor Day tend to clean house Since 1950, September is the worst performing month of the year for DJIA, S&P 500, NASDAQ (since 1971), Russell 1000 and Russell 2000 (since 1979). After four solid years from 1995-1998 during the dot.com bubble buildup, S&P 500 was down five Septembers straight from 1999-2003. In the 17 years since, S&P 500 has advanced 11 times in September and declined six times.
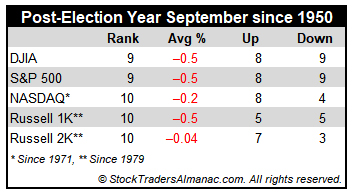
In post-election years, September’s overall rank improves modestly in post-election years going back to 1953 (third or fourth worst month depending on index). Average losses are little changed. Although September 2001 does influence the average declines, the fact remains DJIA and S&P 500 have declined in 9 of the last 17 post-election year Septembers. Russell 2000 has the best post-election year record, up seven times in 10 years.
Although the month used to open strong, S&P 500 has declined nine times in the last thirteen years on the first trading day. As tans begin to fade and the new school year begins, fund managers tend to sell underperforming positions as the end of the third quarter approaches. This has caused some nasty selloffs near month-end over the years. Recent substantial declines occurred following the terrorist attacks in 2001 (DJIA: –11.1%), 2002 (DJIA –12.4%), the collapse of Lehman Brothers in 2008 (DJIA: –6.0%) and U.S. debt ceiling debacle in 2011 (DJIA –6.0%).
September Triple Witching week is generally bullish with S&P 500 advancing nearly twice as many times as declining since 1990 but is has suffered some sizable losses. Triple-Witching Friday was essentially a sure bet for the bulls from 2004 to 2011 but has been a loser six or seven of the last nine years, depending on index with S&P 500 weakest, down eight of the last nine. The week after Triple Witching has been brutal, down 25 of the last 31, averaging an S&P 500 loss of 0.94%. In 2011, DJIA and S&P 500 both lost in excess of 6%. The week after was last positive in 2016 and 2017 for DJIA and S&P 500.
In recent years, Labor Day has become the unofficial end of summer and the three-day weekend has become prime vacation time for many. Business activity ahead of the holiday was more energetic in the old days. From 1950 through 1977 the three days before Labor Day pushed the DJIA higher in twenty-five of twenty-eight years. Bullishness has since shifted to favor the two days after the holiday as opposed to the days before. DJIA has gained in 16 of the last 27 Tuesdays and 20 of the last 26 Wednesdays following Labor Day.
|
September 2021 Strategy Calendar
|
|
By:
Christopher Mistal
|
August 19, 2021
|
|
|
|
|
Stock Portfolio Updates: Banks and Defensive Positions Rally
|
|
By:
Christopher Mistal
|
August 12, 2021
|
|
|
|
With about a third of August already in the record books, the market has thus far avoided typical seasonal weakness. August got off to a choppy start, but as of yesterday’s close DJIA, S&P 500, NASDAQ, Russell 1000 and 2000 are all positive and well above historical average performance for the full month of August. Fueled by the prospect of more fiscal spending, in the form of a much-needed infrastructure bill, DJIA is leading the way higher this month, up nearly 1.6% as of today. S&P 500 and Russell 1000 are a close second up around 1.5%. NASDAQ and Russell 2000 are the laggards, both with gains just under 1%.
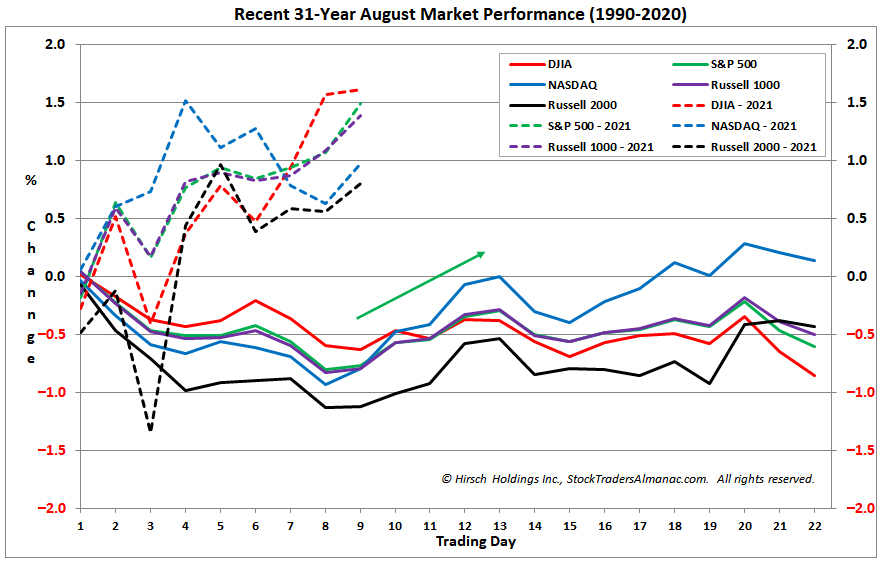
Compared to the historical average performance in August over the past 31 years, all five indexes are currently comfortably outperforming and are on course for a respectable month provided nothing pops up to knock them off their current course. Having already successfully sidestepped the usually weak first nine days of August, the market could be set for further gains to finish this week and next as mid-August has historically been the bright spot of the month. However, after a mid-month run the market has tended to stumble and drift sideways to lower through the end of the month. On average, only NASDAQ and Russell 2000 have managed to climb above their respective mid-month highs by month’s end.
Late August is prime vacation time for many. Historically it is during this time when trading activity and volume tends to make its annual bottom (page 48 of 2021 STA). In the absence of volume, small misses in economic data and/or exogenous events can have a greater impact on markets. This combined with August’s historically poor track are why it is part of the “Worst Months” and why a cautious stance remains the prudent course of action.
Stock Portfolio Updates
Over the last five weeks since last update through yesterday’s close, S&P 500 climbed 1.9% higher while Russell 2000 dipped 0.6% lower. During the same time period the entire portfolio advanced 0.8% excluding dividends and any fees. Mid- and Large-cap positions were responsible for the vast majority of gains by the portfolio. Mid-caps climbed 3% while Large-caps advanced 2.9%. Our Small-cap stocks collectively slipped 0.9% lower.
Weakness in the Small-cap portion of the portfolio was the result of a sharp and swift decline by Avid Tech (AVID). Quarterly earnings were better than estimates and guidance was at least good relative to many other companies, but apparently none of this was good enough to quash some aggressive profit taking. The magnitude of recent gains undoubtedly contributed as AVID was up 177.5% last update after accounting for selling half of the original position when it first doubled. As a result of the selloff, AVID was stopped out of the portfolio when it closed below its stop loss on August 4 for a total gain of 132.4%.
The recent modest rebound in the 10-year Treasury bond yield appears to have given most financial stocks in the Small-cap portfolio a nice boost. Shares of Atlantic Union (AUB), WSFS Financial (WSFS) and Customers (CUBI) all advanced nicely over the last five weeks. South State (SSB) would be the exception. Its recent decline could be the result of its primary location and Covid-19, Florida. Mixed second quarter earnings could also be weighing on shares. SSB did exceed earnings per share estimates, but revenues were lighter than anticipated. AUB, WSFS, CUBI and SSB are on Hold.
Mid-cap portfolio standouts over the past month include Algonquin Power (AQN), Valmont Industries (VMI) and Black Hills (BKH). AQN and BKH are both utilities and likely rallied in response to gains across the broader sector. VMI is in the metal fabrication industry and is likely on the rise in anticipation of the pending infrastructure bill slowly working its way through Congress.
Stepan Co (SCL) is the worst performing Mid-cap stock, off 6.4% as of yesterday’s close. SCL’s specialty chemical products are used by a wide variety of industries and this diversity likely helped it beat revenue estimates for the most recent quarter, but rising costs ate away at revenues resulting in a miss on the bottom line. For now we will continue to Hold SCL in the expectation that as headline inflation begins to moderate, SCL could find footing and reverse course.
Our Large-cap portfolio consists largely of defensive and/or dividend yielding positions (shaded light grey in table below). Even with major indexes advancing, most of these positions performed well over the past month as yield hungry investors returned and started picking up these positions. AT&T (T) is the only Large-cap position in the red when its dividend yield is excluded. T is something of a boring company and it was added primarily for its dividend and the possibility that 5G service could potentially pull in some new subscribers. We will need to wait and see. In the meantime T’s price has been relatively stable and its dividend sizable.
All positions in the portfolio are on Hold. Please see table below for specific stop losses and current advice for each position.
|
ETF Trades: Limited Buying on Dips as Headwinds Build
|
|
By:
Christopher Mistal
|
August 05, 2021
|
|
|
|
July’s employment situation report, normally released on the first Friday of August, has largely been a market disappointment over the last twenty years. DJIA, S&P 500, NASDAQ, Russell 1000 and Russell 2000 have all declined a majority of the time. Average, historical performance on the day has been negative with NASDAQ declining the most on average, off 0.50%. Strength in five of the last nine years has improved average performance as the prior eleven-year stretch was nearly all bearish.
![[Performance (%) on Employment Report Date in August Table]](/UploadedImage/AIN_0921_20210805_Jobs_Report_Day_table.jpg)
Yesterday’s ADP private sector employment report showed 330k jobs were added in July. This was barely more than half of the 653k that had been estimated by Dow Jones. ADP also revised its June total modestly lower than initially reported. Although the ADP report has varied widely at times from the official BLS (Bureau of Labor Statistics) release, it has been tracking rather closely this year. This would seem to suggest a miss is in the cards for tomorrow’s report. Expectations for the BLS report are for another 845k net job gains.
As we noted recently, the labor market does appear to be softening or at least plateauing at a level above pre-pandemic numbers. This would also be consistent with recently reported softer than expected economic growth represented by Q2 initial GDP falling short of estimates last week. Thus far the market has largely shrugged off this weaker data in favor of much better-than-expected corporate earnings. But underneath the strength in major indexes, breadth remains an issue along with the lack of new weekly highs.
A softening of fundamental data, tepid market breadth and a surge in Covid-19 cases due to the Delta variant are potentially major headwinds to the market. Add in bearish seasonal factors and elevated valuations in some areas of the market and current conditions appear favorable for a market pause at a bare minimum with the possibility of a pullback or correction also being somewhat elevated in the near-term. Caution remains the prudent course of action at least until some of these concerns abate.
New Trade Ideas for August Seasonalities
Although two new bullish sector trades begin in August, we will be sticking with a cautious approach. Both new long trade ideas are suggested on dips. This is consistent with our near-term view that the market is primed for some weakness, but it is likely to be mild and we still anticipate new all-time highs later this year, most likely in the historically bullish fourth quarter.
Biotechnology sector enters its historical favorable season in August. SPDR S&P Biotech (XBI) could be considered on dips below a buy limit of $120.00. An initial stop at $108.00 is suggested. The auto sell is $151.40 based upon historical average performance. A 14.7% average gain has occurred over the last 15 years while an average gain of 4.2% has taken place the most recent 5 years. Top five holdings are: Moderna, Translate Bio, Intellia Therapeutics, Cytokinetics, and Celldex Therapeutics. In addition to XBI, IBB could also be considered on dips below $162.50.
![[SPDR S&P Biotech (XBI) Daily Bar Chart]](/UploadedImage/AIN_0921_20210805_XBI.jpg)
Over the last 15 years, High-Tech has generated an average return of 9.5%, and for the last five years the average has also been 9.5% during its bullish season from mid-August to mid-January. Our top ETF within this sector is iShares DJ US Tech (IYW). Set a buy limit of $100.00 and an initial stop loss of $90.00 if purchased. Should high-tech produce above average gains, profits will be taken at the auto sell of $120.45. IYW’s top five holdings are: Apple, Microsoft, Alphabet Class A & C shares and Nvidia. These five holdings represent 50.19% of IYW’s total holdings. Tech has been an unstoppable freight train of growth and performance, that trend is likely to continue, but there could be a pause or pullback before the next leg higher.
Sector Rotation ETF Portfolio Updates
The summer doldrums and the worst two-month span (August-September) of the year have arrived. Thus far it doesn’t really look or feel like it with the market slowly climbing higher lead by new all-time S&P 500 and NASDAQ closing highs today. However, for reasons previously mentioned above, we will stick with our strategy. As such the Sector Rotation portfolio is well positioned for the summer doldrums with exposure to defensive sectors and precious metals. Positions in SPDR Gold (GLD), SPDR Consumer Staples (XLP), iShares NASDAQ Biotech (IBB), iShares Silver (SLV), SPDR Healthcare (XLV) and SPDR Utilities (XLU) are on Hold.
Of this defensive group only SLV has been a disappointment. SLV was briefly a profitable position as recently as early June but has faded more recently. Historically, August has been a favorable month for gold and strength in gold has frequently translated into strength in silver. In anticipation of this strength, SLV can be considered at its current price up to a buy limit of $23.60. For tracking purposes, we will add to the existing SLV position using its average price on August 6.
Last month’s trade ideas shorting the transport and industrial sectors have been added to the portfolio. iShares Transportation (IYT) was shorted on July 8 when it traded below $255.00. SPDR Industrials (XLI) was shorted the following day when it traded above $103.50. As of today’s close, both positions are modestly positive and on Hold.
VanEck Vectors Gold Miners (GDX) has also been added to the portfolio. Similar to gold, GDX has just been bouncing around for the last month but it too could benefit if typical historical strength in gold does present this month. GDX is on Hold.
As a result of our NASDAQ Seasonal MACD Sell Alert issued on July 14, SPDR Consumer Discretionary (XLY) was closed out of the portfolio the following day using its average price. iShares DJ US Tech (IYW) was also to be sold when NASDAQ’s MACD Seasonal Sell triggered however, it was previously closed out when it traded above its Auto-Sell price of $101.39 on July 6.
Please see table below for current advice, updated buy limits and stop losses.
Tactical Seasonal Switching ETF Portfolio Update
Per our NASDAQ Seasonal MACD Sell Alert, Invescos QQQ (QQQ) was closed out on July 15 using its average price of $360.83 for a total “Best Months” gain of 23.3%. With the sale of QQQ, the Tactical Seasonal Switching Strategy is now in a fully defensive position for the balance of the “Worst Months.”
AGG and BND are positive with gains of 1.7% each as of yesterday’s close. AGG and BND are on Hold. Please note, stop losses have been added and are currently just below their respective average purchase prices. The objective of these positions is to preserve capital while offering a modest dividend.