|
October 2015 Trading & Investment Strategy
|
|
By:
|
September 29, 2015
|
|
|
|
|
Market at a Glance 9/29/2015
|
|
By:
Christopher Mistal
|
September 29, 2015
|
|
|
|
9/28/2015: Dow 16001.89 | S&P 1881.77 | NASDAQ 4543.97 | Russell 2K 1090.57 | NYSE 9601.42 | Value Line Arith 4155.61
Psychological: Skittish. Volatility, measured by CBOE VIX index has remained above 20 since August 21. Major indices are negative year-to-date again. There are death crosses on DJIA, S&P 500, NASDAQ and Russell 2000 charts. Bullish sentiment has nearly evaporated and few seem willing to hold onto positions over the weekend. Overall sentiment is nearly bearish enough for the market to bottom; all it needs is a reason. Improving data, an acceleration of inflation or an improvement in growth and earnings forecasts could do it.
Fundamental: Mixed. Corporate earnings remain challenged by weak commodity prices and a strong U.S. dollar. Inflation and inflation expectations are running below desired levels. Global growth and forecasts are tepid. Yet Q2 U.S. GDP was revised higher to 3.9% and our unemployment rate is at 5.1%. If U.S. growth can hold up, year-over-year comparisons of corporate earnings should improve next year provided the dollar does not surge higher and commodity prices remain flat.
Technical: Correction. DJIA, S&P 500 and NASDAQ are trading just above their respective closing lows from August 25 which is keeping alive the possibility of a “W” or 1-2-3 bottom chart pattern. The lows will need to hold or only be briefly violated followed by a rally back above mid-September highs in order for the pattern to be fulfilled and the bottom confirmed. Stochastic, relative strength and MACD indicators are all negative and at or near oversold levels signaling a bounce could come soon.
Monetary: 0-0.25%. Citing inflation and international developments, the Fed did not move at its September meeting. October is unlikely; December is a slight maybe while data and markets appear to think it will be 2016 before any interest rate increase happens. ZIRP (zero interest rate policy) will be seven years old in December, a few more months could not possible cause any more harm (or good) than has already been done, but moving too early would certainly cause some pain.
Seasonal: Improving. October is the last month of the “Worst Six Months” for DJIA and S&P 500 and the last month of NASDAQ’s “Worst Four Months”. Frightful history of market crashes aside, October has been improving in recent years, fourth best DJIA month with an average gain of 1.6%. It’s the third best S&P 500 month (+1.6%) and second best for NASDAQ (+2.3%). Keep an eye out for our Official MACD Seasonal Buy Signal. It can trigger anytime on or after October 1.
|
October Outlook: Patience, Buy Signal Setting Up
|
|
By:
Jeffrey A. Hirsch & Christopher Mistal
|
September 29, 2015
|
|
|
|
Patience is still in order. We are getting ready for our perennial Best Six Months Seasonal MACD Buy Signal, but there is no rush. The market is still reeling from the recent selloff and the technical and fundamental picture is not yet so favorable. Fundamentals may not improve so much over the next six months, but technical market indicators likely will – at least over the short and intermediate term.
While we anticipate a fourth quarter rally, new highs will be hard to come by. Seasonality has been rather helpful this year. We have been cautious since the spring and on the sidelines for the most part since our June 4 NASDAQ Best Eight Months MACD Sell Signal. The carnage that occurred in the worst two months (August and September) is nearing the end, though it does not appear to be over just yet.
In the meantime the Three Peaks and a Dome House Top Pattern (3PDH) we have been
tracking since last October, has run its course. This is not to say that the market will not go any lower, but by definition it has reached its minimum low which corresponds to the separating decline low of last October at points 10/14. In the chart below of the 3PDH we have also drawn the pending set up of a “W” bottom pattern or a 1-2-3 swing bottom formation (Our good friend
John Person schooled us on this pattern several years ago.) A break above the mid-September high around DJIA 16750 would be bullish.
MACD Seasonal Buy Signal Update
Our Seasonal MACD Buy signal cannot trigger until October 1 or later. Presently, the MACD indicators in the major averages have turned down. Stochastics and relative strength are also negative, but things are beginning to look oversold. Sentiment has become rather negative with more bearish advisors than bullish, though Put/Call has yet to go to extreme on a weekly basis. The daily CBOE equity only put/call ratio did go over 1.00 back on August 21 for one day.
In order for us to issue our official Best Six and Eight Months MACD Seasonal Buy signal we will be looking for confirmation across the three major averages: DJIA, S&P 500 and NASDAQ Composites. When this occurs and email will be sent to all subscribers after the close. At that time we will also update any open or new ETF sector trades, including a new buy limit for iShares NASDAQ Biotech (IBB) which was stopped out recently on the Hilary Clinton tweet. We believe this is overdone and relish the cheaper price opportunity, but please be patient, there is no rush. In the sagacious words of Baron Rothschild, “We never buy at the bottom and we always sell to soon.”
Pulse of the Market
DJIA plunged to its August 25 low in just a handful of days then slowly began to climb back before rolling over once again this month. DJIA appears to be tracing out a “W” or 1-2-3 bottom (1). Point 1 is the low on August 25; point 2 is its September 16 high and is in the process of finding point 3. For this pattern to complete, point 3 will need to be equal to or greater than point 1 and DJIA will need to rally back above point 2 to confirm the bottom is in.
As of yesterday’s market close the faster moving MACD “buy” indicator applied to DJIA (2) is negative again. A close today below 16,134.68 will also cause the slower moving MACD “sell” indicator to become negative. Near textbook end-of-Q3 weakness is setting our Seasonal MACD Buy signal up nicely. It can trigger on or after October 1. An email Alert will be sent when MACD indicators applied to DJIA, S&P 500 and NASDAQ are all on buy.
Over the past 20 weeks, there have been a total of 8 down Friday/down Monday warnings (DF/DM). The most recent two occurred at the end of August (3) and like nearly all DF/DM’s since 1999, market weakness has followed. Friday (or the last trading day of the week) has been down 14 of the last 20 weeks. Traders and investors reluctant to hold long positions over the weekend is a sign that market confidence is tepid. Any improvement to Friday’s trading could be an early sign that the market is ready to rebound.
Losses for the week ending August 21, –5.8% for S&P 500 (4) and –6.8% for NASDAQ (5) were the largest declines since September and August 2011 respectively. Declines from four years ago were near the tail end of the last market correction (a decline of 10-20%). Provided economic data and outlooks don’t deteriorate any further, the current correction could be nearing its end.
NYSE Weekly Advance, Decline, High and Low metrics continue to paint a weak outlook for the market. During positive weeks, Advancers only modestly exceed Decliners while during down weeks Decliners outnumber advancers by a wider margin (6). New Highs (7) most likely bottomed the last week of August at 18. That was the fewest number since May 2009. New Lows also spiked to their highest number that week since August 2011. The market’s final bottom may not yet be in, but New Highs and New Lows have likely recorded their extremes.
Weekly CBOE Put/Call Ratio (8) has recorded two readings above 0.80 in the past six weeks. The first reading was during the week ending August 21 and the second was September 18. This is an elevated level indicative of greater levels of fear and is in the range reached during the last market correction/mini-bear of 2011.
The 90-Day Treasury Rate (9) at 0.00 is not a typo and is the lowest it has ever been going back to 1954.
Click for larger graphic…
|
October 2015 Strategy Calendar
|
|
By:
Christopher Mistal
|
September 24, 2015
|
|
|
|
|
October Almanac, Vital Stats & Strategy Calendar: A Turbulent Month with History of Turnarounds
|
|
By:
By Jeffrey A. Hirsch & Christopher Mistal
|
September 24, 2015
|
|
|
|
October has a dreadful history of market crashes such as in 1929, 1987, the 554-point drop on October 27, 1997, back-to-back massacres in 1978 and 1979, Friday the 13th in 1989 and the 733-point drop on October 15, 2008. During the week ending October 10, 2008, DJIA lost 1,874.19 points (18.2%), the worst weekly decline in our database going back to 1901, in point and percentage terms. It is no wonder that the term “Octoberphobia” has been used to describe the phenomenon of major market drops occurring during the month. Market calamities can become a self-fulfilling prophecy, so stay on the lookout and don’t get whipsawed if it happens.
But October has become a turnaround month—a “bear killer” if you will. Twelve post-WWII bear markets have ended in October: 1946, 1957, 1960, 1962, 1966, 1974, 1987, 1990, 1998, 2001, 2002 and 2011 (S&P 500 declined 19.4%). Eight were midterm bottoms. Current market weakness, the first 10% correction in nearly four years, could be setting up October 2015 to be another “turn-around” month. History does suggest a down August followed by a down September has preceded a robust fourth quarter for the S&P 500.
Options expiration week in October provides plenty of opportunity. On the Monday before expiration the DJIA has only been down six times since 1982 and the Russell 2000 is up twenty of the last twenty-five years, seventeen straight from 1990 to 2006. Expiration day has a spotty record as does the week as a whole. After a market bottom in October, the week after options expiration is most bullish; otherwise it is susceptible to downdrafts.
Pre-election year Octobers are ranked dead last for DJIA (since 1951), NASDAQ (since 1971), and Russell 2000 (since 1979); second worst for S&P 500 (since 1951). Eliminating gruesome 1987 from the calculation only provides a moderate amount of relief. Should a meaningful decline materialize in October it is likely to be an excellent buying opportunity, especially for depressed technology and small-cap shares.
Since 1991, October, the first month of the fourth quarter has improved substantially, climbing to fourth best DJIA month with an average gain of 1.6%. It’s the third best S&P 500 month (+1.6%) AND second best for NASDAQ (+2.3%). Russell 2000 has not seen as much improvement with October climbing to #8. October’s typical performance appears in the next chart over the recent 21-year span 1994 to 2014. On average, early month weakness has proven to be an excellent buying opportunity, especially for NASDAQ (purple line) as early losses were quickly recouped leading to an average gain of over 3% from early month lows to the close.
![[Typical October Trading 1994-2014]](/UploadedImage/AIN_1015_20150924_Oct_seasonal.jpg)
October is also the end of the DJIA and S&P 500 “Worst 6 Months” and NASDAQ “Worst 4 Months”. Remain on the alert for our Seasonal MACD Buy Signal that can occur anytime on or after October 1. An email Alert will be issued when it triggers. At that time we may establish new long positions in SPDR DJIA (DIA), SPDR S&P 500 (SPY), PowerShares QQQ (QQQ) and iShares Russell 2000 (IWM). We may also pickup any remaining open recommendations from the ETF Portfolio.
| October (1950-2014) |
| |
DJI |
SP500 |
NASDAQ |
Russell
1K |
Russell 2K |
| Rank |
|
7 |
|
7 |
|
8 |
|
7 |
|
10 |
| #
Up |
|
39 |
|
39 |
|
24 |
|
23 |
|
20 |
| #
Down |
|
26 |
|
26 |
|
20 |
|
13 |
|
16 |
| Average
% |
|
0.5 |
|
0.8 |
|
0.6 |
|
0.9 |
|
-0.3 |
| 4-Year Presidential Election Cycle Performance
by % |
| Post-Election |
|
0.7 |
|
0.9 |
|
1.2 |
|
0.8 |
|
0.2 |
| Mid-Term |
|
3.1 |
|
3.3 |
|
4.2 |
|
4.7 |
|
3.9 |
| Pre-Election |
|
-1.0 |
|
-0.4 |
|
-0.8 |
|
-0.6 |
|
-2.7 |
| Election |
|
-0.8 |
|
-0.7 |
|
-2.1 |
|
-1.4 |
|
-2.6 |
| Best & Worst October by % |
| Best |
1982 |
10.7 |
1974 |
16.3 |
1974 |
17.2 |
1982 |
11.3 |
2011 |
15.0 |
| Worst |
1987 |
-23.2 |
1987 |
-21.8 |
1987 |
-27.2 |
1987 |
-21.9 |
1987 |
-30.8 |
| October Weeks by % |
| Best |
10/11/74 |
12.6 |
10/11/74 |
14.1 |
10/31/08 |
10.9 |
10/31/08 |
10.8 |
10/31/08 |
14.1 |
| Worst |
10/10/08 |
-18.2 |
10/10/08 |
-18.2 |
10/23/87 |
-19.2 |
10/10/08 |
-18.2 |
10/23/87 |
-20.4 |
| October Days by % |
| Best |
10/13/08 |
11.1 |
10/13/08 |
11.6 |
10/13/08 |
11.8 |
10/13/08 |
11.7 |
10/13/08 |
9.3 |
| Worst |
10/19/87 |
-22.6 |
10/19/87 |
-20.5 |
10/19/87 |
-11.4 |
10/19/87 |
-19.0 |
10/19/87 |
-12.5 |
| First Trading Day of Expiration Week: 1990-2014 |
| #Up-#Down |
|
20-5 |
|
18-7 |
|
17-8 |
|
19-6 |
|
20-5 |
| Streak |
|
D1 |
|
D1 |
|
D1 |
|
D1 |
|
D1 |
| Avg
% |
|
0.7 |
|
0.7 |
|
0.7 |
|
0.7 |
|
0.6 |
| Options Expiration Day: 1990-2014 |
| #Up-#Down |
|
12-13 |
|
16-9 |
|
16-9 |
|
16-9 |
|
12-13 |
| Streak |
|
U2 |
|
U2 |
|
U2 |
|
U2 |
|
D1 |
| Avg
% |
|
-0.1 |
|
-0.02 |
|
-0.001 |
|
-0.01 |
|
-0.06 |
| Options Expiration Week: 1990-2014 |
| #Up-#Down |
|
17-8 |
|
17-8 |
|
13-12 |
|
17-8 |
|
14-11 |
| Streak |
|
D1 |
|
D1 |
|
D1 |
|
D1 |
|
U2 |
| Avg
% |
|
0.7 |
|
0.8 |
|
1.1 |
|
0.9 |
|
0.7 |
| Week After Options Expiration: 1990-2014 |
| #Up-#Down |
|
15-10 |
|
13-12 |
|
14-11 |
|
13-12 |
|
13-12 |
| Streak |
|
U2 |
|
U2 |
|
U2 |
|
U2 |
|
U2 |
| Avg
% |
|
0.3 |
|
0.2 |
|
0.3 |
|
0.2 |
|
0.1 |
| October 2015 Bullish Days: Data 1994-2014 |
| |
6,
14, 20, 28, 29 |
6,
14, 16, 19, 20 |
6,
13, 14, 20 |
2,
14, 16, 19, 20 |
6, 13, 14, 20, 30 |
| |
|
22,
29, 30 |
29,
30 |
22,
29, 30 |
|
| October 2015 Bearish Days: Data 1994-2014 |
| |
7,
8, 12, 21, 26 |
7,
8, 12, 26 |
1,
26 |
8,
12, 26 |
7, 8, 26 |
| |
|
|
|
|
|
|
ETF Trades: Buying Weakness Ahead of “Best Six/Eight Months”
|
|
By:
Christopher Mistal
|
September 22, 2015
|
|
|
|
For 48 years the new edition of the Stock Trader’s Almanac has been released early in the fourth quarter. And for the past fourteen years we have been preparing Almanac Investor readers for the annual October ETF buying spree. This year is no exception, but before delving into October’s seasonalities, let’s do a quick review for new and seasoned followers alike.
Every year while preparing the annual Almanac, we revisit and analyze our sector seasonalities (STA 2016 pages 94, 96 and 98) in great depth in order to make adjustments for any new or developing trends. There have been a few minor revisions made to our Sector Seasonalities table over the past few years, but for the most part, sector seasonality has been reasonably on track since September 2009 with many sectors producing the bulk of their annual gains during their traditionally favorable periods. Years of sector research allows us to specify whether the seasonality starts or finishes in the beginning third (B), middle third (M) or last third (E) of the month based upon the number of trading days in the month.
The 2016 Almanac table follows. Keen observers and long-time readers will note the absence of several indices. Those indices that no longer appear are no longer being calculated or are not readily available in the public domain. In the place of discontinued indices we have added S&P Sector indices. Both long and short trade opportunities are researched with the best possible (and most statically viable) indices appearing below.
These entry and exit points will be the basis for our seasonal trades over the coming year. They are guidelines, as we generally look to enter new positions before the start of the favorable period and exit before its end. Occasionally a trade is closed out well in advance of the seasonality’s end. An outsized advance may trigger a trade at the suggested auto-sell price (a price target based upon past historical performance of the specific seasonality) or should strength fail to materialize, a stop loss could be reached.
There are twelve sector seasonalities that enter their favorable periods in October. The following trade ideas are made based upon these seasonalities. Currently, all buy limits are below current market levels. Should the market retest its August lows prior to our Seasonal MACD Buy Signal triggering sometime on or after October 1, we want to take advantage of the pullback to begin accumulating the following new positions.
New Ideas for October Seasonalities
Transports enter their historically favorable season at the beginning of October and it runs until May. iShares DJ Transports (IYT) is attractive below current levels with a buy limit of $134.08. The stop loss is $120.67 and auto sell is $175.95. Top 5 holdings are: FedEx, United Parcel Service, Kansas City Southern, Union Pacific and Ryder System. With nearly 70% of U.S GDP coming from consumers, seasonal strength in the consumer sector overlaps nicely with the transportation sector. All those holiday gifts need to be moved from the factories to the stores. Lower energy prices can also give this trade a boost. If IYT trades below its buy limit, we will cover the IYT short trade and simultaneously establish a new long position.
![[iShares DJ Transports (IYT) Chart]](/UploadedImage/AIN_1015_20150922_IYT.jpg)
Over the last 15 years, Telecom has generated an average return of 7.2%, but for the last 5 years the average has slipped to 4.4% during its bullish seasonality from the middle of October through yearend. The top ETF within this sector is iShares DJ US Telecom (IYZ). Use a buy limit of $27.25 and stop loss of $24.53. If above average gains materialize, take profits at the auto sell of $32.13. Top 5 holdings are: AT&T, Verizon, T-Mobile, Level Communications and SBA Communications. Aggressive competition has not been kind to growth, but IYZ does boast a 2.68% yield and new product offerings should bring consumers in for an upgrade.
![[iShares DJ US Telecom (IYZ) Chart]](/UploadedImage/AIN_1015_20150922_IYZ.jpg)
Semiconductors come into favor near October’s end and remain so until the beginning of December. This trade has averaged 12.7% and 10.2% gains over the last 15- and 5-year periods, respectively. iShares PHLX Semiconductor (SOXX) is the top selection. Establish new positions with a buy limit of $76.01 and utilize a stop loss of $68.41. Take profits at the auto sell of $94.23. Top 5 holdings are: Intel, Avago Technologies, Texas Instruments, QUALCOMM and Taiwan Semiconductor. We consumers have a near insatiable appetite for nearly all things tech, these are the companies that design and supply the brains for most of our favorite devices.
![[iShares PHLX Semiconductor (SOXX) Chart]](/UploadedImage/AIN_1015_20150922_SOXX.jpg)
The line between Broker/Dealer and Banking sectors has become increasingly fuzzy in recent years with both sectors averaging gains of 24.7% and 18.9% over the last 5 years. Instead of trading two smaller, somewhat less liquid ETFs as has been done in the past, SPDR Financial (XLF) is the better choice. Use a buy limit of $21.05 and a stop loss of $18.95 once a position has been entered. The auto sell is $26.81. Its holdings cover all things financial from insurance companies to stock exchanges. Top 5 holdings are: Berkshire Hathaway, Wells Fargo, JPMorgan Chase, Bank of America and Citigroup. The Fed has delayed raising rates again, but at some point they will go higher. A steepening yield curve combined with a respectably healthy labor market should give this group a boost.
![[SPDR Financial (XLF) Chart]](/UploadedImage/AIN_1015_20150922_XLF.jpg)
Yet another area exhibiting a reasonable amount of overlap is the Healthcare and Pharmaceutical sectors, at least as far as many ETFs are concerned. Healthcare has racked up a rather impressive 18.9% average return over the past five years while Pharmaceutical alone has been just 7.1%. SPDR Health Care (XLV) does an excellent job of representing both sectors and comes with the added bonus of holding several well-established biotechnology companies as well. XLV is attractive near current levels with a buy limit of $67.86. The stop loss is $61.07 and auto sell is $88.31. Top five holdings are: Johnson & Johnson, Pfizer, Gilead Sciences, Merck and UnitedHealth Group. Whether we like it or not, Obamacare is likely here to stay. It mandated coverage or a fine and did little to control prices. Despite certain Democratic-presidential-nominee-seeking comments, double-digit price increases will continue and this group stands to benefit (financially) the most.
![[SPDR Health Care (XLV) Chart]](/UploadedImage/AIN_1015_20150922_XLV.jpg)
Materials have a favorable period that runs from the beginning of October through the beginning of May with historical returns of 18.1% over both the last 15- and 5- year periods. Buy SPDR Materials (XLB) with a buy limit of $39.50. Once purchased, set a stop loss of $35.55 and an auto sell of $51.31. Top 5 holdings are: Dow Chemical, Du Pont, Monsanto, LyondellBasell Industries and Praxair. Outside of the energy sector, this group has been another big loser in 2015. Tepid global growth, actual and forecast, has depressed this bunch. Valuations are attractive and forecasts can change quickly which could lead to a rush to reenter this sector at any sign of improvement.
![[SPDR Materials (XLB) Chart]](/UploadedImage/AIN_1015_20150922_XLB.jpg)
Computer Tech comes into favor in early October and remains so until the beginning of January. This trade has averaged 12.2% and 9.3% gains over the last 15- and 5-year periods, respectively. SPDR Technology (XLK) is the top selection. Enter this trade with a buy limit of $37.70 and employ a stop loss of $33.93. Take profits at the auto sell of $46.53. Top 5 holdings are: Apple, Microsoft, Facebook, AT&T and Google (combining Class A & C shares would make GOOG the second largest holding). Apple is the largest current holding, at 16.55% of total assets. Smartphones and tablets are continually replacing desktops and laptops. Many of XLK’s holdings are well positioned to profit from this trend either directly or indirectly.
![[SPDR Technology (XLK) Chart]](/UploadedImage/AIN_1015_20150922_XLK.jpg)
Real Estate has seen returns of 13.2% and 13.0% over the last 15 and 5 years respectively from the end of October to the beginning of May. Vanguard REIT (VNQ) is our choice. Use a buy limit of $72.46 and a stop loss of $65.21 once a position has been entered. The auto sell is $90.23. Top 5 holdings are: Simon Property, Public Storage, Equity Residential, Health Care REIT Inc. and AvalonBay Communities. Although sensitive to interest rates, this trade provides exposure to rental markets, commercial and residential, which have been performing well recently.
Portfolio Updates
Defensive positions in TLT, IEF and AGG are on hold. We will continue to hold these positions until the “Best Six/Eight Months” officially begin sometime on or after October 1 when we issue our MACD Seasonal Buy signal Alert.
iPath DJ-UBS Coffee Sub-Idx TR ETN (COW) was stopped out on September 10 when it closed below $19.10. A 7.3% loss was recorded on this trade as typical seasonal strength in coffee was suppressed by ample supplies and a strong dollar.
SPDR Gold (GLD) should be closed out. Sell GLD. Shares did bounce modestly higher in August, but strength has been fading. For tracking purposes, GLD will be closed out of the portfolio using its average trading price (open plus close divided by two) tomorrow, September 23.
iShares NASDAQ Biotech (IBB), iShares US Tech (IYW) and SPDR Retail (XRT) can be considered on dips below their respective buy limits. Buy limit, Stop loss, auto-sell and presented price for XRT have been adjusted to account for its 2 for 1 split on September 11.
Disclosure Note: At press time, officers of the Hirsch Organization, or accounts they control did not hold any positions in the ETFs mentioned in this Alert, but may buy or sell at any time.
|
Mid-Month & MACD Seasonal Buy Signal Watch Updates: Fed Stands Pat
|
|
By:
Christopher Mistal
|
September 17, 2015
|
|
|
|
Finally we have our answer. The September FOMC meeting has come and gone and interest rates remain unchanged, exactly the same place they have been since the Fed took emergency action at the start of the financial crisis in December 2008, 0 to 0.25%. Primary justifications for not starting to hike rates were tepid inflation (and inflation expectations) along with mounting pressures to growth from outside the U.S. These were the precise reasons why we expected the
Fed would take another timeout at this meeting.
Today’s Fed meeting was also accompanied by the release of a Summary of Economic Projections. Some notable and perhaps worrisome revisions were made to U.S growth and inflation forecasts when compared to June’s projections. Growth projections for 2016 and 2017 were modestly lowered, 2018’s estimate matched the longer run estimate, but both were lower than 2015, 2016 or 2017. A low 2% U.S. GDP forecast for essentially the foreseeable future is nothing to be excited about. Inflation estimates also slipped in 2016 and 2017 while the Fed’s 2% target does not seem likely until 2018 now.
As a result of international developments, tepid growth and inflation estimates the projected path of a higher Fed funds rate has also moved out on the timeline. Four members now believe the appropriate timing for policy tightening is in 2016 and beyond.
At this juncture, the market’s reaction to the announcement has been mixed. Initially negative, then positive and negative to end the trading day. Arguably, any positive economic benefits of near-zero rates have likely been exhausted after nearly seven years. New uncertainty has been presented to the markets by way of lower growth and inflation projections while the uncertainty of when interest rates may finally begin to move higher still remains. Until this uncertainty diminishes a choppy, volatile market is expected to remain. A rate increase next month seems unlikely. Even a December move may be premature. Rates could stay unchanged until the first quarter of 2016 given the most recent trends in some economic data.
MACD Seasonal Buy Signal Update
Our Seasonal MACD Buy signal cannot trigger until October 1 or later. Presently, the MACD Buy indicator (MACD (C,8,17,F)) in the following charts of DJIA, S&P 500 and NASDAQ is positive and has been so since the market partially bounced back from it precipitous mid-August decline. Stochastic and relative strength indicators have also been improving since the start of September however, the market’s climb higher has slowed and could eventually falter as it digests the latest developments from the Fed and abroad.
![[S&P 500 Daily Bar Chart]](/UploadedImage/AIN_1015_20150917_SP500.jpg)
![[DJIA Daily Bar Chart]](/UploadedImage/AIN_1015_20150917_DJIA.jpg)
![[NASDAQ Daily Bar Chart]](/UploadedImage/AIN_1015_20150917_NAS.jpg)
Given the recent flow of economic data and bearish week-after-options-expiration-week seasonality another wave of market weakness is anticipated sometime over the next several weeks. Should this weakness manifest it will likely reset technical indicators and offer a timely start to the Best Six/Eight Months.
When MACD indicators do signal a buy for DJIA, S&P 500 and NASDAQ
on or after October 1, we will issue our Seasonal MACD Buy Alert. Until that time we will continue to maintain a defensive posture in our
ETF and Stock portfolios.
|
Proving Grounds: “Don’t Miss the Best Days” Fallacy
|
|
By:
Christopher Mistal
|
September 15, 2015
|
|
|
|
It never ceases to amaze (amuse?) me, the great lengths that some people will go to discredit, diminish and/or down play “Sell in May.” In years when the market posts a gain between May and November, no matter how meager, it is rather easy. A simple, “see, I told you so,” but then in years like this year when it obviously did work out the skeptics will shout “it was a fluke, buy & hold still outperforms over the long-term.” At which point, they will dig up a chart of the S&P 500 or DJIA or similar going back to 1926 or 1900 or even back many centuries before this. And, yes, buy & hold has outperformed “Sell in May” since 1926 or 1900. If you bought then and have been holding since, I commend you on your investing prowess and longevity.
The only issue with starting way back then is the world is a much different place now than 100-plus years ago. Prior to about 1950, farming was a major portion of the U.S. economy and from 1901-1950, August was the best performing month of the year, up 36 times in 49 years (market closed in August 1914 due to World War I) with an average gain of 2.3%. July was the second best month, up 31 of 50 with an average gain of 1.5%. June was fourth best, averaging 0.9%. Why, you may ask. In a single word, harvesting. As crops were brought to market and sold cash began to move and so did the stock market.
Agriculture’s share of GDP began to shrink post World War II as industrialization created a growing middle class that moved to the suburbs where hard-earned salaries would be spent filling new homes with all the modern conveniences we all take for granted now. Farming became more efficient and fewer and fewer people worked on the farm. Suddenly, summer was less about the hard work of harvesting crops and more about vacations and relaxing. As the economy evolved and peoples’ lives changed, the market evolved. June and August went from being top performing months to bottom performing months. August went from #1 to #10 in 1950-2014 with an average loss of 0.1%. June went from #4 to #11 (–0.3% average loss). The shift in DJIA’s seasonal pattern is clear in the following chart. “Sell in May” is a post WWII pattern, prior to then it would have been “Buy in May”.
Don’t Miss the Best Days Fallacy
How many times have you seen a chart like the next one? This is (at least I have been told) a primary reason why you should never sell. If you sell, you will miss the best days and your returns will suffer dramatically. A $100,000 investment (excluding dividends, fees and taxes) beginning on December 31, 1993 would have grown to $439,335 on December 31, 2014 for a gain of $339,335. Missing just the Top 30 Best performing S&P 500 days results in a loss of $9,539. Clearly, the Best Days are important.
However, look at what happens when we shift focus to missing the Worst S&P 500 days. Missing the 50 Worst S&P 500 days between 1994 and 2014 results in a staggering $5,156,155 gain from the same hypothetical $100,000 investment.
Missing just the 50 Worst Days would be a feat of epic market timing especially since many of the Worst Days are also followed immediately by many of the Best Days. This is the very definition of market volatility. Down 4% on Monday only to snap back 4% on Tuesday. Even though the effect of missing the 50 Worst Days is substantially greater than missing the 50 Best Days here is what happens when both the 50 Worst & 50 Best are missed. This still outperforms buy and hold between 1994 and 2014.
How Our Seasonal Switching Strategy Beats the Market
Based upon the three bar charts above we should not be so concerned about missing the Best Days, it is actually the Worst Days that destroy returns. Our Seasonal Best Months Switching Strategy, often referred to as “Sell in May,” outperforms the broader market because it avoids a majority of the Worst Days while capturing the majority of the Best Days. Using the dates for our annual buy and sell signals,
located here, from 1994 to 2014 for S&P 500, our strategy has missed 26 of the Worst S&P 500 days while capturing 30 of the Best S&P 500 days. This combination is the reason why our strategy has outperformed.
Our Seasonal Switching Strategy is based upon Yale Hirsch’s discovery of the “Best Six Months,” November through April, shared in the 1986 Stock Trader’s Almanac. November through April did not become the “Best Six Months” until after 1950 for the reasons above. We do not claim the strategy worked before 1950 nor do we claim it will always work in the future however, as long as people continue to use the summer as vacation time and school resumes sometime in late August, early September, we expect it will continue to outperform the market over the longer haul.
It is fine to miss the Best Days especially if you miss the Worst Days too. On or after October 1 we will be waiting for our Best Six Months Seasonal MACD Buy Signal to trigger and will email you as soon as it does.
Final Thoughts
The above study was initially run using data from 1950-2014. The overall results mirrored those of the most recent 21-year period 1994-2004. A hypothetical $10,000 investment in S&P 500 (excluding dividends, fees and taxes) grew to $1,228,461 using buy & hold. Missing the 50 Best S&P 500 days trimmed results to just $104,275 while missing the 50 Worst days resulted in an eye-popping $23,091,315 (not a typo) balance on December 31, 2014. The combination of missing both the 50 Best and Worst S&P 500 days saw $10,000 grow to $1,960,055, still a substantial outperformance of buy and hold.
|
Stock Portfolio Updates: Blend of Long, Short & Cash Generates Gains During Market Meltdown
|
|
By:
Christopher Mistal
|
September 10, 2015
|
|
|
|
Simply put, pre-election year 2015 has been a disappointment for the market. Slowing, sluggish global growth, dragged down by a rapidly slowing Chinese economy and the expectation of the first interest hike in the U.S. since 2006 have weighed on markets. Compared to previous pre-election years, DJIA is now lagging by a sizable 20.1%. S&P 500 is behind by 17.6% while NASDAQ trails by a whopping 25.3% off its average. Even when comparing this Seventh Year of a presidential administration to the average of past Seventh Years, 2015 still falls short.
Looking at the above charts, it appears that typical early-fourth-quarter-pre-election-year weakness has arrived early this year (Seventh Years are heavily influenced by the crash of 1987). A retest of the August low is likely. Provided the outlook for global growth does not deteriorate further, history suggests a fourth quarter turn around for the market.
Stock Portfolio Updates
Over the past four and a half weeks since last update, through the market’s close on September 9, S&P 500 plunged 7.7%. Russell 2000 was down 6.1% over the same time period. Collectively the three Almanac Investor Stock Portfolios advanced 0.2%. Our stock portfolio was aided by short positions established throughout July and into early August as well as a sizable cash position. Mainly due to the number of short positions, the Large-Cap portfolio performed best, gaining 3.1%. Mid-cap stocks also registered a modest gain of 0.1% while small-caps slipped 0.3%.
Despite all of the volatility during recent weeks, not a single stock position was stopped out. Global Brass and Copper Holdings (BRSS) continued its stampede higher, now up 66.5% since last December. Its string of new 52-week highs has not been stopped by broad market weakness. Amerco Inc (UHAL) and Jetblue Airways (JBLU) are also higher now than they were at the start of August and are showing gains of 88.2% and 94.4% (partial profits have been taken already) respectively.
Of the remaining short positions, Bluebird Bio (BLUE) remains the best performing with a 14.8% profit as of yesterday’s close. Other double-digit winning short trades include Praxair (PX) and Blueknight Energy (BKEP). All Stop Losses associated with short positions have been updated. As the often treacherous second half of September and end of the third quarter is quickly approaching, all positions are on Hold. See table below for updated Stop Losses.
Disclosure Note: At press time, officers of the Hirsch Organization, or the accounts they control, did not hold any positions in the stocks mentioned in this article.
|
Seasonal Sector Trades: Another Opportunity for Crude Oil Bears
|
|
By:
By Christopher Mistal & Jeffrey A. Hirsch
|
September 08, 2015
|
|
|
|
Seasonally speaking, crude oil tends to make significant price gains in the summer, as vacationers and the annual trek of students returning to college in August creates increased demand for unleaded gasoline. The market can also price in a premium for supply disruptions due to threats of hurricanes in the Gulf of Mexico. However, towards mid-September, we often see a seasonal tendency for prices to peak out, as the driving and hurricane seasons begin to wind down. Crude oil’s seasonal decline is highlighted in yellow in the following chart.
![[Crude Oil (CL) Weekly Bars and Seasonal Trend Chart (Weekly Data Aug 2014 – September 8, 2015)]](/UploadedImage/AIN_1015_20150908_CL-Seasonal.jpg)
Shorting the February crude oil futures contract in mid-September and holding until on or about December 9 has produced 21 winning trades in the last 32 years. This gives the trade a 65.6% success rate and theoretical total gains of $99,860 per futures contract. Following three consecutive years of losses, this trade has been successful for three years straight. A sizable portion of last year’s crude collapse from over $100 a barrel in June to the lows in January was captured by this trade resulting in its second best profit to date.
![[September Short Crude Oil (February) Trade History Table]](/UploadedImage/AIN_1015_20150908_CL-History.jpg)
Many of the fundamental issues that triggered crude’s decline remain in place despite the 60-plus-percent decline in price over the past year. Global growth is still anemic, U.S. domestic supply is still growing, the U.S. dollar is still near multi-year highs and OPEC is still pumping as much as possible in an apparent bid to shake out higher-priced production. Downside is likely limited this year as lower prices are beginning to slow the growth of new supply and demand has been improving, at least according to weekly EIA data. Crude’s recent bounce from under $40 per barrel to present levels combined with weak seasonal factors is an attractive setup to this short-term short trade.
![[ProShares UltraShort DJ-UBS Crude Oil (SCO) Daily Bar Chart]](/UploadedImage/AIN_1015_20150908_SCO.jpg)
ProShares UltraShort Bloomberg Crude Oil (SCO) is the preferred vehicle to take advantage of seasonal weakness. SCO’s benchmark is the Bloomberg WTI Crude Oil Sub index which is comprised entirely of crude oil futures contracts. SCO is designed to return 200% of the inverse of the daily move of this index and has approximately $1 billion in assets. Its expense ratio of 0.95% is about average for a leveraged, inverse ETF.
Crude oil’s recent strength has resulted in a brisk for SCO. As a result, stochastic, relative strength and MACD Buy indicators are all negative. SCO could be bought on dips below $80.10. SCO will be tracked in the Almanac Investor ETF Portfolio. If purchased, a stop loss at $72.00 is suggested.
|
ETF Portfolio Update: Wild Ride Likely Not Over
|
|
By:
Christopher Mistal
|
September 03, 2015
|
|
|
|
The market’s wild ride since the middle of August has held the CBOE Volatility index (VIX) above 25 for 10 straight trading sessions. It initially spiked above 40 on August 24. Historically, when VIX has spiked, the market was at or very near a bottom. Past spikes were representative of extreme levels of fear and panic that were typically only seen at major bottoms. But, in the chart below showing the monthly bars of VIX v. S&P 500 this has not been the situation since financial crisis stuck the markets in 2008.
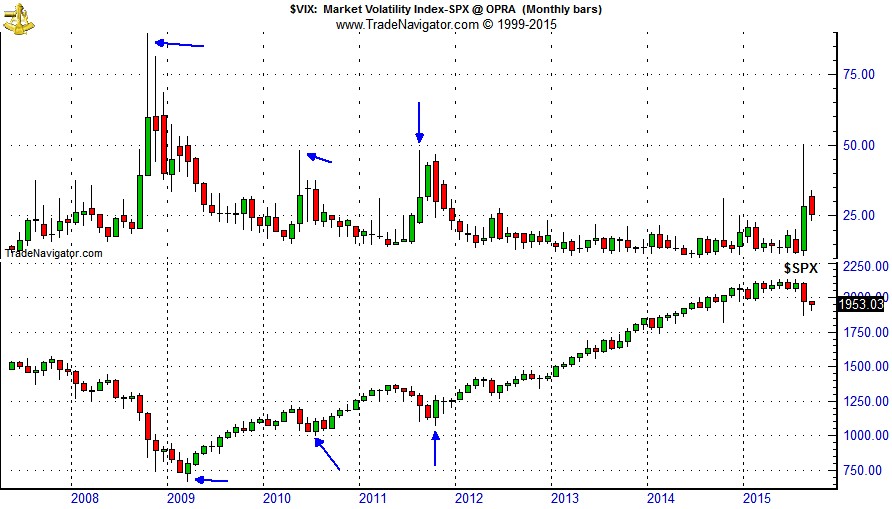
At the height of the financial crisis, VIX nearly reached 90 during the week ending October 24, 2008, but the market did not find bottom until nearly five months later on March 9, 2009 when the VIX had retreated into the 50’s (still elevated). The May 6, 2010 “flash crash” pushed VIX to 48.20 during the week ending May 21, 2010, but the S&P 500 did not reach bottom until July 2, 2010. Then again in 2011VIX spike to 48 in August and the market did not bottom until early October when VIX had modestly retreated.
An exact explanation as to why the correlation between VIX and the market has changed is elusive, but it could be the result of the increase in high frequency trading and trend following. Although there have only been a few examples in recent history to draw conclusions from, it is quite likely that this trend will persist and the final bottom of this market correction is still several weeks to a month or more in the future (late September, October or even early November).
ETF Portfolio Updates
Positions in SPDR Consumer Staples (XLP) and SPDR Healthcare (XLV) were stopped out in the market’s late August nosedive. Excluding any dividends and/or trading fees, XLP was closed out for a modest 1.7% gain and XLV an 11.1% gain. Both positions had been performing admirably well right up until mid-August. We will look to re-enter these positions later this month, in October or when or Seasonal MACD Buy signal triggers.
Of the three outright short positions held in the portfolio, only iShares DJ Transports (IYT) remains. During the mini crash of August 24, it just missed trading at or below its auto-sell price of 127.79 by less than 50 cents. SPDR Materials (XLB) and SPDR Financial (XLF) however did fall below their auto-sell prices and were covered. XLF has bounced while XLB remains under pressure due to ongoing Chinese economic concerns. XLF and XLB short trades netted a handsome 17.2% and 16.9%.
Other defensive positions in HDGE, TLT and AGG continue to mostly tread water. HDGE has made some headway and is now up 6.9%, but TLT and AGG are being held in check by the possibility of a Fed rate increase. Factoring in dividends, TLT and AGG are essentially flat. Given tepid inflation here in the U.S. and outright deflation worries in other parts of the globe, any rate increase is likely to be small in nature and likely to occur over a lengthy period of time. HDGE, TLT and AGG are on Hold.
Maintaining the position in ProShares UltraShort S&P 500 (SDS) proved prescient. Even with a relatively loose 5% trailing stop loss (based upon closing prices), SDS was not stopped out until the markets snap-back rebound on August 26. This brief trade resulted in an 18.8% gain while the market was momentarily in freefall.
It has been nearly two months and United States Natural Gas (UNG) has refused to trade below its buy limit. It has not gone up either. At this time, the UNG trade idea is cancelled.
During the August market rout, open trade ideas iShares NASDAQ Biotech (IBB), iShares US Tech (IYW) and SPDR Retail (XRT) were added to the portfolio when they all traded below their respective buy limits. Both the magnitude and swiftness of the market decline was not fully anticipated. IBB, IYW and XRT could have been, and in the case of IBB and IYW can still be, purchased for less. IBB, IYW and XRT on Hold. Additional purchase will be considered once the all clear has been sounded.
See table below for updated stop losses.
Disclosure Note: At press time, officers of the Hirsch Organization, or accounts they control did not hold any position in the ETF’s mentioned above.